

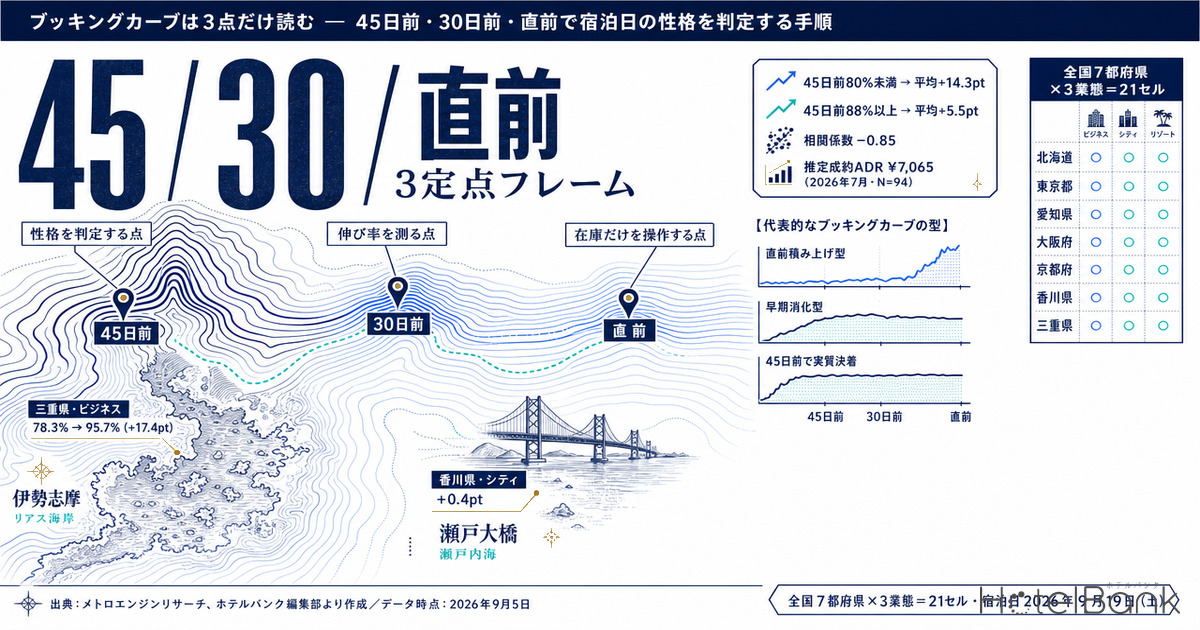
A booking curve is not something to watch every day. Once you accept that it only needs to be read at three fixed checkpoints — T-45, T-30 and the last-minute window, day-to-day decisions get dramatically lighter. Lining up 21 cells (7 prefectures × 3 property types) for the same stay date (Saturday, September 19, 2026) showed that cells whose estimated OCC was below 80% at T-45 (10 cells) went on to add an average of +14.3pt, while cells already at 88% or above (7 cells) added only +5.5pt. By the time you see the T-45 level, it is largely already determined whether that date is a “late-surge” date or a date that has essentially been decided. This article uses three real cases to build a procedure: judge the character of a date at the three checkpoints, then decide whether to move price or inventory.
Scope: 21 cells covering 7 prefectures × 3 property types (business hotels / city hotels / ryokan), plus individual cases in Mie and Kagawa, N=10–191 properties. The price metric in this article is estimated settled ADR (the transaction-price level inferred from OTA and other sales data, tax-excluded equivalent); occupancy is an estimate based on OTA-listed inventory. Definitions are given at the end of the article. Data as of September 5, 2026.
- — The T-45 level almost decides the character of the date. Across 21 cells of 7 prefectures × 3 property types (stay date September 19, 2026), cells below 80% estimated OCC at T-45 (10 cells) added an average of +14.3pt afterwards, while those at 88% or above (7 cells) added only +5.5pt (correlation coefficient −0.85).
- — Classify with two lines at T-45: 80% and 88%. Below 80% is a “still filling” date where pricing levers remain. At 88% or above the date is close to finished, and a price cut shaves rate rather than buying incremental demand.
- — At T-30, read the rate of pickup, not the level. The same +6–7pt gain means the opposite thing at 84.8% (Mie business hotels, 9/19) and at 97.0% (Mie ryokan, 9/21). Read level × pickup on two axes.
- — In the last-minute window, move inventory only — not price. Narrow the levers to relaxing minimum-stay rules, opening held-back room types, and how returned inventory is released. Mie business hotels added +10.9pt on 9/19 from T-30 alone.
- — Occupancy on daily checkpoints, rate on monthly finals. Estimated settled ADR is canonical monthly and should not be used for daily or day-of-week rate decisions. Not mixing the two time axes is the precondition for the framework.
What the three-checkpoint framework is — why T-45, T-30 and last-minute
If you track a booking curve every day, you react to 1–2pt wobbles and touch price too often. So fix the observation points at three. T-45 is the point where you judge the “character” of the date; T-30 is the point where you measure pickup and decide whether to raise or lower price; the last-minute window (roughly within two weeks) is the point where you operate only the release of inventory, not price. The estimated OCC used here (OTA-listed-inventory basis) is based on observations from 45 days before the stay date through the most recent day. Everything in this article therefore starts at T-45 and does not extend to any earlier phase.
Start with three representative cases. All are aggregates by area × property type, not the movement of any individual property.
Source: MetroEngines Research; compiled by the HotelBank Editorial Team
| Case | Stay date | N (properties) | T-45 | T-30 | Latest | T-45 → latest | Pattern |
|---|---|---|---|---|---|---|---|
| Mie · business hotels | 9/19 (Sat) | 89 (86 observed) | 78.3% | 84.8% | 95.7% 15 days out | +17.4pt | Late-surge |
| Mie · ryokan | 9/21 (Mon, holiday) | 191 (181 observed) | 90.1% | 97.0% | 99.2% 17 days out | +9.1pt | Early sell-through |
| Kagawa · city hotels | 10/10 (Sat) | 10 | 95.7% | not yet reached | 96.1% 36 days out | +0.4pt | Effectively settled at T-45 |
Source: MetroEngines Research; compiled by the HotelBank Editorial Team
Mie’s business hotels (N=89, 86 properties observed) on September 19 stood at 78.3% at T-45, 84.8% at T-30 and 95.7% at the latest reading (15 days out). That is +17.4pt from T-45, and most of it (+10.9pt) is concentrated after T-30. This is a textbook late-surge date: at T-45, nothing about it was settled yet.
Ryokan in the same prefecture (N=191, 181 properties observed) look different on September 21. They were already at 90.1% at T-45, 97.0% at T-30 and 99.2% at the latest reading (17 days out). Only +9.1pt of headroom remained, and the shape of the date was largely visible at T-45. The order in which Mie’s ryokan and resorts absorbed this year’s five-day holiday run is tracked day by day in Mie Silver Week: Sep 20 Ryokan 97.5% at T-31, Sep 23 Just 66.1%.
Kagawa’s city hotels (N=10) on October 10 moved only +0.4pt, from 95.7% at T-45 to 96.1% at the latest reading (36 days out). The T-30 checkpoint has not yet arrived for this date, but the three checkpoints are read in the order they arrive — there is no need to fill in a point that has not been reached with guesswork. Note also that with N=10 the base is small, so the premise is to read it alongside neighbouring dates and other property types in the same area rather than making decisions on a single day’s value.
The T-45 level all but determines how much headroom is left
Three cases alone could be coincidence. So for a single stay date (Saturday, September 19, 2026), we lined up T-45, T-30 and the latest reading (15 days out) for 7 prefectures × 3 property types = 21 cells. The result is clear: the higher the estimated OCC at T-45, the smaller the subsequent pickup (correlation coefficient −0.85 across the 21 cells). Widening the same cross-section to all 47 prefectures gives a median pickup of +4.1pt, so this inverse relationship is not confined to particular areas (Booking Curves Across 47 Prefectures: +4.1pt Median Pickup from T-45).
Source: MetroEngines Research; compiled by the HotelBank Editorial Team
| T-45 estimated OCC band | Cells | Average T-45 → latest pickup | How to read it |
|---|---|---|---|
| Below 80% | 10 | +14.3pt | Late-surge. Pricing levers still remain |
| 80–88% | 4 | +8.3pt | Middle pattern. Splits on the T-30 pickup rate |
| 88% or above | 7 | +5.5pt | Early sell-through. Settings made before T-45 have largely decided the outcome |
7 prefectures × 3 property types = 21 cells, stay date September 19, 2026. Source: MetroEngines Research; compiled by the HotelBank Editorial Team
Within the 21 cells, the largest pickup was Mie city hotels (N=14), from 73.7% at T-45 to 95.0% at the latest reading = +21.3pt; the smallest were Kagawa city hotels (N=10), 100.0% → 99.9% = −0.1pt, and Kagawa business hotels (N=84), 99.1% → 99.3% = +0.2pt. In the large metros, Tokyo business hotels (N=862, 849 properties observed) ran 77.8% → 83.4% → 91.1% = +13.3pt, Osaka business hotels (N=454) 73.2% → 78.1% → 85.3% = +12.1pt, and Fukuoka business hotels (N=311) 78.5% → 82.8% → 90.2% = +11.7pt. In each case T-45 sat in the 70s or just under 80%, and more than 10pt was added late.
It is worth separating whether this inverse relationship is driven by area or by property type. Rearranging the same 21 cells into a two-axis grid of area (7 prefectures) × property type (3 types) makes it clear that it is not that “an area is a late-surge area” — the pattern differs by each area × property type combination.
| Area \ property type | Business | City | Ryokan |
|---|---|---|---|
| Tokyo | 77.8% +13.3pt N=862 | 86.1% +8.4pt N=100 | 89.3% +6.6pt N=46 |
| Osaka | 73.2% +12.1pt N=454 | 86.5% +4.9pt N=91 | 70.6% +15.2pt N=30 |
| Fukuoka | 78.5% +11.7pt N=311 | 82.0% +6.5pt N=36 | 67.5% +16.3pt N=64 |
| Mie | 78.3% +17.4pt N=89 | 73.7% +21.3pt N=14 | 83.3% +13.6pt N=193 |
| Kagawa | 99.1% +0.2pt N=84 | 100.0% -0.1pt N=10 | 88.1% +9.7pt N=34 |
| Okinawa | 75.4% +10.3pt N=179 | 89.4% +5.4pt N=14 | 78.1% +11.0pt N=11 |
| Nagano | 89.1% +9.7pt N=148 | 93.0% +6.9pt N=16 | 78.4% +14.4pt N=457 |
Each cell shows “T-45 estimated OCC + T-45 → latest pickup”. Background indicates the T-45 band (blue = below 80% / grey = 80–88% / red = 88% or above). Source: MetroEngines Research; compiled by the HotelBank Editorial Team
Kagawa, for instance, sits in the early-sell-through zone at 88% or above at T-45 across all three property types, while Mie splits within a single prefecture: business at 78.3% and city at 73.7% are late-surge, and ryokan at 83.3% is the middle pattern. Read by property type instead, ryokan are low in Fukuoka (67.5%) and Osaka (70.6%) but high in Tokyo (89.3%) and Kagawa (88.1%) — so property type alone does not fix the pattern either. The unit of judgment is neither “area” nor “property type” but “area × property type × stay date” — and when sorting your own calendar, it is better not to borrow figures from another property type in the same area as-is.
Note that the population behind these 21 cells totals 3,243 properties and 379,278 rooms (the N for each cell is shown in the table). Beyond the pace of demand absorption, another premise for reading the grid is that the larger the base, the less an inventory action at one or two properties moves the aggregate. Between Tokyo business hotels (N=862, 124,809 rooms) and Okinawa ryokan (N=11, 128 rooms), the same “+10-something pt” carries different stability.
The decision rule that follows is simple. If T-45 is below 80%, it is a “still filling” date; if it is 88% or above, it is a date that is close to done. The former leaves room to go after demand with price; in the latter the headroom itself is small, so a cut tends to do nothing but shave rate.
T-30 is the point for reading pickup — and rate is not judged daily
At the second checkpoint, T-30, look at the gain since T-45 rather than the level itself. Mie business hotels on September 19 gained +6.5pt from T-45 to T-30, then a further +10.9pt to the latest reading — accelerating in the second half. Mie ryokan on September 21, by contrast, gained +6.9pt from T-45 to T-30 and only +2.2pt after that, having done its growing early. The same “+6–7pt at T-30” means the opposite thing depending on whether the level is 84.8% or 97.0%. In practice, read T-30 on two axes: level × pickup.
One important caveat here. What this three-checkpoint framework judges is occupancy, not rate. Estimated OCC can be observed daily, but the price metric — estimated settled ADR — is canonical monthly and is not material for discussing daily or day-of-week rate. Always check rate monthly, and specifically by taking a year-on-year comparison between finalized values for past months.
Source: MetroEngines Research; compiled by the HotelBank Editorial Team
| Area × property type | July 2025 (final) | July 2026 (final) | YoY | Most recent month (current estimate) |
|---|---|---|---|---|
| Mie · business hotels | ¥6,983 N=96 | ¥7,065 N=94 | +1.2% | Sep ¥9,722 N=90 |
| Mie · ryokan | ¥15,985 N=211 | ¥15,365 N=207 | −3.9% | Sep ¥14,623 N=205 |
| Kagawa · city hotels | ¥8,068 N=10 | ¥7,275 N=10 | −9.8% | Oct ¥10,830 N=10 |
Estimated settled ADR (tax-excluded equivalent). July 2025 and July 2026 are finalized; the most recent month is an estimate based on current sales conditions and may still change. Source: MetroEngines Research; compiled by the HotelBank Editorial Team
Mie’s business hotels posted an estimated settled ADR of roughly ¥7,100 in July 2026 (N=94), +1.2% against roughly ¥7,000 (N=96) a year earlier. Ryokan came in at roughly ¥15,400 (N=207), −3.9% year on year, and Kagawa’s city hotels at roughly ¥7,300 (N=10), −9.8%. The September and October figures are estimates based on current sales conditions, so a direct comparison with finalized values has to wait for month-end. Occupancy on daily checkpoints, rate on finalized monthly YoY — separating these two time axes is what makes the framework work.
In the last-minute window, operate only the release of inventory
At the third checkpoint — the last-minute window — narrow the levers to how inventory is released rather than price. Mie’s business hotels on September 19 added +10.9pt, from 84.8% at T-30 to 95.7% at the latest reading. Cutting price in this phase means accepting demand cheaply that would have come anyway. Conversely, on a date that has barely moved since T-45 — such as Kagawa city hotels on October 10 (+0.4pt) — a large price move is unlikely to produce a response either way. As for the level at which a last-minute discount actually makes a difference, our review of 1,161 properties and 2,904 price cuts found the gap emerges mainly on dates where sell-through is still below 70%.
What carries weight in the last-minute phase is inventory control: relaxing consecutive-night or minimum-stay conditions, opening room types that had been held back, and how cancelled inventory is put back on sale. The three-checkpoint framework is best thought of as a tool for mechanically drawing the line between when to touch price and when to touch inventory only.
For revenue managers using the three-checkpoint framework — implications and an action plan
(1) Use the T-45 level for classification, not prediction. Across the 21 cells, the group below 80% at T-45 averaged +14.3pt and the group at 88% or above averaged +5.5pt — a 2.6× difference in expected headroom. On your own calendar, start by sorting each date into one of three boxes based on the market’s T-45 level. Fix a menu of levers per box and day-to-day hesitation drops sharply.
(2) A high level does not necessarily mean a strong date. Mie ryokan on September 21 were high at 90.1% at T-45, but moved only +9.1pt afterwards. A date that is high at T-45 is close to sold out, but it is also a date whose outcome has already been locked in by the pricing set before that point. High-level dates need to be treated as material for reviewing “was the setting before T-45 appropriate?” rather than as something to chase on occupancy.
(3) Look at the gap between the market curve and your own. If the market is building from 78.3% at T-45 to 95.7% at the latest reading and your own property is flat, that can be isolated as a property-specific problem rather than general market weakness. Conversely, if your property alone is unfilled on a date where the market has moved only +0.4pt, question whether the demand exists at all before you question price.
(4) Do not judge small-N property types or areas on a single day. Kagawa city hotels here are N=10 and Mie city hotels N=14. At those base sizes, an inventory action at one or two properties moves the aggregate by several points. The premise is to read a roughly seven-day run of dates rather than a single day, and to cross-check against other property types in the same area.
| Timing | Lever | Decision trigger (tied to figures in this article) | Aim |
|---|---|---|---|
| T-45 | Sort every date in the target month into three bands by the market’s T-45 level (below 80% / 80–88% / 88% or above) | If dates below 80% make up more than half the month, switch to a design that holds a wider price range | Fix the menu of levers per date in advance |
| T-45 | On dates at 88% or above, review inventory held back and the pricing of higher room categories | If the market is at 88% or above (average pickup +5.5pt) and your property is filled to a similar level, check the room left on rate | Avoid leaving rate on the table on early-sell-through dates |
| T-30 | Measure the T-45 → T-30 gain and decide whether to raise or lower price | If the market is building at around +6.5pt (Mie business, 9/19) and your property is under +2pt, consider revisiting price | Consolidate price revisions to roughly twice a month |
| T-30 | Put in writing a policy of not cutting price on dates at the 97% level (Mie ryokan, 9/21) | On dates where the market has only about +2.2pt of headroom left and your property is also running high, skip the discount | Prevent rate erosion on dates with little headroom |
| Last-minute (within two weeks) | Hold price fixed in principle; operate only minimum stay, room-type release and how returned inventory goes back on sale | On dates of the type that add +10.9pt after T-30 (Mie business, 9/19), absorb demand by releasing inventory rather than by discounting | Capture last-minute demand while holding rate |
| Looking to next month | Check rate as a year-on-year comparison of finalized monthly values and feed it into next month’s base range | If your property’s month sits well below the market’s estimated settled ADR (Mie business, July 2026, roughly ¥7,100), there is room to revisit the base | Separate daily three-checkpoint occupancy management from monthly rate management |
Source: MetroEngines Research; compiled by the HotelBank Editorial Team
Summary — three yardsticks
Yardstick 1: the two lines at T-45, 80% and 88%. If estimated OCC at T-45 is below 80%, it is a “still filling” date (21-cell average +14.3pt); at 88% or above it is a date close to done (+5.5pt). Classify the character of the date with these two lines.
Yardstick 2: at T-30, level × pickup. The same +6–7pt gain means the opposite thing at 84.8% (Mie business, 9/19) and 97.0% (Mie ryokan, 9/21). Do not read pickup alone, or level alone.
Yardstick 3: inventory in the last-minute window, rate on a monthly basis. What you move in the last-minute phase is how inventory is released. Rate is not judged daily; check estimated settled ADR monthly, as a year-on-year comparison between finalized values. Not mixing the time axes is the single most important part of this framework.
About the data in this article
■ Data sources
Estimated OCC (OTA-listed-inventory basis) and the booking curves are observed values of OTA-listed inventory by stay date. The booking curves are based on observations from 45 days before the stay date through the most recent day. Estimated settled ADR is the transaction-price level (tax-excluded equivalent) inferred from OTA and other sales data (cheapest-plan level × property-type coefficient, ensembled across multiple channels). Data as of September 5, 2026 (most recent observation date September 4, 2026). Source: MetroEngines Research; compiled by the HotelBank Editorial Team.
■ Calculation assumptions
OTA-listed-inventory-based occupancy = 100 − 100 × OTA-listed remaining rooms ÷ total rooms. In this article it is presented as an aggregate for the relevant area × property type for each target stay date. Estimated settled ADR treats past months as finalized values and the current and future months as estimates based on current sales conditions. The three checkpoints are fixed at T-45, T-30 and the last-minute window (roughly within two weeks), and only checkpoints that have been reached are read (points not yet reached are not filled in by inference). Breakdown of N: Mie business hotels N=89 properties (86 observed at T-45), Mie ryokan N=191 properties (181 observed), Mie city hotels N=14 properties, Kagawa city hotels N=10 properties, Kagawa business hotels N=84 properties, Tokyo business hotels N=862 properties (849 observed), Osaka business hotels N=454 properties, Fukuoka business hotels N=311 properties. The 21-cell aggregate covers 7 prefectures — Tokyo, Osaka, Fukuoka, Mie, Kagawa, Okinawa and Nagano — × 3 property types (business hotels / city hotels / ryokan), stay date September 19, 2026, totalling 3,243 properties and 379,278 rooms. The N for estimated settled ADR is the number of properties observed in each month (shown in the tables).
■ Limitations and caveats
Estimated OCC is an estimate based on how inventory listed on OTAs is being absorbed, and is defined differently from actual room occupancy (it reads higher). Estimated settled ADR has a median error of 6.6% when reconciled against published operating results. Sales conditions and inventory change daily, so the figures in this article are a snapshot as of the retrieval date. In cells with a small base (Kagawa city hotels N=10, Mie city hotels N=14, etc.), an inventory action at one or two properties moves the aggregate by several points, so read them alongside neighbouring dates and other property types in the same area rather than judging on a single day’s value. This article deals only with aggregates by area × property type and does not represent the movement of individual properties.
Frequently asked questions
Q. Why are the booking-curve checkpoints T-45, T-30 and the last-minute window?
A. Tracking daily makes you react to 1–2pt wobbles and touch price too often, so the purpose is to fix the observation points. T-45 is used to judge the character of the date, T-30 to measure pickup and decide whether to raise or lower price, and the last-minute window (roughly within two weeks) to operate only how inventory is released rather than price. The estimated OCC used here (OTA-listed-inventory basis) is based on observations from 45 days before the stay date through the most recent day, so no earlier phase is covered.
Q. At what T-45 estimated OCC can a date be judged as “still able to fill”?
A. Across 21 cells of 7 prefectures × 3 property types (stay date September 19, 2026), the 10 cells below 80% at T-45 went on to add an average of +14.3pt, the 4 cells at 80–88% added +8.3pt, and the 7 cells at 88% or above added only +5.5pt (correlation coefficient −0.85). The rule of thumb is the two lines at 80% and 88%: below 80% is a “still filling” date where pricing levers remain, and 88% or above is a date close to done, where a cut tends to shave rate rather than buy headroom.
Q. What should be looked at at the T-30 checkpoint?
A. The gain since T-45, not the level itself. Mie business hotels on September 19 went +6.5pt from T-45 to T-30 (84.8%) and then added a further +10.9pt. Mie ryokan on September 21 gained a similar +6.9pt, but at a level of 97.0%, and moved only +2.2pt after that. The same gain means the opposite thing at a different level, so read level × pickup on two axes.
Q. Is discounting in the last-minute phase always wrong?
A. On dates where the market builds late, it tends to mean accepting demand cheaply that would have arrived anyway. Mie business hotels on September 19 added +10.9pt, from 84.8% at T-30 to 95.7% at the latest reading. Conversely, on dates that have barely moved since T-45 (Kagawa city hotels on October 10, +0.4pt), a large price move is unlikely to draw a response. What carries weight in the last-minute window is inventory control: relaxing consecutive-night or minimum-stay conditions, opening room types that had been held back, and how cancelled inventory is put back on sale.
Q. Can rate also be judged with this three-checkpoint framework?
A. What is judged is occupancy, not rate. Estimated OCC can be observed daily, but the price metric — estimated settled ADR — is canonical monthly and is not material for discussing daily or day-of-week rate. Check rate as a year-on-year comparison between finalized values for past months (Mie business hotels: roughly ¥7,100 in July 2026, N=94, +1.2% year on year). Separating the time axes — occupancy on daily checkpoints, rate on finalized monthly YoY — is the precondition for this framework.
Q. How should areas × property types with a small N (number of observed properties) be handled?
A. Kagawa city hotels are N=10 and Mie city hotels N=14; at those base sizes an inventory action at one or two properties moves the aggregate by several points. Do not decide on a single day’s value — read a roughly seven-day run of dates, and cross-check against other property types in the same area. Between cells with a large base (Tokyo business hotels N=862, 124,809 rooms) and a small one (Okinawa ryokan N=11, 128 rooms), the same “+10-something pt” carries different stability.
Related reading
- Okayama Booking Curves: 3 Checkpoints, Aug 8 Late-Surges +11.8pt
- Booking Curves Across 47 Prefectures: +4.1pt Median Pickup from T-45
- Tochigi Booking Curves by Type: Resort 81.1% at T-45, Only +2.6pt Left
- Mie August Booking Curves: Business Hotels Swing 25.5pt, Ryokan 9.7pt
- Mie Silver Week: Sep 20 Ryokan 97.5% at T-31, Sep 23 Just 66.1%