

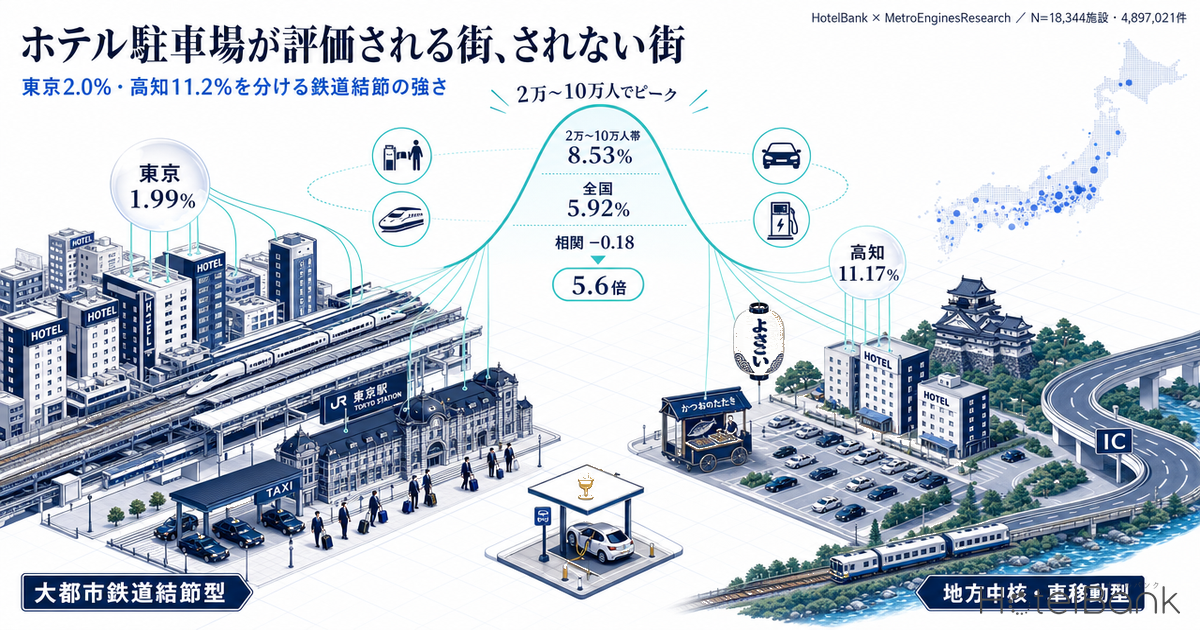
When guest reviews are classified by natural-language analysis, the degree to which “parking” is discussed as a subject of evaluation varies sharply by region. Across 4.89 million reviews of 18,344 properties nationwide, the share of reviews mentioning parking ranges from 11.2% in Kochi to 1.99% in Tokyo — a 5.6-fold gap. This article examines where that gap comes from, along three axes: the scale of the rail node, private car ownership, and city typology. It then goes one step further and quantifies whether parking, as a facility, is actually priced into room rates at all.
Metric Definitions Used in This Article
- Parking mention rate: the share of guest reviews posted in the past 24 months that contain a reference to parking or to parking a vehicle. It is an aggregate based on natural-language tagging and does not indicate the number of parking spaces a property actually holds. Likewise, the station mention rate covers references to station proximity and rail access, and the expressway interchange mention rate covers references to proximity to an expressway interchange.
The mention rate combines positive, negative and neutral references — it is a “share of reviews in which the topic came up,” not a satisfaction score itself. A breakdown of 3,255 reviews across the 23 properties with the highest mention volumes shows 65.7% positive, 24.9% negative and 9.3% neutral: roughly one in four mentions is a complaint about a full lot, paid parking or tight spaces (HotelBank Editorial Team analysis, past 24 months). - ADR (average daily rate): an estimated settled rate (tax-excluded equivalent) calculated by applying a segment-specific adjustment factor to the lowest published plan level each property lists on OTAs and other channels (double occupancy, per-room rate, tax included). Cross-checked against property-level actuals disclosed by listed hotel REITs (91 properties, past three months), the median error is roughly 7%. These are estimates and differ from each property’s actual transacted prices and accounting figures.
- Coverage: 24,075 properties with at least 150 reviews were extracted; of the 20,701 with confirmed reviews in the past 24 months, 2,357 whose values could not be fixed because they fell outside the top-50 tag set were excluded, leaving 18,344 properties and 4,897,021 reviews.
- Data sources: review analysis by the HotelBank Editorial Team; pricing data from MetroEngines Research.
- — Parking is mentioned in 5.92% of reviews nationwide. But the average is meaningless: the distribution spans a 5.6-fold range, from 11.17% in Kochi to 1.99% in Tokyo.
- — The relationship with rail node scale is not linear (Pearson +0.17). It forms an inverted-U distribution that peaks at 8.53% in the regional-hub band of 20,000–100,000 daily boardings and alightings.
- — Correlation with private car ownership is +0.50 nationwide, but converges to −0.13 across the 38 prefectures outside the nine major metropolitan ones. What matters is not residents’ car ownership but the transport mode guests choose.
- — No price premium is observable for parking. Within-city relative ADR stays between 0.90 and 1.05 across every mention-rate band, and the correlation is a slightly negative −0.18. Parking should be treated as a precondition, not a differentiator.
- — The main arena for investment decisions is the 83 cities and 4,817 properties in the regional-hub, car-travel type. Payback has to be explained by incremental occupancy rather than by raising ADR: at a total spend on the order of ¥10 million, +1.0pt implies roughly four years.
Parking is discussed in 5.92% of reviews nationwide — a 5.6-fold spread between prefectures
Start with the national picture. Of the 4,897,021 reviews submitted to 18,344 properties, 5.92% mentioned parking — roughly six in every 100 reviews. But that average carries no information. Broken down by prefecture, the distribution runs from 11.17% at the top (Kochi) to 1.99% at the bottom (Tokyo), a 5.6-fold spread.
The top of the table is Kochi (11.17%), Miyazaki (10.07%), Yamaguchi (8.84%), Tottori (8.77%), Aomori (8.65%), Tokushima (8.63%) and Ehime (8.62%). Notably, three of Shikoku’s four prefectures sit in the top ten. At the bottom are the metropolitan prefectures — Tokyo (1.99%), Kyoto (3.09%), Osaka (3.53%) and Kanagawa (4.14%) — but also tourism-oriented prefectures such as Wakayama (4.37%) and Yamanashi (4.65%). Already it is clear that a simple “rural means high” explanation does not hold.
Source: HotelBank Editorial Team analysis (N=18,344 properties, 4,897,021 reviews, past 24 months)
“The thinner the rail, the more parking is discussed” is only half right
Next, the relationship with the scale of the rail node. Using station-level boarding and alighting data from the MLIT Real Estate Information Library, we summed daily boardings and alightings for all stations within a 3km radius of the accommodation cluster’s centre, for the 182 municipalities with at least 25 properties. We define that figure as “rail node strength” and examine how it relates to the parking mention rate.
The result is clear, but not what the initial hypothesis predicted. The correlation coefficient is +0.17 (Pearson) and +0.11 (Spearman) — essentially no linear relationship. Restricting the calculation to cities that do have rail service gives −0.13, and again no relationship is evident. The monotonic hypothesis that “thinner rail means more parking talk” does not hold, at least not in linear form.
Take medians by boarding-volume band, however, and a distinct inverted-U appears. Cities with no rail station within a 3km radius sit at 3.72%, and those under 5,000 daily boardings at a similarly low 3.95%. From there the rate jumps to 7.40% in the 5,000–20,000 band and peaks at 8.53% in the 20,000–100,000 band. It falls back to 5.61% at 100,000–500,000 and drops to 2.80% at the largest nodes of 500,000 or more. Parking becomes an evaluation axis neither in cities with no rail at all nor in cities where rail is overwhelmingly dominant, but in the band in between — the scale of a regional hub city.
Source: MLIT Real Estate Information Library (station-level boardings and alightings); HotelBank Editorial Team analysis (182 municipalities, median of each band)
The two ends are low for different reasons. In major cities, most guests arrive by rail, so parking never even enters the conversation. In island and mountain resorts without a rail station, arrival by private car, rental car, air or ferry is simply the default, so the presence of parking is not a talking point either. Indeed, the station mention rate in the no-rail group is 1.04% — rail does not exist as an evaluation axis there either. Parking gets discussed only in cities where guests could arrive either by rail or by car — that is, cities where guests are actively choosing their mode of transport.
The link to car ownership also disappears once metropolitan areas are excluded
One more demand-side condition. We matched the data against prefecture-level private passenger car penetration published by the Automobile Inspection and Registration Information Association (as of end-March 2025, vehicles per household including kei cars).
Across all 47 prefectures the correlation coefficient is +0.50 and the rank correlation +0.34 — a moderate positive relationship. It is driven largely by the fact that Tokyo, with the lowest ownership (0.405 vehicles), also has the lowest parking mention rate. But calculated across only the 38 prefectures outside Tokyo, Osaka, Kanagawa, Kyoto, Aichi, Hyogo, Chiba, Saitama and Fukuoka, the correlation falls to −0.13 — effectively no correlation.
The scatter plot shows why. Prefectures at the top of the ownership table — Fukui (1.670), Yamagata (1.617) and Toyama (1.616) — sit only mid-table on parking mentions, at 6.3–7.8%. Conversely Kochi (1.129), Miyazaki (1.271) and Ehime (1.129) hold roughly average ownership yet rank at the very top on mentions, at 8.6–11.2%. In other words, what this metric captures is not “do residents own cars” but “do the people staying in this city arrive by car” — and the two do not coincide. Prefectures such as Nagano (1.532 vehicles, 4.97%) and Yamanashi (1.494 vehicles, 4.65%) show high ownership yet resort-type lodging demand in which parking never becomes an evaluation axis.
Source: Automobile Inspection and Registration Information Association, “Prefectural penetration of private passenger cars (as of end-March 2025)”; HotelBank Editorial Team analysis
Municipal map — where parking becomes an evaluation axis
Prefectural averages let cities and resort areas within a prefecture cancel each other out. So we drop the granularity to the 182 municipalities with at least 25 properties and plot them on a map. Circle size indicates the parking mention rate; colour indicates the three typologies described below.
Source: HotelBank Editorial Team analysis; MLIT Real Estate Information Library (station-level boardings and alightings)
At the top are Okinawa City (16.42%), Kitami (15.61%), Toyota (13.91%), Yokkaichi (13.33%), Asahikawa (13.26%), Kochi City (13.19%), Obihiro (12.37%), Tsu (12.19%), Hachinohe (11.97%), Fuji (11.75%), Mito (11.44%) and Tokushima City (11.36%) — prefectural capitals and industrial cities of comparable standing. At the bottom are central Tokyo wards such as Taito (0.59%), Chuo (0.72%) and Shinjuku (0.87%), alongside island and peninsula municipalities such as Yakushima (0.48%), Taketomi (0.29%) and Minamichita (0.51%).
Three drive-corridor typologies — layering in expressway interchange mentions
We now organise the analysis so far into three typologies, adding references to expressway interchange proximity. Classification is based on daily boardings and alightings at stations within a 3km radius of the accommodation cluster centre: 300,000 or more is the metropolitan rail-node type, under 2,000 is the non-rail, wide-area travel type, and everything in between is the regional-hub, car-travel type.
| Typology | Cities | Properties | Parking mentions | Station mentions | Expressway IC mentions |
|---|---|---|---|---|---|
| Regional hub, car travel | 83 | 4,817 | 8.0% | 18.4% | 0.60% |
| Metropolitan rail node | 25 | 2,953 | 3.0% | 24.8% | 0.11% |
| Non-rail, wide-area travel | 74 | 3,883 | 3.7% | 2.7% | 0.15% |
Source: HotelBank Editorial Team analysis (182 municipalities, 11,653 properties); MLIT Real Estate Information Library (station-level boardings and alightings). Parking and station figures are medians; expressway interchange figures are means.
The regional-hub, car-travel type (83 cities, 4,817 properties) records a 7.95% parking mention rate and an 18.36% station mention rate — both high at the same time. Guests here can choose between rail and car, which makes the presence, price and capacity of parking a point of comparison. Essentially all of the nation’s parking demand is concentrated in this typology.
The metropolitan rail-node type (25 cities, 2,953 properties) shows 3.01% for parking against 24.80% for stations. The evaluation axis has shifted entirely to rail, and the expressway interchange mention rate averages 0.11% — close to zero.
The non-rail, wide-area travel type (74 cities, 3,883 properties) shows 3.72% for parking and 2.74% for stations: transport access itself has dropped out of the evaluation frame. These are mainly hot-spring towns, islands and highland resorts, where guest attention turns to food, baths and views.
There is, however, a third axis: cities where the expressway corridor clearly matters. The highest expressway interchange mention rates are Gotemba at 6.58%, Numazu at 4.98%, Suwa at 4.54% and Nagahama at 4.28% — all pass-through lodging destinations hosting major interchanges on the Tomei, Chuo and Hokuriku expressways. Given that the national average is in the 0.4% range, “right off the expressway” functions in these cities as an independent selling point.
| City | Expressway IC mentions | Parking mentions | Daily station boardings | Properties |
|---|---|---|---|---|
| Gotemba, Shizuoka | 6.58% | 9.7% | 9,241 | 28 |
| Numazu, Shizuoka | 4.98% | 9.9% | 37,007 | 47 |
| Suwa, Nagano | 4.54% | 7.2% | 7,658 | 26 |
| Nagahama, Shiga | 4.28% | 6.3% | 7,780 | 25 |
| Fuji, Shizuoka | 3.01% | 11.8% | 26,663 | 26 |
| Kofu, Yamanashi | 2.55% | 8.4% | 33,716 | 38 |
| Hamamatsu, Shizuoka | 2.36% | 9.6% | 91,544 | 59 |
| Fukushima, Fukushima | 2.29% | 9.0% | 35,098 | 68 |
Source: HotelBank Editorial Team analysis; MLIT Real Estate Information Library (station-level boardings and alightings)
Does parking get priced in? ADR, room count and review score by mention band
This is the part that bears directly on investment decisions. Do properties whose parking is highly rated actually command correspondingly higher rates? For 1,384 business hotels across the 70 cities in the regional-hub, car-travel type, we compared estimated settled ADR, room count and review score by parking mention band. To neutralise differences in price level between cities, we also show “within-city relative ADR” — each property’s ADR divided by the median for its city.
| Parking mention rate | Properties | Within-city relative ADR | Median estimated settled ADR | Median rooms | Review score |
|---|---|---|---|---|---|
| Under 3% | 189 | 0.90 | ¥6,700 | 39 | 3.81 |
| 3% to under 7% | 276 | 1.05 | ¥7,900 | 121 | 3.92 |
| 7% to under 12% | 473 | 1.05 | ¥7,700 | 120 | 3.84 |
| 12% or more | 446 | 0.95 | ¥6,800 | 101 | 3.78 |
Source: compiled from MetroEngines Research and HotelBank Editorial Team analysis (N=1,384 properties; monthly medians, September 2025 to August 2026)
Source: compiled from MetroEngines Research and HotelBank Editorial Team analysis (N=1,384 properties)
The conclusion first: no price premium is observable between parking being discussed and ADR. Within-city relative ADR is 0.90 in the under-3% band, 1.05 at 3% to under 7%, 1.05 at 7% to under 12%, and 0.95 at 12% or more. The correlation across the whole set is −0.18 — if anything, slightly negative. Review scores likewise fall within a narrow 3.78–3.92 range, differing from the within-city median by at most 0.075 points.
This result indicates that parking should be positioned as a “precondition for price competitiveness” rather than a “differentiator that lifts price.” The content of the mentions points the same way: comments such as “I was grateful that parking was free,” “free parking for over 100 cars, and you can come and go freely,” and “the dedicated car park is right next to the hotel” centre on the absence of friction. Removing friction helps a property get chosen, but it does not translate into a structure where that itself can be charged for.
The under-3% band is the one clear exception, at a relative ADR of 0.90 and a median of 39 rooms. That band contains many small properties with no parking at all, so what is showing through is a difference in property scale rather than the presence or absence of parking. Put the other way round: for a 100-room-class property in a regional hub city, parking is effectively mandatory equipment, and there is little room for debate. The investment question shifts from “have it or not” to “how many spaces, at what cost.” As a starting point for the minimum number of spaces, the floor is set by parking provision requirements written into municipal ordinances, which vary by a factor of 2.5 between cities.
Properties with the most parking mentions nationwide
Below are the leading properties by absolute number of mentions. Because counts scale with a property’s total review volume, larger properties are favoured. Note also that the mention counts here combine positive, negative and neutral references and are not a satisfaction ranking. Even so, the sheer fact that this many guests are discussing parking shows that, in these locations, parking is part of the conversation about the stay.
| # | Property | Location | Rooms | Mentions | Mention rate | Reviews |
|---|---|---|---|---|---|---|
| 1 | Hotel Amanek Asahikawa Ekimae (ホテルアマネク旭川駅前) | Hokkaido | 221 | 385 | 14.9% | 2,584 |
| 2 | JR Inn Asahikawa (JRイン旭川) | Hokkaido | 198 | 379 | 15.7% | 2,417 |
| 3 | APA Hotel & Resort Yokohama Bay Tower (アパホテル&リゾート〈横浜ベイタワー〉) | Kanagawa | 2311 | 357 | 3.8% | 9,466 |
| 4 | APA Hotel & Resort Sapporo (アパホテル&リゾート〈札幌〉) | Hokkaido | 903 | 351 | 14.9% | 2,354 |
| 5 | APA Hotel & Resort Niigata Ekimae Odori (アパホテル&リゾート〈新潟駅前大通〉) | Niigata | 1001 | 330 | 8.2% | 3,998 |
| 6 | Kamenoi Hotel Beppu (亀の井ホテル 別府) | Oita | 322 | 326 | 12.5% | 2,614 |
| 7 | Rihga Royal Hotel Kyoto (リーガロイヤルホテル京都) | Kyoto | 489 | 321 | 9.4% | 3,410 |
| 8 | Hotel Trifito Otaru Canal (ホテル・トリフィート小樽運河) | Hokkaido | 128 | 320 | 17.7% | 1,808 |
| 9 | Hotel Fukuracia Osaka Bay (ホテルフクラシア大阪ベイ) | Osaka | 320 | 312 | 9.1% | 3,412 |
| 10 | The Celecton Takamatsu (ザ・セレクトン高松) | Kagawa | 336 | 294 | 27.0% | 1,088 |
| 11 | La Vista Furano Hills (ラビスタ富良野ヒルズ) | Hokkaido | 180 | 285 | 14.2% | 2,002 |
| 12 | Grids Premium Hotel Otaru (グリッズプレミアムホテル小樽) | Hokkaido | 142 | 282 | 14.9% | 1,886 |
| 13 | Resorpia Atami (リゾーピア熱海) | Shizuoka | 196 | 272 | 13.1% | 2,070 |
| 14 | Ark Hotel Kumamotojo Mae (アークホテル熊本城前) | Kumamoto | 222 | 270 | 14.4% | 1,876 |
| 15 | Pacific Hotel Okinawa (パシフィックホテル沖縄) | Okinawa | 389 | 270 | 30.7% | 879 |
| 16 | Toyoko Inn Fuji Kawaguchiko Ohashi (東横INN富士河口湖大橋) | Yamanashi | 381 | 269 | 8.1% | 3,311 |
| 17 | Vessel Hotel Fukuoka Kaizuka (ベッセルホテル福岡貝塚) | Fukuoka | 124 | 265 | 30.4% | 873 |
| 18 | Yonago Universal Hotel (米子ユニバーサルホテル) | Tottori | 410 | 263 | 12.9% | 2,043 |
| 19 | Hotel Hawkleaf (ホテルホークレア) | Okinawa | 28 | 253 | 36.1% | 700 |
| 20 | Hotel Keihan Universal Tower (ホテル京阪 ユニバーサル・タワー) | Osaka | 641 | 247 | 4.5% | 5,460 |
Source: HotelBank Editorial Team analysis (past 24 months, properties with 150+ reviews)
Two Asahikawa properties take the top two places, and Hokkaido accounts for six of the top 20 including Sapporo, Otaru and Furano. In Hokkaido, where wide-area travel is the premise, parking is evidently a practical condition of choosing where to stay. Among large properties, APA Hotel & Resort Yokohama Bay Tower (2,311 rooms) records 357 mentions and APA Hotel & Resort Niigata Ekimae Odori (1,001 rooms) 330 — capacity that only large buildings can offer, translating into recognition. The Celecton Takamatsu (336 rooms) combines scale with a 27.02% mention rate, with its 100-plus-space free car park operating as a clear selling point.
Next, the same properties ranked by the “density” of mentions. Here we restrict the field to properties with at least 80 parking mentions and rank by mention rate.
| # | Property | Location | Rooms | Mention rate | Mentions |
|---|---|---|---|---|---|
| 1 | Iris Aichi (アイリス愛知) | Aichi | 72 | 47.5% | 180 |
| 2 | Kochi Kyosai Kaikan COMMUNITY SQUARE (高知共済会館 COMMUNITY SQUARE) | Kochi | 46 | 42.2% | 106 |
| 3 | Hotel Shirahagi (ホテル白萩) | Miyagi | 28 | 38.2% | 94 |
| 4 | HOTEL1-2-3 Kurashiki (HOTEL1-2-3 倉敷) | Okayama | 140 | 36.2% | 216 |
| 5 | Hotel Hawkleaf (ホテルホークレア) | Okinawa | 28 | 36.1% | 253 |
| 6 | Takayama City Hotel Four Seasons (高山シティホテル フォーシーズン) | Gifu | 46 | 36.0% | 161 |
| 7 | Fukuyama Plaza Hotel (福山プラザホテル) | Hiroshima | 124 | 35.8% | 81 |
| 8 | Okayama City Hotel Koseicho (岡山シティホテル厚生町) | Okayama | 320 | 34.9% | 158 |
| 9 | Bright Park Hotel (ブライトパークホテル) | Kochi | 105 | 33.4% | 191 |
| 10 | UCHI Living Stay Suitengu | Hokkaido | 17 | 33.3% | 93 |
| 11 | Tsubame-Sanjo Washington Hotel (燕三条ワシントンホテル) | Niigata | 103 | 33.0% | 121 |
| 12 | Hotel Econo Higashi Kanazawa (ホテルエコノ東金沢) | Ishikawa | 104 | 32.2% | 97 |
Source: HotelBank Editorial Team analysis (80+ mentions, past 24 months)
Iris Aichi (72 rooms) has parking mentioned in 47.49% of its reviews, making it the property where parking is discussed most in the country. Kochi Kyosai Kaikan COMMUNITY SQUARE (46 rooms, 42.23%) and Hotel Shirahagi (28 rooms, 38.21%) follow, and small-to-mid properties of around 50 rooms are conspicuous near the top. They illustrate that even in a location that cannot compete on scale, a property can establish its parking environment as an unambiguous strength.
Inputs for the capex decision — adding spaces and where EV charging fits
Taking all of the above together, capital spending around parking can be organised as follows.
First, selecting the target area. Parking investment has a plausible payback in what this article calls the regional-hub, car-travel band of 83 cities. Properties in that band show a median parking mention rate of 7.95% — 2.6 times the metropolitan rail-node type. Conversely, for station-front locations in metropolitan areas, the same money is more likely to earn recognition if directed at guest rooms or common areas.
Second, framing the payback scenario. As the ADR analysis shows, parking does not get priced in. Payback therefore has to be explained through “probability of being chosen” and “a lift in occupancy” rather than through a rate increase. The realistic approach is to model incremental occupied room nights among the demand segments for whom parking is a booking condition — business travel by car, family wide-area touring, and inbound guests using rental cars. For a sense of the capital expenditure levels at existing properties, our analysis of IR disclosures from five listed hotel REITs — a major-renovation benchmark of ¥134,000 to ¥624,000 per room per year — is a useful reference.
| Investment | +0.5pt | +1.0pt | +2.0pt | +3.0pt |
|---|---|---|---|---|
| ¥10 million | 8.5 yrs | 4.2 yrs | 2.1 yrs | 1.4 yrs |
| ¥20 million | 16.9 yrs | 8.5 yrs | 4.2 yrs | 2.8 yrs |
| ¥30 million | 25.4 yrs | 12.7 yrs | 6.4 yrs | 4.2 yrs |
| ¥50 million | 42.4 yrs | 21.2 yrs | 10.6 yrs | 7.1 yrs |
Source: HotelBank Editorial Team estimate. Simple payback (investment ÷ incremental gross profit) using the median of the 7–12% mention band in the regional-hub, car-travel type (120 rooms, estimated settled ADR ¥7,700, N=1,384 properties). A 70% gross margin on incremental revenue is assumed; interest, tax, depreciation and land acquisition costs are excluded.
The reading is straightforward. Surface-level work in the order of a hundred-odd thousand yen per room (¥10 million in total) reaches payback in about 4.2 years on a +1.0pt annual occupancy improvement, or about 2.1 years at +2.0pt. Investment above ¥30 million involving multi-storey construction or land acquisition, by contrast, takes 12.7 years at around +1.0pt — outside the normal equipment renewal cycle. When considering parking investment, the first step is to check booking data for what share of your own demand treats parking as a booking condition, then work out which column of the table above the lost business in that segment corresponds to.
Third, how to treat EV charging equipment. METI’s subsidy programme for the installation of charging and refuelling equipment to promote clean-energy vehicles was revised in the FY2025 supplementary budget, adding a new high-output category of 150kW and above and removing the cap on the number of charging points in multi-unit residential buildings, among other changes. Accommodation facilities may qualify under the commercial-facility category; separately, some local governments — Aichi Prefecture, for example — include accommodation facilities on their own terms and subsidise one quarter of the purchase cost (capped at ¥1.25 million for rapid chargers and ¥175,000 for standard chargers and similar). At present, however, review data does not show enough mention volume to isolate EV charging as an independent evaluation axis. On where charging equipment is actually concentrated geographically, we mapped the distribution in Regional Inns by Car: Where Parking and EV Charging Really Are. Because this is best understood as forward-looking investment in equipment, the practical approach is to judge it by overlaying subsidy eligibility with the regional typologies above.
Fourth, considering alternatives. Reviews of the leading properties repeatedly describe capacity secured through arrangements with nearby facilities: “you can just use the AEON car park,” “there’s a partner car park about 15 minutes away by car.” Beyond acquiring and developing land yourself, operational moves such as securing partner allocations and improving signage and traffic flow also build recognition. As one comment — “the parking attendant explained everything to me carefully” — shows, the operation of getting vehicles in and out is judged as much as the number of spaces, and that should not be overlooked.
Conclusion
Whether parking functions as an evaluation axis for a lodging property is determined almost entirely by the transport conditions of its location. The national average of 5.92% is no more than the mean of a 5.6-fold range running from 11.17% in Kochi to 1.99% in Tokyo.
The relationship with rail node scale does not hold as a linear correlation (Pearson +0.17). Viewed by band, however, a clear inverted-U emerges: a peak of 8.53% in the regional-hub band of 20,000–100,000 daily boardings and alightings, falling away both at the largest nodes (2.80%) and in rail-free areas (3.72%). The relationship with private car ownership likewise converges to no correlation (−0.13) across the 38 prefectures outside the metropolitan areas. What decides the outcome is not residents’ car ownership but whether a city’s guests can choose their mode of transport.
And parking does not get priced in. Within-city relative ADR stays within a 0.90–1.05 range across every mention band, and the correlation is a marginally negative −0.18. Capital spending decisions should be built around the typology of the target area and the contribution to occupancy, not used as grounds for raising ADR. The 83-city band of regional hubs and its 4,817 properties is where that argument is decided.
Related Reading
- Parking-Review Ranking Across Car-Dependent Japan + EV Charging Edge
- Regional Inns by Car: Where Parking and EV Charging Really Are
- Rental-Car Inbound: Parking Mentioned 2.9x More in Traditional Chinese
- Japan’s 50 Smart Interchanges: Median 1,130 Hotel Rooms Within 10km
- Hotel Capex: ¥134k–¥624k per Room a Year — 5 REITs’ IR Disclosures
- Nishi-Mikawa ADR ¥6,800: Okazaki’s 100-Room Site Needs ¥11,906
- 12,890 Wheelchair-Accessible Rooms: Japan’s 1% Hotel Rule
- Aichi Business Hotels: Sat 90.5% vs Sun 80.4%, a 10.1pt DOW Gap
- Tachikawa, Hachioji & Machida: 94% Occupancy, 66-79% of Tokyo ADR
References and Sources
■ Data sources
Facility and location tags derived from natural-language analysis of guest reviews (population: 24,075 properties with 150+ reviews; of the 20,701 with confirmed reviews in the past 24 months, 2,357 falling outside the top-50 tag set were excluded, leaving 18,344 properties and 4,897,021 reviews); property master data (room count, grade, coordinates, review score); monthly medians of estimated settled ADR (1,384 properties, September 2025 to August 2026); and daily station-level boardings and alightings from the MLIT Real Estate Information Library (182 municipalities, summed within a 3km radius).
■ Estimation assumptions
City typologies are based on daily boardings and alightings at stations within a 3km radius of the accommodation cluster centre: 300,000 or more is the metropolitan rail-node type, under 2,000 the non-rail wide-area travel type, and everything in between the regional-hub car-travel type. Within-city relative ADR is each property’s estimated settled ADR divided by the median for its city. The payback estimate is a simple payback (investment ÷ incremental gross profit) assuming 120 rooms, an estimated settled ADR of ¥7,700 and a 70% gross margin on incremental revenue; interest, tax, depreciation and land acquisition costs are excluded.
■ Limitations and caveats
The mention rate combines positive, negative and neutral references — a “share of reviews in which the topic came up” — and is not a measure of satisfaction or of the number of parking spaces held. Across the 23 properties with the highest mention volumes (3,255 mentions), the split is 65.7% positive, 24.9% negative and 9.3% neutral, so the ranking of leading properties does not coincide with a ranking by satisfaction. ADR is an estimate produced by applying segment-specific adjustments to published plan levels; the median error against property-level disclosures by listed hotel REITs (91 properties, past three months) is roughly 7%. Correlations are based on city-level aggregates and do not indicate causal relationships at individual properties. For EV charging, mention volume is insufficient to isolate it as an independent evaluation axis, and it falls outside the typology analysis in this article.
■ Review and pricing data
- HotelBank Editorial Team analysis — natural-language analysis of guest reviews (N=18,344 properties, 4,897,021 reviews, past 24 months)
- MetroEngines Research — estimated settled ADR (N=1,384 properties, September 2025 to August 2026)
■ Government statistics and public data
- MLIT Real Estate Information Library — station-level boardings and alightings
- Automobile Inspection and Registration Information Association, “Prefectural penetration of private passenger cars (including kei cars), as of end-March 2025”
- Automobile Inspection and Registration Information Association, “Private passenger cars per household”
- Japan Tourism Agency, “Overnight Travel Statistics Survey”
■ Subsidies and programmes