

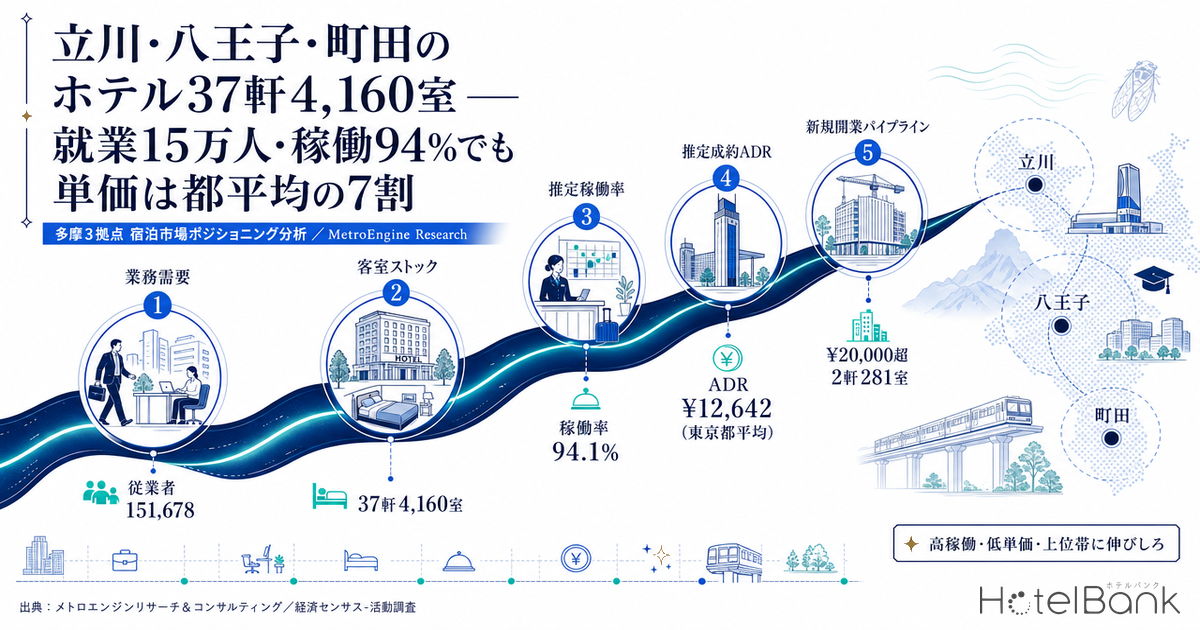
Hotel investment analysis in Tokyo almost invariably ends at the 23 special wards. Yet within a 1 km radius of the three core stations of the Tama region — Tachikawa, Hachioji and Machida — sit 10,869 business establishments employing 151,678 workers. That is far larger than the Chiba Station catchment (66,439 workers) or the Funabashi Station catchment (38,350), and larger even than Omiya Station (95,408). This article covers a geography that does not overlap with our earlier pieces — Tokyo 23 Wards Supply Pressure 2026, Tokyo Bay 2040: dual-growth zones for hotel investment and Dual-growth hotel site screening across 18 nodes nationwide — treating Tokyo outside the 23 wards, the Tama region, on its own terms. We quantify this “unused sub-region of Tokyo” through three lenses: existing room stock, business demand, and the timeline of new rail investment.
Metric Definitions Used in This Article
- ADR (average daily rate) = an estimated settled rate (tax-exclusive equivalent), derived by applying a segment-specific adjustment factor to each property’s lowest publicly listed plan rate on OTAs (double occupancy, per room, tax-inclusive). Cross-checked against property-level results disclosed by listed hotel REITs (91 properties, most recent three months), the median error is approximately 7%. These are estimates and differ from each property’s actual transacted rates or accounting figures. Area-level ADR is the median of the properties covered (the level of a typical property in that area).
- OCC (occupancy) = rooms sold as a share of total rooms in the area (an estimate based on OTA-listed inventory). It reflects how listed inventory is absorbed on OTAs and differs from a property’s true operating occupancy.
- Rooms per 1,000 workers = rooms in the catchment ÷ workers in the same catchment × 1,000. Because the figure is sensitive to how the catchment radius is drawn, this article reports both a 1 km and a 2 km radius.
- Room stock = counted only for properties in five segments — ryokan, resort hotels, business hotels, city hotels and deluxe hotels — for which continued OTA listing has recently been confirmed (adults-only, capsule, guesthouse and similar categories are reported separately).
- Data sources: MetroEngines Research & Consulting / Economic Census for Business Activity (Ministry of Internal Affairs and Communications & METI) / Real Estate Information Library, Ministry of Land, Infrastructure, Transport and Tourism
- — Against 151,678 workers there are 37 properties with 4,160 rooms: 27.4 rooms per 1,000 workers (16.2 for Tachikawa and 16.4 for Machida on a 2 km radius), placing them in the bottom group among 11 Greater Tokyo hubs.
- — Estimated occupancy of 89.8–94.1% (August 2026) matches or beats the Tokyo-wide average of 91.1%. Estimated settled ADR, however, sits at only 66–79% of the Tokyo average.
- — Above ¥20,000 there are 2 properties with 281 rooms; above ¥25,000, one property with 81 rooms. Hachioji and Machida have not a single property above ¥12,500 — the mid-price band is a structural void.
- — After a three-year gap in openings, 325 rooms arrive between October 2026 and March 2027. Of those, 211 rooms come with one of the Tama region’s largest banquet facilities — the first entry into the scale × upper-price void.
- — Our recommendation is a 94-room midscale at an ADR of ¥15,000: a 6.3% GOP yield after construction inflation, holding 5.4% even in a combined case of ADR 10% below plan and occupancy 5 points lower.
Conclusion — 150,000 workers, 94% occupancy, and only 81 rooms in the upper price band
Start with the conclusion. The lodging market across these three Tama hubs is defined by three things: high occupancy, low rates, and room to grow in the upper band. For 1–22 August 2026, estimated occupancy on an OTA-listed-inventory basis was 93.8% in Tachikawa, 94.1% in Hachioji and 89.8% in Machida — with Tachikawa and Hachioji both above the Tokyo-wide figure of 91.1%. Even so, estimated settled ADR as of July 2026 was ¥9,900 in Tachikawa and ¥8,300 in both Hachioji and Machida: just 66–79% of the Tokyo average of ¥12,600.
The explanation lies in the price-band structure. Of the 37 hotels and ryokan (4,160 rooms) with confirmed active listings within 1 km of the three stations, only 2 properties with 281 rooms (6.8% of rooms) post a trailing-12-month average estimated settled ADR above ¥20,000, and only 1 property with 81 rooms (1.9%) clears ¥25,000. In a catchment holding 150,000 workers, the rooms serving the upper price band amount to a single building.
That structure is about to shift. A 114-room opening at the south exit of Hachioji Station in October 2026 and a 211-room opening at the north exit of Tachikawa Station in March 2027 have both been announced, and in November 2025 the Tama Toshi Monorail secured urban planning project approval for the 7,055 m, seven-station Kamikitadai–Hakonegasaki extension. What follows builds up the measured figures in order: employment, supply, rates, sites and pipeline.
Business demand — 10,869 establishments and 151,678 workers within 1 km of the three stations
Begin on the demand side. Using the Economic Census for Business Activity (Ministry of Internal Affairs and Communications & METI), with boundaries from the 2020 Population Census small-area geography, we aggregated establishment counts, worker counts and the office-sector share of workers within a 1 km radius of each station.
| Station (1 km radius) | Establishments | Workers | Office-sector workers | Office-sector share | Small areas counted |
|---|---|---|---|---|---|
| Tachikawa Station | 3,949 | 62,987 | 14,739 | 23.4% | 11 |
| Hachioji Station | 3,583 | 48,276 | 7,374 | 15.3% | 23 |
| Machida Station | 3,337 | 40,415 | 8,096 | 20.0% | 18 |
| Three-station total | 10,869 | 151,678 | 30,209 | — | 52 |
All three stations sit in the 40,000–60,000 worker range within 1 km. Individually none rivals a central Tokyo terminal, but together the three hubs total 151,678. Measured against other suburban business hubs in Greater Tokyo, that is a larger concentration than the Omiya Station catchment (95,408) or the Kawasaki Station catchment (92,239) — and it sits inside Tokyo Metropolis, without crossing a prefectural boundary.
The three differ in character. Tachikawa has the highest office-sector share at 23.4%, making it the most naturally suited to corporate demand. Hachioji, at 15.3%, leans more toward manufacturing, wholesale and retail, and education: according to the city’s official site, 21 universities, junior colleges and technical colleges within the city host roughly 90,000 students (the Consortium of Universities in Hachioji has 25 member institutions and about 100,000 students). That brings seasonal demand — entrance exams, open campus days, academic conferences, training camps — quite unlike office-worker demand. Machida, at 20.0%, is weighted toward retail and services and, as a junction of the Yokohama and Odakyu lines, draws inflow from northern Kanagawa. These differences in demand mix show up directly in the ADR gaps discussed below.
Room stock — 37 properties, 4,160 rooms, 27.4 rooms per 1,000 workers
On the supply side, we extracted every property located within 1 km of each station, then counted only those whose OTA listings were confirmed still active as of the most recent observation. To measure demand for lodging proper, the count is limited to five segments — ryokan, resort hotels, business hotels, city hotels and deluxe hotels (on an all-accommodation basis including adults-only, capsule and guesthouse properties, the figure is 44 properties and 4,339 rooms).
| Station (1 km radius) | Hotels & ryokan | Rooms | Average per property | Workers | Rooms per 1,000 workers |
|---|---|---|---|---|---|
| Tachikawa Station | 17 | 1,565 | 92 | 62,987 | 24.8 |
| Hachioji Station | 12 | 1,612 | 134 | 48,276 | 33.4 |
| Machida Station | 8 | 983 | 123 | 40,415 | 24.3 |
| Three-station total | 37 | 4,160 | 112 | 151,678 | 27.4 |
One point deserves emphasis: the number of properties registered in a property master does not match the rooms actually on sale. Within 1 km of Tachikawa Station, a 238-room city hotel stopped selling after December 2023. That single property accounted for roughly 13% of the hotel room stock in that catchment at the time. Anyone discussing Tama’s room inventory from registration-based counts will misread the real market by several years.
Machida’s catchment is the thinnest at 8 properties: 983 rooms within 1 km against 40,415 workers, putting it alongside Tachikawa at the low end of the three. Hachioji has the largest average property size at 134 rooms, with four buildings in the 200-room class (including the 200-room Keio Plaza Hotel Hachioji).
Normalized against 11 Greater Tokyo hubs — Tachikawa and Machida sit in the bottom group
To test the intuition that “Tama is short of rooms,” catchments of different sizes have to be put on the same yardstick. Here we compute rooms per 1,000 workers for 11 major Greater Tokyo terminals using an identical procedure: workers within a 2 km radius, and rooms in the same catchment across the five hotel and ryokan segments with confirmed active listings.
On a 2 km radius, Tachikawa at 16.2 rooms and Machida at 16.4 rank second-lowest of the 11 hubs, behind only Funabashi (10.3). That is less than half the top group — Ikebukuro 34.4, Shinjuku 33.6, Kawasaki 30.7 — and roughly 30% below Omiya (23.6) and Yokohama (24.1). Hachioji alone, at 22.8, approaches Omiya and Yokohama, a result of its concentration of 200-room properties.
Narrowing to 1 km reverses the order (Machida 24.3, Tachikawa 24.8, Hachioji 33.4), because the figures move depending on whether rooms cluster right at the station or spread across a wider catchment. What holds at both radii is that Tachikawa and Machida consistently sit in the bottom group among major Greater Tokyo hubs. Hachioji is around average close to the station, but widen to 2 km and rooms have not kept pace with the growth in business concentration.
| Hub | Workers, 2 km | Rooms, 2 km | Per 1,000 workers, 2 km | Per 1,000 workers, 1 km |
|---|---|---|---|---|
| Funabashi | 64,118 | 660 | 10.3 | 15.3 |
| Tachikawa | 96,324 | 1,565 | 16.2 | 24.8 |
| Machida | 67,397 | 1,103 | 16.4 | 24.3 |
| Hachioji | 70,561 | 1,612 | 22.8 | 33.4 |
| Omiya | 152,039 | 3,586 | 23.6 | 27.5 |
| Yokohama | 303,887 | 7,309 | 24.1 | 19.4 |
| Chiba | 126,928 | 3,474 | 27.4 | 38.2 |
| Shinagawa | 476,728 | 13,334 | 28.0 | 52.5 |
| Kawasaki | 129,590 | 3,981 | 30.7 | 43.2 |
| Shinjuku | 598,783 | 20,111 | 33.6 | 46.1 |
| Ikebukuro | 273,953 | 9,413 | 34.4 | 41.0 |
Rates and occupancy — occupancy above the Tokyo average, rates at 66–79% of it
Consider the relationship between how tight supply and demand are and where prices sit. For 1–22 August 2026, estimated occupancy on an OTA-listed-inventory basis was 93.8% in Tachikawa, 94.1% in Hachioji and 89.8% in Machida. Tokyo as a whole was 91.1% over the same window, so Tachikawa and Hachioji both cleared the metropolitan average. On summer inventory absorption at least, the three Tama hubs are not lagging the 23 wards.
| Area | Estimated occupancy Aug 2026 | Properties / rooms | Estimated settled ADR Jul 2026 | YoY | vs Tokyo |
|---|---|---|---|---|---|
| Tachikawa City | 93.8% | 14 / 1,436 | ¥9,919 | -2.3% | 78.5% |
| Hachioji City | 94.1% | 13 / 1,640 | ¥8,304 | +1.0% | 65.7% |
| Machida City | 89.8% | 11 / 1,437 | ¥8,342 | +3.7% | 66.0% |
| Tokyo | 91.1% | 1,384 / 184,144 | ¥12,642 | -4.8% | 100% |
Rates tell the opposite story. Estimated settled ADR in July 2026 was ¥9,900 in Tachikawa and ¥8,300 in both Hachioji and Machida — 66–79% of the ¥12,600 Tokyo average. The direction, though, is favourable. On a trailing-12-month average (August 2025 to July 2026), Tachikawa stood at ¥11,200 (+13.7% year on year), Hachioji at ¥8,100 (+4.5%) and Machida at ¥8,100 (+5.4%), all rising. Tokyo over the same window was ¥14,600 (+7.2%), so Tachikawa’s growth rate outpaced the metropolitan average.
A seasonal pattern is visible too. All three cities peak between February and April and trough in June and July, tracking school calendars, the fiscal year-end transition, the entrance-exam season, and the lull in corporate travel during the rainy season. Tachikawa in particular reached roughly ¥12,800 in November 2025 and ¥12,200 in April 2026, about 26% above its trough (roughly ¥9,700 in June 2026). The width of that annual swing suggests headroom remains on the revenue management side.
Set this alongside listed REIT results. Invincible Investment Corporation (8963) reported June 2026 figures across 101 domestic hotels of ¥12,412 ADR, 82.7% occupancy and ¥10,264 RevPAR (ADR -3.9% year on year). That portfolio is weighted toward limited-service hotels, and the estimated settled ADRs across the three Tama hubs (Tachikawa ¥11,200, Hachioji and Machida ¥8,100) sit somewhat below it while occupancy sits above. Note also that Invincible owns Super Hotel Tokyo JR Tachikawa Kitaguchi (96 rooms), and Japan Hotel REIT Investment Corporation (8985) owns the b hachioji (196 rooms). Tama is already an area with a track record as an investment target for listed REITs.
Price-band positioning — 2 properties and 281 rooms above ¥20,000; 1 property and 81 rooms above ¥25,000
This is the core of the analysis. We mapped the market across the 37 properties within 1 km of the three stations, using trailing-12-month average estimated settled ADR against room count.
The distribution is unambiguous. Below ¥12,500 sit 29 properties with 3,020 rooms (72.6% of all rooms); between ¥12,500 and ¥19,999 there are 6 properties with 859 rooms; at ¥20,000 and above, just 2 properties with 281 rooms. Above ¥25,000 there is only one property, in Tachikawa, with 81 rooms — 1.9% of all rooms within 1 km of the three stations.
Crowded Where the market already is
¥6,000–¥12,500 × 20–260 rooms
29 properties and 3,020 rooms cluster here. Budget-to-economy limited-service hotels are the battleground, and competition is easily undifferentiated. A new entrant will struggle to win on price.
WS 1 Mid price band (Hachioji, Machida)
¥12,500–¥20,000 × 80–250 rooms
All 6 qualifying properties (859 rooms) are in Tachikawa. Hachioji and Machida have none at all. A catchment with 110,000 workers and 90–94% occupancy has no inventory serving corporate demand in the mid band. This is the zone we recommend.
WS 2 Mid-scale × upper price band
120+ rooms × above ¥24,000
Zero qualifying properties. The only property in the upper band has 81 rooms, so nothing at banquet-and-meeting scale reaches the upper price band. Provision for anniversaries, small MICE and upper-tier leisure is thin.
Look more closely at White Space 1. The 6 properties (859 rooms) with estimated settled ADR between ¥12,500 and ¥20,000 are all located in the Tachikawa catchment. The Hachioji catchment has none in that band (its next-highest, excluding the top property, is around ¥12,300), and neither does Machida (its highest is around ¥12,400). Against a combined business concentration of 88,691 workers in Hachioji and Machida and estimated occupancy of 90–94%, there is effectively no inventory serving corporate demand in the mid price band.
White Space 2 is a void where scale and price fail to coexist. Fifteen properties within 1 km of the three stations have 120 rooms or more, but the highest estimated settled ADR among them is around ¥20,400 (a 200-room property in Hachioji); not one mid-scale property clears ¥24,000. In other words, the size class capable of carrying banquet halls and meeting rooms — and going after corporate events and anniversary demand — has never reached the upper price band. Read the other way, the incumbents in the upper band face few direct comparisons, an environment in which scarcity works in their favour.
Site assessment — station fronts zoned commercial at 600–800% FAR, land prices up 4–5% at all three
From a site-acquisition standpoint, we checked zoning, floor-area ratio (FAR) and land prices around each station in the Real Estate Information Library of the Ministry of Land, Infrastructure, Transport and Tourism.
| Tachikawa, Akebono-cho 2-7-20 | ¥5,850,000/sqm +5.0% YoY |
| Machida, Haramachida 6-3-9 | ¥2,970,000/sqm +4.2% YoY |
| Hachioji, Asahi-cho 2-6 | ¥2,840,000/sqm +4.8% YoY |
| Around Tachikawa Station | Commercial Zone, FAR 400–800% |
| Around Hachioji Station | Commercial Zone, FAR 400–700% |
| Around Machida Station | Commercial Zone, FAR 400–700% |
| Peripheral areas | Neighborhood Commercial, FAR 200–400% |
| Central Tachikawa City | Fire Prevention / Semi-Fire Prevention District |
The central station fronts at all three are zoned Commercial, with FAR reaching 800% at Tachikawa and 700% at Hachioji and Machida — ample for absorbing floor area in a hotel use. Land prices are up 4–5% year on year at all three, and the upward trend continues.
That said, the highest-priced station-front sites are not realistic acquisition targets for hotel development. Tachikawa’s ¥5,850,000/sqm is on a par with sub-central locations in the 23 wards. Move a few hundred metres from the station, however, and the level drops sharply. Measured points: Tachikawa, Shibasaki-cho 3-13-22 (450 m from the station, FAR 400%) at ¥880,000/sqm and Akebono-cho 1-12-23 (500 m, FAR 500%) at ¥900,000/sqm; Hachioji, Koyasu-cho 4-10-15 (160 m, FAR 300%) at ¥580,000/sqm and Tera-machi 29-2 (600 m, FAR 300%) at ¥295,000/sqm; Machida, Haramachida 4-5-8 (400 m, FAR 600%) at ¥895,000/sqm.
In short, the three Tama hubs can offer acquisition terms of walking distance to the station, FAR of 400–700%, and land at a fraction of central-23-ward levels. That is a competitive range even against Omiya, Kawasaki and Yokohama, the comparable suburban hubs in Greater Tokyo. Indeed, the new hotel opening in October 2026 sits precisely in that ¥580,000/sqm band (Koyasu-cho 4-chome, Hachioji).
Supply pipeline — after a three-year gap, 325 rooms arrive from autumn 2026
Now the supply timeline. On a confirmed-OTA-listing basis, the number of lodging properties whose opening could be verified across the three cities of Tachikawa, Hachioji and Machida between 2024 and 2026 is zero (the most recent confirmed opening was in 2023). For three years, essentially no new rooms have entered these three core Tama cities.
That gap starts to close from autumn 2026.
| Property | Location | Rooms | Opening / completion | Developer and notes |
|---|---|---|---|---|
| Smile Hotel Hachioji Minamiguchi Ekimae | Koyasu-cho 4-11-8, Hachioji City | 114 | 16 October 2026 | Hospitality Operations. About 5 minutes’ walk from the south exit of JR Hachioji Station. The ninth Smile-brand property in Tokyo and the brand’s first in Hachioji City. |
| THE NEXTT HOTEL | Akebono-cho 2-40-15, Tachikawa City | 211 | 1 March 2027 | Tachihi Holdings. Two basement levels and 12 storeys above ground; gross floor area approx. 25,800 sqm. On the fourth floor, a grand banquet hall of approx. 1,050 sqm seating up to about 1,500 (among the largest in the Tama region) plus seven further banquet rooms. |
| Hachioji Misaki-cho project (provisional name) | Misaki-cho 2-12, Hachioji City | Not disclosed | January 2028 (scheduled completion) | 12 storeys above ground; gross floor area approx. 1,390 sqm. Construction started April 2026. |
The two announced projects total 325 rooms — an increase of 7.8% against the current stock of 4,160 rooms within 1 km of the three stations. THE NEXTT HOTEL in particular lands squarely in White Space 2 (120+ rooms × upper price band) identified in the previous section. Alongside its 211 rooms it carries a grand banquet hall of approximately 1,050 sqm seating up to 1,500, which Tachihi Holdings describes as among the largest banquet facilities in the Tama region. It is designed to connect banquet and meeting demand to rooms — a type of supply the Tama lodging market has long lacked.
One note on how to read supply data. Because OTA listings appear only a few months before opening, the most recent periods are structurally undercounted. “Zero openings from 2024 to 2026” is a confirmed fact; “the pipeline beyond 2028 has dried up” is not a conclusion the data supports. Building confirmation applications are typically filed one to two years before opening, so the post-2028 counts in the table above will grow as further applications are filed.
Rail investment timeline — the monorail extension starts to matter in the mid-2030s
What shapes the medium-term site value of Tama is the extension of the Tama Toshi Monorail. The line currently runs roughly 16 km between Tama Center and Kamikitadai, serving as the north–south trunk route and passing through Tachikawa.
The Hakonegasaki direction (Kamikitadai to JR Hakonegasaki) has entered the implementation stage. On 27 November 2025, the Tokyo Metropolitan Government Bureau of Construction announced that it had obtained urban planning project approval from MLIT (Kanto Regional Development Bureau Notice No. 232) and had commenced the project. The construction section runs 7,055 metres from Kamikitadai 1-chome, Higashiyamato City, to Sayama, Oaza Hakonegasaki, Mizuho Town, Nishitama District, with seven stations. The project period runs FY2025–FY2034, and the cost is ¥90.4 billion for the infrastructure portion (approximately ¥129.0 billion in total including non-infrastructure items such as rolling stock and overhead lines). The opening target is the mid-2030s (FY2034 according to material published by Machida City).
The Machida direction (Tama Center to Machida) remains pre-implementation. The 2016 report of the Council for Transport Policy identified it as “a project meaningful to realizing the desired form of urban railways in the Tokyo area,” and a route was selected on 27 December 2021. Machida City is advancing advance land acquisition for the city planning road that will host the alignment, under an “acceleration project.” No construction start or opening date has been announced.
| Section | Stage | Length | Stations | Project cost | Timeline |
|---|---|---|---|---|---|
| Kamikitadai–Hakonegasaki | Urban planning project approved (27 November 2025) | 7,055 m | 7 | ¥90.4bn (approx. ¥129.0bn total) | Project period FY2025–FY2034 / opening targeted for the mid-2030s |
| Tama Center–Machida | Route selected (27 December 2021); alignment corridor being assembled | approx. 16 km (concept) | Not disclosed | Not disclosed | In coordination toward project authorization |
The implication for investment decisions is clear. The Hakonegasaki section opens in the mid-2030s and the Machida section later still. The initial payback period for a development being considered now (roughly ten years from opening) overlaps almost exactly with when the monorail extension begins to take effect. The extension is therefore best treated not as a precondition for an acquisition decision but as an upside factor in the second half of a hold. Tachikawa is already a monorail junction and is, on this point, ahead of the other two.
Development scenarios — what works on a 1,000 sqm site at 300% FAR, five minutes from the station
Using the measured figures above, we model the conditions under which hotel development pencils out on a typical Tama site. The assumptions take the Hachioji Station south-exit catchment: a 1,000 sqm site at 300% FAR, giving 3,000 sqm of gross floor area (907.5 tsubo). Land is priced at the measured benchmark of ¥580,000/sqm (Koyasu-cho 4-10-15), putting land acquisition at ¥580 million.
Gross floor area per room is benchmarked against a project that actually proceeded in the same area. The 114-room new-build opening in October 2026 (Koyasu-cho 4-chome) has a gross floor area of approximately 2,890 sqm, or about 25.4 sqm per room (gross). On that basis we adopt 26 sqm for economy, 32 sqm for midscale and 45 sqm for upper-midscale.
| Item | A. Economy | B. Midscale Recommended | C. Upper-midscale |
|---|---|---|---|
| Gross floor area per room | 26 sqm | 32 sqm | 45 sqm |
| Rooms | 115 | 94 | 67 |
| Assumed ADR (tax-exclusive equivalent) | ¥9,000 | ¥15,000 | ¥22,000 |
| Assumed occupancy (full-year modelling assumption) | 87% | 85% | 78% |
| Annual rooms revenue | ¥329M | ¥437M | ¥420M |
| GOP margin | 50% | 44% | 38% |
| GOP | ¥164M | ¥193M | ¥159M |
| Land | ¥580M | ¥580M | ¥580M |
| Construction cost (per tsubo) | ¥2.20M | ¥2.40M | ¥2.50M |
| Construction cost (2025 actuals basis) | ¥2.00bn | ¥2.18bn | ¥2.27bn |
| Total investment (2025 actuals basis) | ¥2.58bn | ¥2.76bn | ¥2.85bn |
| GOP yield (2025 actuals basis) | 6.4% | 7.0% | 5.6% |
| Construction cost (inflation-adjusted) | ¥2.26bn | ¥2.46bn | ¥2.56bn |
| Total investment (inflation-adjusted) | ¥2.84bn | ¥3.04bn | ¥3.14bn |
| GOP yield (inflation-adjusted) | 5.8% | 6.3% | 5.1% |
| Years to recover investment from GOP (inflation-adjusted) | 17.3 | 15.8 | 19.7 |
The recommendation is Scenario B (midscale, 94 rooms, ADR ¥15,000), for three reasons. First, it lands directly in White Space 1 (the ¥12,500–¥20,000 band), where Hachioji and Machida have no competitors. Second, even after inflation it delivers the best result of the three at a 6.3% GOP yield and 15.8-year payback. Third, the assumed ADR of ¥15,000 sits within what existing upper-tier properties in the area already achieve (Hachioji’s highest at around ¥20,400; Tachikawa’s mid band at ¥14,200–¥18,000), so it is not a price the market has never seen.
Scenario C looks weaker not because upper-band demand is absent, but because a 45 sqm gross area per room loses efficiency on a site limited to 300% FAR. Going after the upper band would instead point to a station-front commercial site where 600–700% FAR is available, or to a peripheral location with cheaper land (such as the ¥295,000/sqm band at Tera-machi in Hachioji).
Sensitivity analysis and risk factors
For the recommended Scenario B, we test resilience if ADR and occupancy come in below plan (with the inflation-adjusted total investment of ¥3.04bn as the denominator).
| Case | ADR | Occupancy (full-year) | Annual rooms revenue | GOP | GOP yield |
|---|---|---|---|---|---|
| Base case | ¥15,000 | 85% | ¥437M | ¥193M | 6.3% |
| ADR -10% | ¥13,500 | 85% | ¥394M | ¥173M | 5.7% |
| Occupancy -5 pts | ¥15,000 | 80% | ¥412M | ¥181M | 6.0% |
| Both | ¥13,500 | 80% | ¥371M | ¥163M | 5.4% |
Two-axis grid: ADR × occupancy (Scenario B, GOP yield)
| Assumed ADR \ full-year occupancy | 75% | 80% | 85% | 90% |
|---|---|---|---|---|
| ¥13,500 | 5.0% | 5.4% | 5.7% | 6.0% |
| ¥15,000 (base) | 5.6% | 6.0% | 6.3% | 6.7% |
| ¥16,500 | 6.1% | 6.6% | 7.0% | 7.4% |
Seen on two axes, Scenario B does not depend heavily on either ADR or occupancy alone. Even if ADR falls to ¥13,500, securing 80% full-year occupancy still yields 5.4%; even if occupancy drops to 75%, an ADR of ¥16,500 leaves 6.1%. On the upside, ADR of ¥16,500 at 90% occupancy reaches 7.4%. Given the recent record across the three Tama hubs (estimated occupancy of 89.8–94.1% in August 2026), assumptions of 75–80% occupancy are conservative, and downside resilience is probably thicker than the table implies. Note, however, that the grid holds the GOP margin at 44%, so if operating costs run above plan the yield will fall even when ADR and occupancy land as expected.
Even in the combined case of ADR 10% below plan and occupancy 5 points lower, the GOP yield holds at 5.4%. Behind that resilience is the fact that lodging demand in Tama is spread across business, education and leisure.
| Risk factor | Description | Assessment |
|---|---|---|
| Market | 325 rooms enter within 1 km of the three stations between October 2026 and March 2027 (+7.8% against current stock), thickening inventory in the near term | Medium |
| Price | Estimated settled ADR is 66–79% of the Tokyo average. The upper band has little track record, and holding above ¥15,000 will take operating capability | Medium |
| Construction | Construction costs are up 41% versus 2022. Each additional year of delay before groundbreaking adds roughly 5% to construction cost | Medium |
| Demand | Demand sources are diversified: 151,678 workers plus 21 universities and around 90,000 students in Hachioji. Little dependence on any single source | Low |
| Regulation and site | Station fronts are zoned Commercial at FAR 400–800%. Central Tachikawa City is a Fire Prevention District, adding fire-resistance requirements | Low |
| Infrastructure | The monorail extension takes effect in the mid-2030s and cannot be a premise for an acquisition decision | Medium |
The largest consideration is supply timing. With 325 rooms arriving in October 2026 and March 2027 combined, the supply-demand balance in 2027 and 2028 is likely to be looser than today. A site acquired now would open in 2029 at the earliest. Confirm early in the business plan that the opening date falls after the absorption of those 325 rooms has worked through.
Conclusion — “outside the 23 wards” is not thin; it is skewed by price band
Viewed through measured data, the three Tama hubs look somewhat different from the received wisdom.
First, demand is not thin. The 151,678 workers within 1 km of the three stations exceed the Omiya and Kawasaki station catchments, and estimated occupancy of 89.8–94.1% as of August 2026 matches or beats the Tokyo average of 91.1%.
Second, supply is less “scarce” than “skewed.” Rooms per 1,000 workers on a 2 km radius — 16.2 in Tachikawa and 16.4 in Machida — put both in the bottom group of 11 Greater Tokyo hubs, but the bigger issue than absolute volume is the price-band distribution. Of 37 properties and 4,160 rooms, 72.6% cluster below ¥12,500; above ¥20,000 there are 2 properties with 281 rooms, and above ¥25,000 just 1 property with 81 rooms. In Hachioji and Machida, not a single property clears ¥12,500.
Third, the market has started to move. After three years without an opening, 114 rooms arrive in October 2026 and 211 in March 2027. The latter in particular — 211 rooms with a grand banquet hall of approximately 1,050 sqm seating up to 1,500 — will be the first supply in Tama to combine scale, an upper price band and banquet capability.
For investors and development teams, the implication is not a leap straight to the upper band but going after the midscale segment (estimated settled ADR of ¥12,500–¥20,000) in Hachioji and Machida. Our model gives a 6.3% GOP yield after inflation, holding 5.4% even in the combined case of ADR 10% below plan and occupancy 5 points lower. A few hundred metres from the station, land sits in the ¥300,000–¥900,000/sqm range with FAR of 400–700% available. The Tama Toshi Monorail extension is a mid-2030s story, better treated as upside in the back half of a hold than as a premise for the acquisition decision.
Frequently asked questions
Q. How many hotels and rooms are there around Tachikawa, Hachioji and Machida stations?
A. Within a 1 km radius of each station, hotels and ryokan with recently confirmed active OTA listings (across five segments: ryokan, resort, business, city and deluxe) total 37 properties and 4,160 rooms (Tachikawa 17 properties / 1,565 rooms; Hachioji 12 / 1,612; Machida 8 / 983). On an all-accommodation basis including adults-only, capsule and guesthouse properties, the figure is 44 properties and 4,339 rooms.
Q. How do hotel rates in the Tama region compare with Tokyo’s 23 wards?
A. Estimated settled ADR in July 2026 was approximately ¥9,900 in Tachikawa City and approximately ¥8,300 in both Hachioji City and Machida City — 66–79% of the Tokyo average of approximately ¥12,600. On a trailing-12-month average, however, Tachikawa City is up 13.7% year on year, ahead of the Tokyo average (+7.2%).
Q. Are any new hotels opening in the Tama region?
A. Smile Hotel Hachioji Minamiguchi Ekimae (114 rooms) is scheduled to open on 16 October 2026, and THE NEXTT HOTEL (211 rooms) at the north exit of Tachikawa Station on 1 March 2027. The latter includes seven banquet rooms, among them a grand banquet hall of approximately 1,050 sqm seating up to about 1,500. No new openings could be confirmed across the three cities between 2024 and 2026, making this the first addition to supply in three years.
Q. When will the Tama Toshi Monorail extension open?
A. The Kamikitadai–JR Hakonegasaki section (7,055 m, seven stations) obtained urban planning project approval on 27 November 2025; the project period runs FY2025–FY2034, with an opening targeted for the mid-2030s (FY2034 according to material published by Machida City). The Machida direction (Tama Center to Machida, approximately 16 km) is at the stage of route selection in December 2021, and no opening date has been announced.
Q. What land prices and floor-area ratios apply when acquiring a hotel site in the Tama region?
A. The highest-priced station-front commercial sites are ¥5,850,000/sqm in Tachikawa, ¥2,970,000/sqm in Machida and ¥2,840,000/sqm in Hachioji (all from the 2025 Official Land Price, up 4–5% year on year). A few hundred metres from the station, prices fall to the ¥295,000–¥900,000/sqm range. Zoning at the station fronts is Commercial with FAR of 400–800%; peripheral areas are Neighborhood Commercial at 200–400%.
⚠ Note on future dates and future plans: the estimated occupancy figures in this article include future dates based on sales inventory published on OTAs at the time of the survey, and they shift as the check-in date approaches. Information on new openings and building plans reflects each operator’s disclosure at the time of publication, and opening dates and room counts may change. Because building plans are on a confirmation-application basis, counts and room numbers are expected to rise as further applications are filed.
Related reading
- Tokyo 23 Wards Supply Pressure 2026: Arakawa 16.0%, Minato Just 4.5%
- Tokyo Bay 2040: Dual-Growth Zones for Hotel Investment (+23.8%)
- Dual-Growth Hotel Site Screening: 18 Japan Nodes With Rising Residents & Jobs
- Utsunomiya 300-Room Hotel Plan: LRT, Business Demand & +5% Supply
- Naniwasuji & Haneda Access Lines 2031: Hotel Investment Timelines
References and sources
■ Data sources
Business concentration was aggregated from the Economic Census for Business Activity (2021) to 1 km and 2 km radii around each station using 2020 Population Census small-area boundaries (11 small areas for Tachikawa, 23 for Hachioji, 18 for Machida). Room stock was extracted from the property master within a 1 km radius, counting only the five segments — ryokan, resort, business, city and deluxe — whose OTA listings were confirmed still active as of the most recent observation (N=37 properties, 4,160 rooms). Estimated settled ADR uses the municipality × month finalized (history) series; estimated occupancy is the average across days between 1 and 22 August 2026 on which listed inventory was observed (18 days for Tachikawa and Hachioji, 17 for Machida, 22 for Tokyo). Land prices, zoning and floor-area ratios come from the Real Estate Information Library, MLIT; construction costs from the Construction Starts Statistics; and the pipeline from operator announcements and building plans on a confirmation-application basis.
■ Modelling assumptions
The development scenarios assume the Hachioji Station south-exit catchment with a 1,000 sqm site at 300% FAR and 3,000 sqm of gross floor area; land is valued at the measured benchmark price of ¥580,000/sqm (Koyasu-cho 4-10-15), or ¥580 million. Gross floor area per room is benchmarked on an actual project in the same area (114 rooms, approximately 2,890 sqm gross, or about 25.4 sqm per room), giving 26 sqm for economy, 32 sqm for midscale and 45 sqm for upper-midscale. Per-tsubo construction costs use 2025 actuals (steel frame ¥2.405M, reinforced concrete ¥2.026M) adjusted by segment; the inflation adjustment assumes a spring 2029 opening with 24 months of construction and compounds +4.5% to +5.3% a year to the construction midpoint, applying a cumulative +13.0%. GOP margins are set by segment between the 38.9% operating result disclosed by a listed REIT and the 40–60% industry benchmark for limited-service business hotels. The sensitivity analysis and the two-axis grid hold Scenario B’s 94 rooms, 365 days, 44% GOP margin and inflation-adjusted total investment of ¥3.04bn fixed, varying only ADR and full-year occupancy. Revenue covers the rooms department only and excludes banquet, F&B and ancillary income.
■ Limitations and caveats
Both ADR and occupancy are estimates based on inventory published on OTAs, and differ from each property’s actual transacted rates, true operating occupancy and accounting figures. Because rooms per 1,000 workers is sensitive to the choice of catchment radius, both 1 km and 2 km figures are shown. Since OTA listings appear only a few months before opening, opening counts for the most recent periods are structurally undercounted; building plans are likewise on a confirmation-application basis, so counts and room numbers may rise with further filings (treat the pipeline as a lower bound). Estimated occupancy includes inventory for future dates published as of the survey, which shifts as the check-in date approaches. The development scenarios are a simplified model covering the rooms department only, and exclude acquisition costs, financing costs and exit assumptions. An actual investment decision requires a property-specific feasibility study.
■ Market data
- MetroEngines Research & Consulting — estimated settled ADR (N=37 properties; N=11–19 properties by area), estimated occupancy on an OTA-listed-inventory basis (N=11–14 properties; Tokyo N=1,384 properties), property master and J-REIT ownership master (as of August 2026)
■ Government statistics and public data
- Economic Census for Business Activity (2021), Ministry of Internal Affairs and Communications & METI; boundaries from 2020 Population Census small areas (e-Stat Statistical GIS) — establishment counts, worker counts, office-sector worker share
- Real Estate Information Library, Ministry of Land, Infrastructure, Transport and Tourism — Official Land Price and prefectural land price surveys (2025), urban planning GIS data (use districts, fire prevention districts)
- MLIT Construction Starts Statistics — hotel construction cost per tsubo (2025: steel frame ¥2.405M, reinforced concrete ¥2.026M)
- MLIT Building Dynamics Statistics Survey — building plans (confirmation-application basis)
■ Rail and urban planning
- Tokyo Metropolitan Government, “Commencement of the Tama Toshi Monorail extension project” press release (Bureau of Construction, 27 November 2025)
- Tokyo Metropolitan Government Bureau of Construction, Kita-Tama North Construction Office, “Development of the Tama Toshi Monorail” (updated 9 June 2026)
- Machida City, “Outline of the Tama Toshi Monorail extension toward Machida” (updated 31 July 2026)
■ REIT and industry benchmarks
- Invincible Investment Corporation, “Monthly Operating Status for June 2026” (101 domestic hotels)
- Invincible Investment Corporation portfolio (91 MHM-operated properties, 38.9% GOP margin, FY ending December 2024)
- Japan Hotel REIT Investment Corporation portfolio list
- Relo Hotel Solutions, “GOP margin benchmarks by hotel segment”
- JLL, “Japan Hotel Investment Market 2025” — construction costs and GOP outlook
■ Operator announcements and municipal materials
- Tachihi Holdings, “THE NEXTT HOTEL to open in Tachikawa, Tokyo on 1 March 2027” (20 May 2026)
- Hospitality Operations, “New-build hotel Smile Hotel Hachioji Minamiguchi Ekimae to hold grand opening in Hachioji City, Tokyo on 16 October 2026” (31 July 2026)
- Hachioji City, “Universities, junior colleges and technical colleges in the Hachioji area” — 21 institutions and approximately 90,000 students in the city; 25 institutions and approximately 100,000 students in the Consortium of Universities in Hachioji