

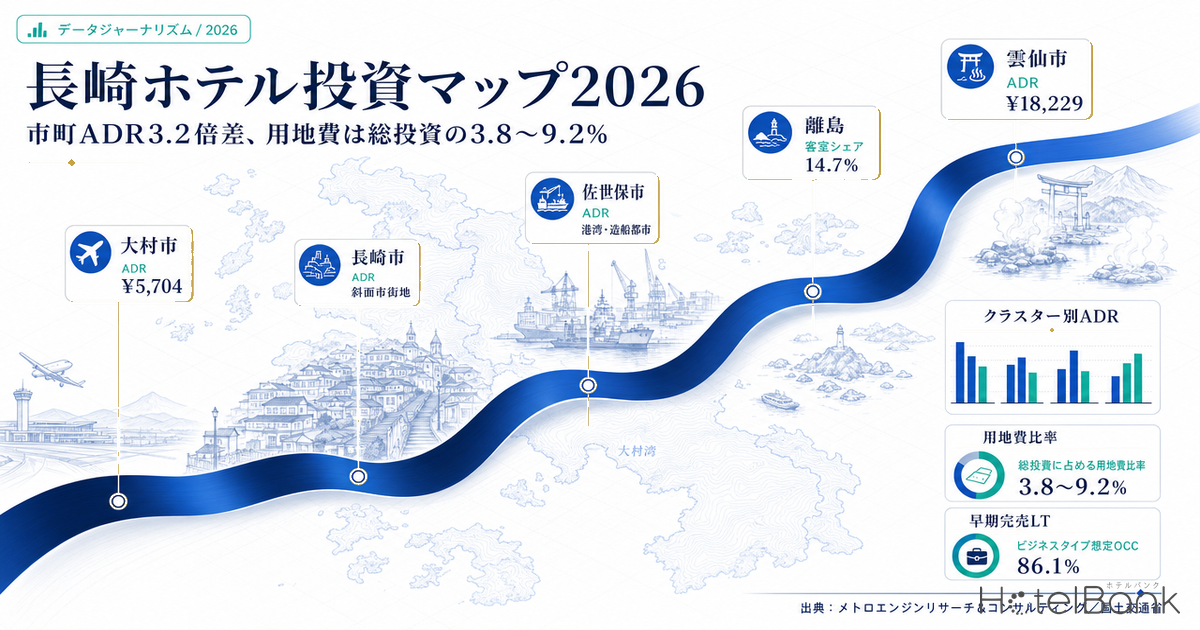
Line up Nagasaki Prefecture’s municipalities by room rate and the spread is 3.2x. On a confirmed-month basis over the trailing 12 months, the estimated settled ADR in Unzen is ¥18,200; in Omura it is ¥5,700. Same prefecture, less than 50km apart in a straight line. Where does that gap come from, and where does it leave room for investors? This article quantifies the answer by location type.
We have already published two pieces on Nagasaki. The first covered 2026 new supply and its year-on-year change from a revenue-management angle, where supply volume itself was the subject. The second, our booking-curve review of early September, dealt with how demand builds. This article overlaps with neither. Its subject is location as an asset, and supply figures appear only as background.
The “prefectural capital is the cheapest” inversion often seen in other prefectures does not apply here either. Nagasaki City’s estimated settled ADR ranks fifth in the prefecture, with hot-spring towns above it. Nagasaki’s distinctiveness lies elsewhere: (1) a hillside urban core with little flat land, (2) remote islands holding 14.7% of the prefecture’s room stock, and (3) an airport located in Omura rather than the capital. Those three points frame the analysis.
Metric Definitions Used in This Article
- ADR (average daily rate) = an estimated settled rate (tax-excluded equivalent) derived by applying a property-type correction coefficient to the lowest published plan level each property lists on OTAs (two guests per room, per-room price, tax-included). Cross-checked against property-level results disclosed by listed hotel REITs (91 properties, trailing 3 months), the median error is approximately 7%. These are estimates and differ from each property’s actual transacted prices and accounting figures. Area-level ADR is the median of the properties covered (the level of a typical property in that area).
- OCC (occupancy rate) = sold rooms as a share of total rooms in the area (estimated from OTA sales inventory). Used only at macro units such as prefecture and municipality.
- LT (lead time) = days until check-in. LT0 = same day. Early sell-out LT = the lead time at which remaining rooms first reached zero (a larger value means selling out earlier). Sell-out observation days = the cumulative number of days on which zero remaining rooms was observed.
- Data sources: MetroEngines Research & Consulting / MLIT Real Estate Information Library (official land price survey, land-use zoning, disaster hazard zones) / MLIT National Land Numerical Information (250m mesh future population projections) / Ministry of Internal Affairs and Communications & METI Economic Census
- — Estimated settled ADR by municipality spans ¥18,229 in Unzen to ¥5,704 in Omura, a 3.2x gap. The capital, Nagasaki City, sits fifth at ¥10,107, with hot-spring towns occupying the top (average of confirmed months, August 2025–July 2026).
- — Land accounts for only 3.8–9.2% of total investment. Even at ¥402,461/㎡ for commercial land in central Nagasaki City, land is ¥966 million against ¥10,517 million of total investment; what decides a new build is not land price but construction cost (up 41% per tsubo in three years).
- — The three new-build cases yield 4.42–4.71%; acquiring and renovating existing stock yields 10.87%. Even with ADR down 10% and occupancy down 5pt simultaneously, the existing-stock route holds 9.21% — structurally superior on downside resilience as well.
- — The airport axis (Omura, Isahaya) sold out at an average early sell-out LT of 32.0 days across the four Obon days — among the fastest in the prefecture — yet averages just ¥6,744. 61.8% of the 539 rooms opening in 2026 are concentrated on this axis, so operators are reading the same opportunity.
- — Nagasaki City has a ¥10,000–¥14,000 price-band void between business hotels at ¥7,985 and city hotels at ¥16,116. A workplace cluster of 33,371 employees and an estimated OCC of 86.1% (July 2026, business-hotel segment, N=115 properties) back the demand side.
Five-cluster structure — a third of rooms sit in the hillside capital, a seventh on the islands
Start by splitting the prefecture’s room stock into five groups by the character of their location. Of roughly 168,000 domestic properties tracked by MetroEngines Research, 1,108 properties with 26,615 rooms can be confirmed as operating in Nagasaki Prefecture. Sorting them into “hillside capital (Nagasaki City),” “port and shipbuilding business city (Sasebo),” “resort hot springs (Unzen, Saikai, Hirado, Shimabara, Minamishimabara),” “islands (Goto, Iki, Tsushima, Shinkamigoto, Ojika),” and “airport and inland business (Omura, Isahaya)” produces the following.
| Cluster | Properties | Rooms | Share | Estimated settled ADR | N (properties) |
|---|---|---|---|---|---|
| Hillside capital Nagasaki City | 216 | 8,864 | 33.3% | ¥10,107 | 63 |
| Port & shipbuilding business city Sasebo | 129 | 5,241 | 19.7% | ¥7,507 | 35 |
| Resort hot springs Unzen, Hirado, Shimabara, Minamishimabara, Saikai | 215 | 4,014 | 15.1% | ¥13,783 | 58 |
| Islands Tsushima, Goto, Iki, Shinkamigoto, Ojika | 373 | 3,910 | 14.7% | ¥7,539 | 52 |
| Airport & inland business Isahaya, Omura | 97 | 3,484 | 13.1% | ¥6,189 | 34 |
| Other Matsuura, Togitsu, Hasami, Kawatana, Higashisonogi, Nagayo | 78 | 1,102 | 4.1% | ¥7,099 | 12 |
The pattern is clear: the larger the cluster’s room count, the lower its rate. The hillside capital (8,864 rooms) and the port/shipbuilding city (5,241 rooms) together hold 53.0% of prefectural stock, yet their ADRs are ¥10,100 and ¥7,500. The resort hot-spring cluster, fourth by size at 4,014 rooms (15.1%), carries the highest ADR at ¥13,800.
The islands deserve particular attention. Five municipalities hold 3,910 rooms, 14.7% of the prefecture. That approaches Sasebo’s scale (5,241 rooms) and exceeds the airport/inland business cluster of Isahaya and Omura combined (3,484 rooms). This is not a volume that can be treated as a small exception — the first feature separating Nagasaki from other prefectures. That said, island ADR at ¥7,500 is in line with the prefectural average, and rooms per property are small even at the median (373 properties for 3,910 rooms = 10.5 rooms per property). The stock exists in number, but it is structurally hard to assemble investment scale per deal. For how island price tiers form nationwide, see our side-by-side comparison of 10 major island municipalities, where rates span 2.37x.
Municipal ADR hierarchy — hot springs on top, business cities at the bottom, the capital fifth
Breaking the clusters down to municipality level: only confirmed months within the trailing 12 (August 2025–July 2026) were used, averaging estimated settled ADR. Estimates for future months are excluded from both the averages and the year-on-year figures.
| Municipality | Cluster | Estimated settled ADR | N (properties) | Rooms |
|---|---|---|---|---|
| Unzen | Resort hot springs | ¥18,229 | 29 | 1,801 |
| Hirado | Resort hot springs | ¥12,276 | 10 | 817 |
| Nagasaki City | Hillside capital | ¥10,107 | 63 | 8,864 |
| Shinkamigoto | Islands | ¥8,304 | 7 | 549 |
| Iki | Islands | ¥8,003 | 17 | 766 |
| Sasebo | Port & shipbuilding business city | ¥7,507 | 35 | 5,241 |
| Goto | Islands | ¥7,496 | 19 | 1,064 |
| Matsuura | Other | ¥6,705 | 6 | 485 |
| Isahaya | Airport & inland business | ¥6,620 | 18 | 2,101 |
| Tsushima | Islands | ¥6,156 | 9 | 1,459 |
| Shimabara | Resort hot springs | ¥6,097 | 11 | 689 |
| Minamishimabara | Resort hot springs | ¥5,976 | 5 | 393 |
| Omura | Airport & inland business | ¥5,704 | 16 | 1,383 |
Unzen leads at ¥18,200 (N=29) and Omura sits last at ¥5,700 (N=16), a ratio of roughly 3.2x. Nagasaki City ranks fifth at ¥10,100. In some prefectures the capital is the cheapest; Nagasaki is not one of them. Hot-spring towns take the top and business cities sink to the bottom — a more straightforward hierarchy. For the contrasting inverted case, where the capital falls to the prefecture’s lowest rate, see Kagoshima, where the capital is cheapest at ¥6,819 against Kirishima’s ¥14,330.
Cutting by property type reveals more. Nagasaki City’s city hotels sit at ¥16,100 (N=15) while its business hotels sit at ¥8,000 (N=33). That is a 2.0x step within the same city, and the ¥10,000–¥14,000 band between them is thin. Sasebo is similar: city hotels at ¥7,600 (N=4) against business hotels at ¥7,000 (N=19) — an upper band that has barely formed at all.
| City | Business | City | Resort | Ryokan |
|---|---|---|---|---|
| Nagasaki City | ¥7,985 N=33 | ¥16,116 N=15 | ¥16,753 N=8 | ¥14,132 N=5 |
| Sasebo | ¥7,028 N=19 | ¥7,555 N=4 | ¥13,197 N=8 | ¥4,690 N=4 |
| Isahaya | ¥6,448 N=14 | ¥7,169 N=3 | — | — |
| Omura | ¥5,576 N=13 | — | — | — |
| Unzen | ¥5,628 N=3 | — | ¥27,819 N=4 | ¥18,661 N=22 |
| Goto | ¥6,711 N=12 | — | ¥29,427 N=4 | — |
| Iki | ¥7,037 N=3 | — | — | ¥8,278 N=13 |
| Tsushima | ¥6,020 N=6 | — | — | — |
| Shimabara | ¥4,959 N=7 | — | — | ¥8,376 N=3 |
The prefecture-wide ADR trend is worth adding. Overlaying the 24 confirmed months from August 2024 by year shows a straightforward seasonality: peaks in August and November, a trough in June. Year-on-year change over the trailing 12 months averages +1.0% — essentially flat.
Kyushu seven-prefecture estimated settled ADR benchmark (average of confirmed months, August 2025–July 2026, prefecture level)
| Rank | Prefecture | Estimated settled ADR | vs Nagasaki | N (properties) |
|---|---|---|---|---|
| 1 | Oita | ¥14,909 | 1.90x | 436–470 |
| 2 | Saga | ¥12,164 | 1.55x | 145–157 |
| 3 | Fukuoka | ¥11,781 | 1.50x | 460–476 |
| 4 | Kumamoto | ¥10,579 | 1.35x | 366–401 |
| 5 | Nagasaki | ¥7,835 | 1.00x | 250–258 |
| 6 | Miyazaki | ¥6,913 | 0.88x | 159–169 |
| 7 | Kagoshima | ¥6,848 | 0.87x | 313–322 |
At prefecture level, Nagasaki’s estimated settled ADR of ¥7,835 ranks fifth among Kyushu’s seven prefectures — about 53% of hot-spring-rich Oita (¥14,909) and about 67% of Fukuoka (¥11,781). The prefecture as a whole sits in the lower-middle of Kyushu, yet contains a municipality — Unzen at ¥18,229 — above the average of Kyushu’s top prefectures. Nagasaki’s challenge is therefore not the prefecture-wide rate level but an allocation question: which tier of that internal dispersion to target. For a comparison with Kyushu’s two lowest prefectures, see Miyazaki and Saga hotel investment whitespace.
Location layers — 33,371 employees around Nagasaki Station, no catchment at all around the airport
With the rate hierarchy established, look at the demand underneath it. Lodging demand rests on two layers: resident population (leisure, visiting family, local ties) and working population (business travel). Both were pulled at representative coordinates.
| Location | Establishments | Employees | Office sector |
|---|---|---|---|
| Nagasaki Station | 3,092 | 33,371 | 27.0% |
| Nagasaki Hamanomachi | 4,697 | 42,735 | 25.9% |
| Sasebo Yonkacho | 2,224 | 18,922 | 13.6% |
| Omura Station | 798 | 6,411 | 6.9% |
| Isahaya Station | 816 | 4,787 | 13.5% |
| Nagasaki Airport | 43 | 831 | 4.6% |
| Location | 2020 | 2040 | Change |
|---|---|---|---|
| Nagasaki Station | 41,517 | 33,569 | -19.1% |
| Central Sasebo | 27,817 | 22,214 | -20.1% |
| Omura Station | 18,172 | 16,557 | -8.9% |
| Nagasaki Airport | No mesh coverage (offshore airport) | ||
These two tables hold the most important figures in this article. Nagasaki Station’s 33,371 employees and 27.0% office-sector share provide ample business demand for a prefectural capital. Extending to Hamanomachi brings the total to 42,735 employees. That is why the estimated OCC for business hotels reaches 86.1% prefecture-wide (July 2026).
Population dynamics point the other way. Resident population within the Nagasaki Station area falls from 41,517 in 2020 to 33,569 in 2040, -19.1%; central Sasebo falls -20.1%. Roughly a fifth of the population is projected to disappear in 20 years. Against that, the Omura Station area declines only 8.9%. The slowest population decline in the prefecture belongs to Omura — the municipality with the lowest ADR.
The mesh view shows that the resident population around Nagasaki Station sits only on a narrow strip along the bay. Population concentrates where the land is flat; the meshes beyond are hillside. The vessel for demand and the land to house it are competing for the same narrow flat ground — which leads to the next section.
Around Nagasaki Airport there are 43 establishments and 831 employees within a 1km radius (one recorded area, sparse data), and no 250m mesh coverage of resident population within 1.5km. That follows from it being an offshore airport, but the airport itself has no catchment. Any argument for lodging demand on the airport axis must rest not on a surrounding trade area but on a different demand type: connecting passengers and pre- and post-flight overnight stays. In fact, a listed REIT already holds an asset on this axis (discussed below).
Land prices and the hillside constraint — Nagasaki City commercial land is 7.4x Omura’s, and hazard zones cut into buildable sites
Land prices were taken from the official land price survey points in MLIT’s Real Estate Information Library, extracting commercial-zone points only within a fixed area covering each city’s centre, and tracking the same point set from 2022 to 2026.
| City | 2022 | 2026 | 4-year change | Highest point (2026) | N |
|---|---|---|---|---|---|
| Nagasaki City | 354,688 | 402,461 | +13.5% | 994,000 | 18 |
| Sasebo | 170,844 | 186,762 | +9.3% | 608,000 | 16 |
| Isahaya | 62,350 | 66,133 | +6.1% | 76,000 | 6 |
| Omura | 49,000 | 54,300 | +10.8% | 64,100 | 4 |
Nagasaki City’s commercial land averages ¥402,500/㎡ in 2026, with the highest point (Hamanomachi) at ¥994,000/㎡. For a regional city of roughly 400,000 residents, that is not cheap. The ratio to Omura (¥54,300/㎡) is 7.4x, while the ADR ratio is only 1.77x (Nagasaki City ¥10,100 ÷ Omura ¥5,700). The land-price gap is more than four times wider than the ADR gap.
Three channels through which hillsides affect development sites
Nagasaki’s shortage of flat land does not reach investment only through the simple channel of “land is expensive.” There are in fact three channels.
| Location (nine 14z tiles ≈ 38km²) | Hazard zones | Designated area | Central-area zoning |
|---|---|---|---|
| Central Nagasaki City | 58 | 25.0ha | Commercial zone, FAR 400–500% / BCR 80% |
| Central Sasebo | 107 | 49.4ha | Commercial zone, FAR 400% / BCR 80% (mixed with residential zoning) |
| Central Isahaya | 30 | 13.5ha | — |
| Central Omura | 12 | 4.0ha | Neighbourhood commercial zone, FAR 200% / BCR 80% |
Channel 1: buildable land is cut away
Within roughly 38km² of central Nagasaki City there are 58 steep-slope-collapse hazard zones covering 25.0ha. Sasebo has more still: 107 zones over 49.4ha. Because hillside sites fall outside the buildable stock, demand concentrates on flat commercial land. For the framework treating hazard as an axis of location assessment, see our analysis of disaster risk as the fourth axis in hotel site evaluation, covering hazard, ADR and disaster-resilience capex across eight national trade areas.
Channel 2: sites shrink and buildings go vertical
Hilton Garden Inn Nagasaki Chinatown (ヒルトン・ガーデン・イン長崎中華街), scheduled to open in the first half of 2027, has a 2,442.15㎡ site with 15,495.62㎡ of floor area across 13 storeys. Realised FAR is roughly 634%, stacking above the commercial zone’s designated ratio. What cannot spread horizontally is designed vertically.
Channel 3: assembled sites are scarcer than cheap ones
Nagasaki City’s commercial land tops out at ¥994,000/㎡, but what matters for an investment decision is less the unit price than whether several thousand ㎡ can be assembled in one deal. Omura and Isahaya have low FAR at 200% neighbourhood commercial, but flat, assembled sites are easier to secure.
In other words, Nagasaki City’s constraint shows up less as “land is expensive” and more as “sites are small.” Securing the same room count requires stacking storeys, and that feeds through to construction cost per unit. Conversely, Omura and Isahaya have low FAR at 200% neighbourhood commercial, but assembled flat sites are readily available, which suits low- and mid-rise limited-service plans.
Positioning — the price-band void seen through ADR x early sell-out LT
Next, match demand strength against price band. Property-level remaining-room movements were aggregated for the four Obon days of 13–16 August 2026 (dates that have already passed). Coverage is limited to properties whose OTA-published allocation is at least 30% of total rooms (where the published allocation is small, several explanations are possible — direct-booking-led operations, releasing inventory in small increments, or contracts with low OTA allocation — making it hard to read supply and demand from remaining rooms).
| Cluster | N | Avg. early sell-out LT | Avg. ADR | Median rooms |
|---|---|---|---|---|
| Islands | 22 | 35.5 days | ¥12,899 | 19 |
| Airport & inland | 6 | 32.0 days | ¥6,744 | 48 |
| Resort hot springs | 25 | 30.0 days | ¥15,679 | 15 |
| Port & shipbuilding | 7 | 24.7 days | ¥10,272 | 34 |
| Hillside capital | 10 | 20.6 days | ¥13,835 | 79 |
| Other | 4 | 15.5 days | ¥8,800 | 42 |
The second row of that table is the core of this article. The airport and inland cluster sold out at an average early sell-out LT of 32.0 days, faster than resort hot springs (30.0 days) — yet its average ADR of ¥6,700 is the lowest of the six clusters. This is where the gap between how fast demand arrives and what it pays is widest.
Property by property: Hotel New Global (ホテルニューグローバル) in Isahaya (72 rooms) was observed sold out on all four Obon days, with an average early sell-out LT of 60.2 days and 243 cumulative sell-out observation days. View Hotel Iki (ビューホテル壱岐) in Iki (24 rooms) sold out on all four days at an average LT of 50.5 days. Unzen Kyushu Hotel (雲仙九州ホテル) in Unzen (25 rooms) sold out at an average LT of 44.2 days despite an estimated settled ADR of ¥39,600, demonstrating that demand exists at higher price points.
Where the market is full
¥5,000–¥9,000 x 20–80 rooms
Business hotels in the business cities and small-to-mid ryokan on the islands cluster densely here. Occupancy is high at an estimated 86.1% (July 2026, business-hotel segment, N=115 properties), and incumbent operators’ execution carries this band.
Void 1: upper-mid in the business cities
¥10,000–¥14,000 x 100–200 rooms
Nagasaki City is thin between business hotels at ¥8,000 and city hotels at ¥16,100. In Sasebo the city-hotel band itself is only N=4. High occupancy plus a thin price band — the most legible opportunity.
Void 2: upper-grade limited-service on the airport axis
¥8,000–¥11,000 x 120–180 rooms
Among the fastest at an early sell-out LT of 32.0 days, yet ADR of ¥6,700. Population decline is the mildest in the prefecture and land runs to just 3.8% of total investment.
Supply pipeline — 62% of 2026’s 539 new rooms concentrate in Isahaya and Omura
Openings confirmed in Nagasaki Prefecture for 2026 total 27 properties and 539 rooms (as of the survey date, on an OTA-listing-confirmed basis). An earlier count stood at 23 properties and 521 rooms; subsequent listing confirmations have raised it. The prior year, 2025, saw 26 properties and 202 rooms, so room count is 2.7x higher.
| Opening | Property | Rooms | Type | Location |
|---|---|---|---|---|
| 2026-03-14 | Super Hotel Nagasaki Isahaya Natural Hot Spring (スーパーホテル長崎・諫早天然温泉) | 152 | Business hotel | Isahaya |
| 2026-04-01 | Hotel Livemax Nagasaki Airport (ホテルリブマックス長崎エアポート) | 117 | Business hotel | Omura |
| 2026-02-01 | Hotel & Monthly Isahaya Park (ホテル&マンスリー諫早公園) | 64 | Business hotel | Isahaya |
| 2026-04-29 | Ooedo Onsen Monogatari Premium Nagasaki Hotel Seifu (大江戸温泉物語Premium 長崎ホテル清風) | 57 | Hot-spring hotel | Nagasaki City |
| 2026-07-01 | Unzen Obama Sunset Showakan (雲仙小浜サンセット昭和館) | 41 | Ryokan | Unzen |
| Top five total | 431 | 80.0% of all 539 rooms | ||
Two of the three properties with 60+ rooms are in Isahaya and one is in Omura. By room count that is 152+117+64 = 333 rooms, meaning 61.8% of 2026’s 539 new rooms concentrate on the Isahaya–Omura airport axis. The fact that the prefecture’s largest new supply is landing in its lowest-ADR band suggests operators see the same opportunity.
For 2027 and beyond, the plan whose existence can be confirmed from primary sources is Hilton Garden Inn Nagasaki Chinatown (ヒルトン・ガーデン・イン長崎中華街; 313 rooms, scheduled to open in the first half of 2027), announced by Daiwa House Industry (大和ハウス工業). The site at 9-1 Shinchimachi, Nagasaki City covers 2,442.15㎡ with 15,495.62㎡ of floor area across 13 storeys. Floor area per room is 49.5㎡, a specification consistent with the upper-mid band. Against Nagasaki City’s existing 8,864 rooms, 313 rooms equal 3.5% — the first large single-project supply to enter the capital in some time.
In October 2024, Stadium City Hotel Nagasaki (スタジアムシティホテル長崎; 243 rooms including 16 suites) opened within Nagasaki Stadium City. Within a 1km radius of Nagasaki Stadium City there are 19,151 employees with a 10.4% office-sector share — a trade area different in character from the workplace cluster in front of the station.
Development scenarios — land is 3.8–9.2% of total investment; construction cost decides feasibility
The location conditions above translate into a simplified feasibility test. The assumptions are as follows.
Stage 1 (2025 actuals) — hotel construction cost based on MLIT’s “Construction Starts Statistics” averaged ¥1.952 million per tsubo across all structures in 2025 (RC ¥2.026 million, S ¥2.405 million). That is up 41% in three years from ¥1.38 million in 2022.
Stage 2 (construction-period inflation) — assuming a 2029 opening with construction from 2027 to 2029, costs are compounded to the 2028 midpoint at roughly +5% per year (Turner & Townsend forecasts: +5.3% for 2026, +5.0% for 2027; for 2028 onward, +4.5% is assumed as the firm has not published a forecast). The adjusted rate used is ¥2.255 million per tsubo.
GOP margins by property type are set at 32% for upper-mid, 40% for mid and 50% for limited-service. These are placed conservatively as first-year assumptions for a new opening, with reference to J-REIT disclosure (a 38.9% GOP result across 91 MHM-operated properties disclosed by Invincible Investment Corporation, fiscal period ended December 2024). Occupancy uses this article’s estimated OCC (as of July 2026).
| Item | A Central Nagasaki City Upper-mid | B Central Sasebo Mid | C Omura = airport axis Limited-service Land efficiency | D Existing stock Acquire + renovate Recommended |
|---|---|---|---|---|
| Site area | 2,400㎡ | 1,800㎡ | 3,500㎡ | — |
| Floor area | 14,000㎡ | 8,000㎡ | 7,000㎡ | — |
| Realised FAR | 583% | 444% | 200% | — |
| Rooms | 280 | 200 | 175 | 100 |
| Floor area per room | 50㎡ | 40㎡ | 40㎡ | — |
| Land / acquisition cost | ¥966mn | ¥336mn | ¥190mn | ¥800mn |
| Construction / renovation cost | ¥9,551mn | ¥5,458mn | ¥4,776mn | ¥500mn |
| Total investment | ¥10,517mn | ¥5,794mn | ¥4,966mn | ¥1,300mn |
| Total investment per room | ¥37.6mn | ¥29.0mn | ¥28.4mn | ¥13.0mn |
| Land / acquisition as share | 9.2% | 5.8% | 3.8% | 61.5% |
| Assumed ADR | ¥18,000 | ¥11,000 | ¥8,000 | ¥9,000 |
| Assumed occupancy | 83.6% | 85.0% | 86.0% | 86.0% |
| Room revenue (annual) | ¥1,538mn | ¥683mn | ¥439mn | ¥283mn |
| GOP margin / GOP | 32% / ¥492mn | 40% / ¥273mn | 50% / ¥220mn | 50% / ¥141mn |
| Yield on total investment | 4.68% | 4.71% | 4.42% | 10.87% |
| ADR required for a 6% yield | ¥23,080 | ¥14,010 | ¥10,850 | Already achieved |
Three things follow from this table.
First, land accounts for only 3.8–9.2% of total investment. Even at central Nagasaki City’s high land price (¥402,500/㎡), land is ¥966 million against total investment of ¥10,517 million. In Omura it falls to ¥190 million (3.8%). In Nagasaki Prefecture, what decides whether a new build works is construction cost, not land price. That corrects the intuitive chain of scarce flat land = expensive land = difficult investment.
Second, all three new-build cases yield 4.4–4.7%, and reaching 6% would require ADR to run 27–36% above assumption. This is not specific to Nagasaki; it is the condition facing regional new-build hotels generally in a construction-cost environment where the per-tsubo rate has risen 41% in three years. In Nagasaki’s case, the required ADR is ¥23,100 for case A, ¥14,000 for case B and ¥10,900 for case C. Case A implies +43% over the ¥16,100 prevailing for Nagasaki City hotels; case C would require more than a 90% increase over the ¥5,600 prevailing for Omura business hotels.
Third, acquiring and renovating existing stock (case D) yields 10.9% — 2.3x the new-build level. Total investment per room is ¥13.0 million against ¥28.4–37.6 million for new builds. Actual transactions support that gap. Comfort Inn Nagasaki Airport (コンフォートイン長崎空港; 91 rooms), held by Hoshino Resorts REIT (星野リゾート・リート投資法人), was acquired for ¥630 million — ¥6.9 million per room (acquired May 2014). A listed REIT secured an existing asset on the airport axis at an early stage, consistent in direction with this article’s read on that axis. On the capital side, Kasumigaseki Hotel REIT (霞ヶ関ホテルリート投資法人) holds FAV LUX Nagasaki (opened February 2024).
Sensitivity analysis
| Scenario | ADR +10% Optimistic | Base | ADR -10% | Occ. -5pt | Both |
|---|---|---|---|---|---|
| A Central Nagasaki City, upper-mid | 5.15% | 4.68% | 4.21% | 4.40% | 3.96% |
| B Central Sasebo, mid | 5.18% | 4.71% | 4.24% | 4.43% | 3.99% |
| C Omura = airport axis, limited-service | 4.86% | 4.42% | 3.98% | 4.17% | 3.75% |
| D Existing stock, acquire + renovate | 11.96% | 10.87% | 9.78% | 10.23% | 9.21% |
Case C (Omura = airport axis, limited-service; 175 rooms, ¥4,966mn total investment, 50% GOP margin): two-axis ADR x occupancy sensitivity
| Occupancy \ ADR | ¥6,800 | ¥7,400 | ¥8,000 | ¥8,600 | ¥9,200 |
|---|---|---|---|---|---|
| 74% | 3.24% | 3.52% | 3.81% | 4.09% | 4.38% |
| 78% | 3.41% | 3.71% | 4.01% | 4.31% | 4.62% |
| 82% | 3.59% | 3.90% | 4.22% | 4.54% | 4.85% |
| 86% | 3.76% | 4.09% | 4.42% | 4.76% | 5.09% |
| 90% | 3.94% | 4.28% | 4.63% | 4.98% | 5.33% |
Even with ADR down 10% and occupancy down 5pt at the same time, case D (acquire and renovate existing stock) holds 9.21%, while the three new-build cases fall to 3.75–3.99%. On downside resilience too, acquiring and renovating existing stock is structurally superior.
Investment summary — the priorities implied by three distinctive conditions
| Nagasaki’s distinctive condition | How it affects investment | The move to make |
|---|---|---|
| A hillside urban core short of flat land 58 hazard zones over 25.0ha in central Nagasaki City; 107 over 49.4ha in Sasebo | Shows up less as high land prices (¥402,461/㎡) than as the scarcity of assembled sites. Stacking 13 storeys on a 2,442㎡ site becomes the realistic answer | In the capital, favour acquiring and renovating existing stock over new builds. Time spent assembling land slows the pace at which the ¥10,000–¥14,000 price-band void can be filled |
| Islands hold 14.7% of prefectural rooms 373 properties and 3,910 rooms across five municipalities, 10.5 rooms per property | Demand is strong at an average Obon early sell-out LT of 35.5 days, but investment scale is hard to assemble per deal. ADR of ¥7,539 is in line with the prefectural average | Favour multi-property acquisition and joint operation over single developments. Iki (ADR ¥8,003, N=17) and Shinkamigoto (¥8,304, N=7) rank relatively high |
| The airport is in Omura, not the capital The Omura Station area’s 2040 population decline is -8.9% (vs -19.1% around Nagasaki Station) | The airport itself has no trade area (831 employees), but population decline is the mildest in the prefecture and land is 3.8% of total investment. 61.8% of 2026’s new supply concentrates on this axis | Upper-grade limited-service. The gap between a 32.0-day early sell-out LT and ¥6,744 ADR is the largest opportunity |
Risk factors
| Category | Description | Quantitative basis in this article |
|---|---|---|
| Construction cost | Per-tsubo cost up 41%, from ¥1.38 million in 2022 to ¥1.952 million in 2025; ¥2.255 million per tsubo once inflation to opening is included | Land is only 3.8–9.2% of total investment while construction is over 90% |
| Demand (population) | Both the Nagasaki Station area and central Sasebo are projected to lose about a fifth of resident population by 2040 | Nagasaki Station area -19.1%, central Sasebo -20.1%, Omura Station area -8.9% |
| Supply | On top of 539 new rooms in 2026, 313 rooms enter the capital in the first half of 2027 | 313 rooms equal 3.5% of Nagasaki City’s existing 8,864 rooms |
| Natural disaster | Numerous steep-slope-collapse hazard zones in the hillside urban core; verification is essential during site selection | Central Nagasaki City 58 zones over 25.0ha; central Sasebo 107 zones over 49.4ha |
| Room for rate upside | The gap between the ADR needed for a 6% yield and prevailing rates is +27–36% | Unzen Kyushu Hotel (雲仙九州ホテル; 25 rooms, ADR ¥39,555) sold out at an average early sell-out LT of 44.2 days, so demand at higher rates does exist |
Conclusion
Nagasaki Prefecture’s lodging market splits into a hierarchy spanning 3.2x, from Unzen at ¥18,200 to Omura at ¥5,700. That hierarchy does not match the ranking of investment opportunity.
The lowest-rate cluster — airport and inland (Omura, Isahaya) — recorded an average early sell-out LT of 32.0 days across the four Obon days, among the fastest in the prefecture; it has the mildest population decline (-8.9% by 2040); and land costs just 3.8% of total investment. That 61.8% of 2026’s 539 new rooms concentrate on this axis is no coincidence.
The capital, Nagasaki City, has a ¥10,000–¥14,000 price-band void between business hotels at ¥8,000 and city hotels at ¥16,100, backed on the demand side by a workplace cluster of 33,371 employees and an estimated OCC of 86.1% (same basis as above). But the shortage of flat land bites less as “expensive land” than as “small sites,” so filling that band with new construction takes time. How the 313 rooms arriving in the first half of 2027 act on this band is the next thing to watch.
The largest finding overall is that land accounts for only 3.8–9.2% of total investment. What decides investment in Nagasaki is construction cost, not land price — which shows up in the three new-build cases stalling at 4.4–4.7% while acquiring and renovating existing stock reaches 10.9%. Total investment per room is ¥28.4–37.6 million for new builds against ¥13.0 million via existing stock. That a listed REIT acquired 91 rooms on the airport axis at ¥6.9 million per room supports the same direction.
Little flat land, a seventh of rooms on islands, and an airport outside the capital — these three conditions are constraints, but because they prevent other prefectures’ templates from being transplanted wholesale, they leave design room that favours local players.
Related reading
- Nagasaki Early Sep Booking Curves: 9/12 OCC 82.7%, Ryokan 24.2pt Gap
- Miyazaki & Saga Hotel Investment Whitespace: Zero Hotels at ¥18-25k
- Fukui’s 3 Hotel Clusters: 2.5x ADR Gap and the Upper-Mid Whitespace
- Hakodate Station Land +10.3%, Goryokaku Flat: 226 Hotels, 11,449 Rooms
- Niigata Hotel Investment Map: Niigata City, Yuzawa & Sado in 3 Layers
- Kagoshima’s Capital Is Its Cheapest: ADR ¥6,819 vs Kirishima ¥14,330
- Autumn on Japan’s Islands: 2.37x ADR Gap Across 10 Municipalities
- 226k Hotel Rooms in 32 Regional Cities: 42.7% Built Before 1996
References and Sources
■ Data sources
Estimated settled ADR is an estimated settled rate (tax-excluded equivalent) derived by applying a property-type correction coefficient to the lowest published plan level each property lists on OTAs (two guests per room, per-room, tax-included); area values are the median of the properties covered. Municipal figures average confirmed months only from August 2025 to July 2026 (estimates for future months are excluded from both averages and year-on-year figures; the 13 municipalities with N≥5 properties are shown). Prefecture-level figures use N=250–258 properties. Estimated occupancy (OCC) is derived from OTA sales inventory, at prefecture level for July 2026, with N=381 properties overall and N=115 for the business-hotel segment. Remaining-room movements cover actual check-in dates of 13–16 August 2026: of 800 properties in the prefecture, 232 have observation data and 161 have an OTA-published allocation of 30% or more, of which the 74 with ADR available are plotted. Land prices, land-use zoning and disaster hazard zones come from MLIT’s Real Estate Information Library; resident population from MLIT National Land Numerical Information (250m mesh future population projections, FY2024 NIPSSR-based estimates); employment from the Ministry of Internal Affairs and Communications and METI “Economic Census — Activity Survey.”
■ Estimate assumptions
Construction cost starts from 2025 actuals based on MLIT’s “Construction Starts Statistics” (¥1.952 million per tsubo, all-structure average) and is compounded to the 2028 midpoint at roughly +5% per year, assuming a 2029 opening with construction from 2027 to 2029 (+5.3% for 2026, +5.0% for 2027, and +4.5% assumed for 2028 onward as no forecast is published), giving the ¥2.255 million per tsubo used here. GOP margins are set at 32% for upper-mid, 40% for mid and 50% for limited-service — placed conservatively as first-year assumptions for a new opening, with reference to disclosed J-REIT GOP results (38.9% across 91 MHM-operated properties, fiscal period ended December 2024). Room revenue = ADR x rooms x 365 days x occupancy; yield = GOP ÷ total investment. Sensitivity is shown on one axis at ADR ±10% and occupancy ±5pt, and on two axes for case C across ADR ¥6,800–9,200 and occupancy 74–90%. Land cost is the average official commercial land price in each city centre x site area, and occupancy uses this article’s estimated OCC (as of July 2026).
■ Limitations and caveats
ADR and OCC are both estimates based on publicly available OTA information and differ from each property’s actual transacted prices, occupancy and accounting figures. Because OCC is estimated with OTA sales inventory as the denominator, it may diverge from actual conditions in areas where many properties rely heavily on direct booking (this article uses it only at the macro level of prefecture and municipality). Municipalities with N<5 (Saikai, Kawatana, Hasami, Nagayo, Togitsu) are excluded from the table, so not all 18 municipalities in the prefecture are covered. New openings are on an OTA-listing-confirmed basis, and because listings appear several months before opening, counts for the most recent months onward may rise. For plans from 2027 onward, public plan data based on building confirmation applications returned no entries for Nagasaki Prefecture, so only projects whose existence can be confirmed from primary sources are covered (this does not mean no plans exist). The development scenarios are simplified estimates and do not incorporate design, survey, financing or pre-opening costs, FF&E replacement, tax burden or borrowing terms. An actual investment decision requires a detailed feasibility study.
■ Market data
- MetroEngines Research & Consulting — estimated settled ADR (18 municipalities in Nagasaki Prefecture, confirmed-month basis, N=250–258 properties), estimated occupancy (OCC), property-level remaining-room movements (13–16 August 2026, 161 properties with an OTA-published allocation of 30% or more), room stock (1,108 properties, 26,615 rooms), new openings (OTA-listing-confirmed basis, 27 properties and 539 rooms in 2026)
■ Government statistics and public data
- MLIT Real Estate Information Library — official land price survey (commercial land; Nagasaki City N=18, Sasebo N=16, Isahaya N=6, Omura N=4; 2022–2026), city planning decisions (land-use zoning), disaster hazard zones
- MLIT National Land Numerical Information — 250m mesh future population projections (FY2024 NIPSSR-based estimates)
- Ministry of Internal Affairs and Communications & METI, “Economic Census — Activity Survey” (boundaries = Population Census small areas, e-Stat Statistical GIS)
- MLIT “Construction Starts Statistics” — hotel construction cost per tsubo by structure
- Nagasaki City, “Nagasaki Station Area Redevelopment Project”
■ REIT and industry reports
- Hoshino Resorts REIT (星野リゾート・リート投資法人) portfolio list — Comfort Inn Nagasaki Airport (91 rooms, acquisition price ¥630 million, acquired May 2014)
- Kasumigaseki Hotel REIT (霞ヶ関ホテルリート投資法人) portfolio list — FAV LUX Nagasaki
- Invincible Investment Corporation (インヴィンシブル投資法人) — GOP results (38.9% across 91 MHM-operated properties, fiscal period ended December 2024)
■ News and press releases
- “Hilton Garden Inn Nagasaki Chinatown, among the largest in the area at 313 rooms, scheduled to open in the first half of 2027” (Daiwa House Industry Co., Ltd. press release)
- Stadium City Hotel Nagasaki (Nagasaki Stadium City official site) — opened 14 October 2024, 243 rooms
- “FAV LUX Nagasaki, a new premium brand from FAV HOTEL, opens 1 February 2024” (Kasumigaseki Capital Co., Ltd. press release)
- archi-book, “Construction cost per tsubo, 2025 edition”