

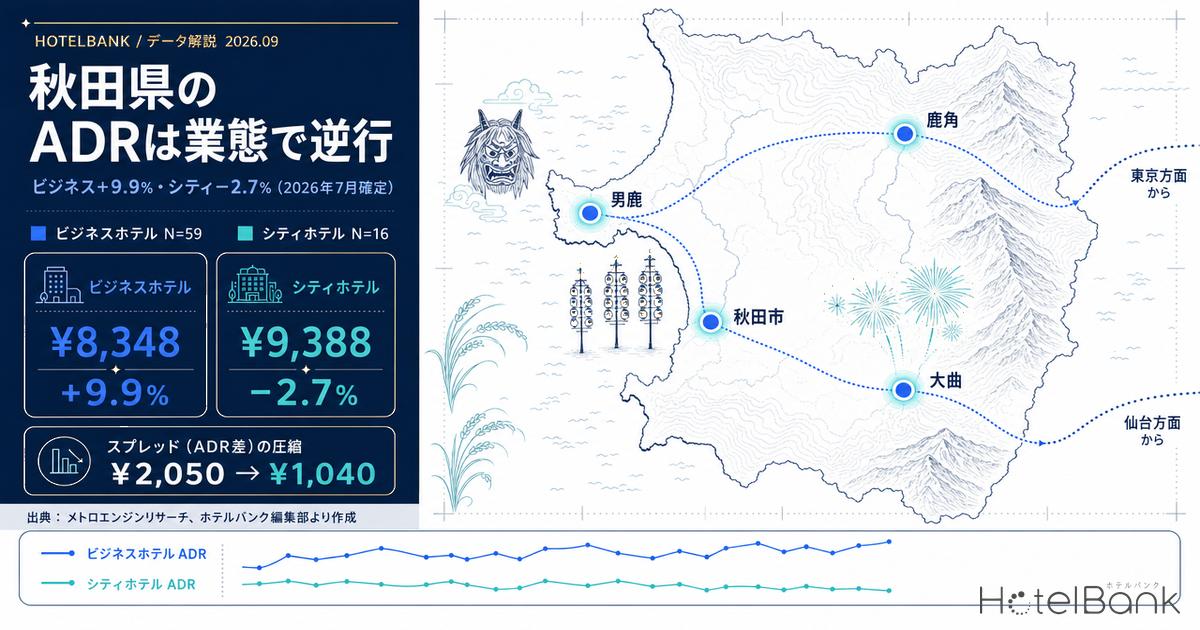
Akita Prefecture’s settled ADR estimates have moved in opposite directions by segment since the start of 2026. Business hotels beat the prior year every month from January through July — seven consecutive months — reaching ¥8,348 in July (vs ¥7,596 in July 2025 / +9.9%). City hotels, by contrast, were positive from January to April but flipped negative in May at −2.1%, followed by −1.2% in June and −2.7% in July (¥9,388 vs ¥9,646) — three straight months below the prior year. As a result, the July price gap between city and business hotels nearly halved, from ¥2,050 to ¥1,040. In the same prefecture and the same month, the higher-priced segment gave up rate while the lower-priced segment gained it. This article breaks down that divergence using year-on-year comparisons limited to finalized months, and sets out what it means for designing rates separately by segment.
Scope: Akita Prefecture business hotels N=59 properties (July 2026) and city hotels N=16 properties (July 2026). Price figures in this article are settled ADR estimates (the transacted price level estimated from OTA and other sales data, tax-exclusive equivalent); occupancy is an estimate based on OTA-published inventory. Both definitions appear at the end of the article. Data as of September 3, 2026.
- — Business +9.9% / City −2.7% — finalized settled ADR estimates for July 2026 show the higher-priced segment falling and the lower-priced segment rising, in the same prefecture and the same month.
- — The segment price gap nearly halved, from ¥2,050 to ¥1,040 (a ratio of 1.27x down to 1.12x). The step between price tiers is half as tall as it was a year ago.
- — The signs diverge over the last three months — combining May to July, business is +6.2% and city is −2.0%. A single prefecture-wide number does not work as a yardstick for your own property.
- — Estimated OCC is trending up in both segments (April 86.1% / 86.8% → August 92.0% / 93.9%). “We couldn’t fill rooms” is a hard explanation for the city-hotel rate decline.
- — City hotels are a small sample of N=15–16. Read −2.7% as a shift in the sample median, not as an across-the-board rate cut in the prefecture.
Business hotels: seven straight positive months. City hotels flipped in May
Start with business hotels. Settled ADR estimates for January through July 2026 beat the prior-year month in every single month: January +6.4% (¥6,853 vs ¥6,442), February +1.9%, March +4.5%, April +4.5%, May +5.3%, June +3.3% and July +9.9%. Comparing the combined January–July level gives +5.2%. What stands out is that the growth did not fade in the back half of the period — it accelerated from May onward. The combined January–April figure was +4.3%, while May–July came in at +6.2%, a wider margin. Sample sizes are stable — 52 to 57 properties in 2025 against 57 to 61 in 2026 — so this is not a gap that sample turnover can explain.
Source: MetroEngines Research; compiled by the HotelBank Editorial Team
Viewed as year-over-year overlays, the 2026 line for business hotels runs above the 2025 line almost continuously from March onward. The shape of the year itself — a trough in December, a peak in July and August — has not changed across the three years; what has changed is the level. Summer peak rates worked out to ¥6,805 in July 2024 → ¥7,596 in July 2025 → ¥8,348 in July 2026, a lift of more than ¥1,500 in two years.
City hotels, by contrast, look different in the first half of the year than in the second. January +7.4% (¥8,744 vs ¥8,142), February +1.9%, March +9.9% (¥8,937 vs ¥8,131) and April +3.3% — January through April was clearly positive, and the combined +5.5% outpaced business hotels. Then came May −2.1% (¥9,312 vs ¥9,509), June −1.2% (¥9,058 vs ¥9,168) and July −2.7% (¥9,388 vs ¥9,646): three consecutive months below the prior year, with the May–July combination sinking to −2.0%. Smoothed across January to July the figure is +2.1%, but that average rests on the surplus built up in the first half and does not represent the recent trend.
Source: MetroEngines Research; compiled by the HotelBank Editorial Team
One caveat to hold onto here: the city-hotel sample is small, at N=15–16 properties. Akita Prefecture has only a limited number of city hotels in total, and a rate-design change at a single property can move the prefectural average by a few percent. So “−2.7%” does not mean the prefecture’s city-hotel market cut rates uniformly; the correct reading is that the median of the sample shifted in that direction. Please keep that qualifier attached throughout — this figure should not be treated with the same confidence as the business-hotel side (N=57–61). To put a number on the sensitivity: in an average of 16 properties, one property moving its monthly average rate by ¥1,000 shifts the average by roughly ¥63 (about 0.7% against ¥9,388). July’s −2.7% (−¥258) is the same magnitude as roughly four of those 16 properties cutting by about ¥1,000. That is not a swing that implies broad rate cutting across the prefecture. The same kind of segment divergence has been observed in a neighboring prefecture: Yamagata ADR Splits by Segment: Business −4.8% in April, City +12.5% examines how to read year-on-year figures for small-sample segments using another prefecture’s data. Even so, the fact that the same sign has appeared three months running — May, June and July — is worth treating as distinct from single-month noise.
| Stay month | Business 2025 |
Business 2026 |
YoY | City 2025 |
City 2026 |
YoY | Price gap 2025→2026 |
|---|---|---|---|---|---|---|---|
| January | ¥6,442 | ¥6,853 | +6.4% | ¥8,142 | ¥8,744 | +7.4% | ¥1,700 → ¥1,891 |
| February | ¥6,765 | ¥6,893 | +1.9% | ¥8,439 | ¥8,598 | +1.9% | ¥1,674 → ¥1,705 |
| March | ¥6,418 | ¥6,707 | +4.5% | ¥8,131 | ¥8,937 | +9.9% | ¥1,713 → ¥2,230 |
| April | ¥6,801 | ¥7,108 | +4.5% | ¥9,027 | ¥9,327 | +3.3% | ¥2,226 → ¥2,219 |
| May | ¥7,152 | ¥7,529 | +5.3% | ¥9,509 | ¥9,312 | −2.1% | ¥2,357 → ¥1,783 |
| June | ¥7,103 | ¥7,337 | +3.3% | ¥9,168 | ¥9,058 | −1.2% | ¥2,065 → ¥1,721 |
| July | ¥7,596 | ¥8,348 | +9.9% | ¥9,646 | ¥9,388 | −2.7% | ¥2,050 → ¥1,040 |
| Jan–Jul combined | — | — | +5.2% | — | — | +2.1% | — |
N = business hotels 52–57 properties in 2025 / 57–61 in 2026; city hotels 14–16 properties in 2025 / 15–16 in 2026. All comparisons are between finalized values (past months). Source: MetroEngines Research; compiled by the HotelBank Editorial Team
Note that stay months from August 2026 onward are estimates based on current sales conditions, and rest on a different basis than finalized values. Every year-on-year figure in this article is limited to finalized month against finalized month; levels from August onward are not placed alongside prior-year finalized values. To assess how August and September land, the right approach is to wait for each month to close and compare finalized figures.
The gap between segments halved in July
Lining up the year-on-year signs alone makes this look like a coarse story of “business strong, city weak.” What matters operationally is the distance between the two. In July 2025, the settled ADR estimate for Akita’s city hotels sat ¥2,050 above business hotels (¥9,646 vs ¥7,596, a ratio of 1.27x). By July 2026 that gap had narrowed to ¥1,040 (¥9,388 vs ¥8,348, a ratio of 1.12x). In one year, the step between price tiers became half as tall.
Source: MetroEngines Research; compiled by the HotelBank Editorial Team
The narrowing did not happen abruptly in July. Following the rightmost column of the table, the gap actually widened in March, from ¥1,713 to ¥2,230, held flat in April, and then closed over three months: ¥1,783 in May, ¥1,721 in June and ¥1,040 in July. In other words, “city hotels flipped in May” and “the gap closed” are two sides of the same phenomenon — it happened because the city side alone stalled while the business side kept climbing.
What this configuration suggests is a price ceiling facing Akita’s city hotels. Once business hotels reach ¥8,348 in July, the “value explained by the difference” when a city hotel sells at around ¥9,400 is compressed to roughly ¥1,000. The closer relative prices get within the same area, the more directly the higher-priced segment is compared against the lower-priced segment’s inventory. Conversely, this is also a phase in which the business segment has gained headroom on the upside. Segment spreads compressing within a year is not unique to Akita; the same configuration can be seen in Shimane July ADR: City Hotels −8.2%, Business +1.5%, Spread Halves.
On the demand side, estimated OCC is trending up in both segments
To check the backdrop to those rate moves, look at estimated OCC (based on OTA-published inventory) over the same period. By definition this indicator runs higher than actual room occupancy, and because we do not run year-on-year comparisons on this source, it serves only to confirm levels and shape within 2026.
| Stay month (2026, actual) | Business estimated OCC | City estimated OCC |
|---|---|---|
| April | 86.1% | 86.8% |
| May | 86.9% | 88.2% |
| June | 90.1% | 90.2% |
| July | 91.5% | 93.2% |
| August | 92.0% | 93.9% |
Monthly average estimated OCC (based on OTA-published inventory). Observed properties: 50–53 business hotels, 14–15 city hotels. Source: MetroEngines Research; compiled by the HotelBank Editorial Team
From April through August, estimated OCC stepped up consistently in both segments. In July and August, city hotels (93.2% and 93.9%) sat above business hotels (91.5% and 92.0%). This is not the shape of city-hotel inventory sitting unsold during May–July, the months when rates fell below the prior year. Since we do not take year-on-year comparisons from this source, causation cannot be asserted — but it is worth pointing out that the simple story of “occupancy wasn’t there, so we cut rates” is hard to sustain. It is more natural to read this as inventory clearing perfectly well while the approach to price positioning changed from the prior year.
Looking day by day, the highest estimated OCC readings in August 2026 cluster clearly on event dates. During the Akita Kanto Festival (held August 3–6), business hotels ran 98.0% / 98.1% / 97.4% / 96.6% and city hotels 98.1% / 98.6% / 97.9% / 97.5% — above 96% on every day. On Saturday, August 29, when the National Fireworks Competition “Omagari no Hanabi” was held, business hotels hit 98.0% and city hotels 98.2%; even an ordinary Saturday like August 8 was high, at 98.7% for business and 97.5% for city. By day of week, August business averages were highest on Tuesday (95.6%), Wednesday (95.5%) and Thursday (95.0%), and lowest on Sunday (84.9%); city hotels were highest on Tuesday (96.3%) and Thursday (95.6%) and lowest on Sunday (89.9%). Summer in Akita builds high occupancy from midweek business demand overlapping with weekend and event demand. On how inventory for an event date disappears across the lead-time curve, Omagari Fireworks: Akita 97.8% OCC 45 Days Out, Only 2.2pt Headroom (stay date August 29, 2026; estimated OCC at the 45-days-out mark) tracks the daily build-up.
It is also worth checking recent booking pace (based on observations from 45 days before the stay date through the most recent reading). Lining up Saturdays in September and October along with Respect for the Aged Day (Monday, September 21) gives the following.
| Stay date | Business 45 days out |
Business 30 days out |
Business latest |
City 45 days out |
City 30 days out |
City latest |
|---|---|---|---|---|---|---|
| Sep 12 (Sat) | 80.2% | 85.0% | 90.4% | 79.0% | 80.7% | 91.8% |
| Sep 19 (Sat) | 86.5% | 92.6% | 97.1% | 85.1% | 92.0% | 97.6% |
| Sep 21 (Mon, holiday) | 83.3% | 90.7% | 96.0% | 87.1% | 93.7% | 97.3% |
| Sep 26 (Sat) | 93.6% | 97.4% | 98.1% | 97.1% | 99.5% | 98.6% |
| Oct 3 (Sat) | 92.0% | — | 95.7% | 92.2% | — | 93.3% |
| Oct 10 (Sat) | 85.9% | — | 88.9% | 87.8% | — | 87.3% |
| Oct 17 (Sat) | 82.4% | — | 82.4% | 83.7% | — | 83.7% |
Estimated OCC (based on OTA-published inventory). Based on observations from 45 days before the stay date through the most recent reading. “—” means that checkpoint falls outside the observation window and was not observed. Observed properties: 52–53 business hotels, 15 city hotels. Data as of September 3, 2026. Source: MetroEngines Research; compiled by the HotelBank Editorial Team
Saturday, September 26 stands out: 93.6% for business and 97.1% for city at 45 days out, with city reaching 99.5% by 30 days out. Given that the other Saturdays sit in the low-to-high 80s at 45 days out, a distinctly different layer of demand is riding on that date. Saturday, October 17, meanwhile, was at 82.4% / 83.7% at 45 days out — a start close to a September Saturday at a comparable level (September 12). Saturdays from mid-October onward have only just entered the observation window, and how they build from here is still to be determined.
For revenue managers running business and city hotels in Akita — implications and an action plan
(1) Separate “the market is up / the market is down” by your own segment. For January–July 2026, Akita was +5.2% for business and +2.1% for city (combined basis) — lumping the whole prefecture together erases what is actually happening. Over the last three months in particular, the signs are opposite: business +6.2%, city −2.0%. When you assess your own year-on-year performance, if you do not fix the comparison set to “the same segment” rather than “the prefecture as a whole,” a business-segment property will mistake market-level growth for strong performance, while a city-segment property will mistake outperformance for a slump.
(2) The ¥1,040 segment gap is the current yardstick for relative position. As of July 2026, the settled ADR estimate gap between city and business hotels had narrowed to ¥1,040, a ratio of 1.12x (from ¥2,050 and 1.27x a year earlier). If you operate in the city segment, check where your own pricing sits within that gap. In a market where the difference is compressed to around ¥1,000, a higher-priced segment’s premium can no longer be explained by room size alone — the question becomes whether you can make the contents of that difference visible: breakfast, late checkout, in-house facilities. For the business segment, the reverse holds: if your property has not reached the market business level of ¥8,348 (July), now — with the distance to the higher segment compressed — is a phase in which testing the upside is relatively easy.
(3) The seasonal shape has not changed in three years — only the level has. For both business and city hotels, the pattern of a peak in July–August and a trough in November–December is common to 2024, 2025 and 2026. That means the “when to move” part of your rate calendar can stay as it is; what needs revisiting is “where to set it.” In the business segment, where summer peak rates stepped up from ¥6,805 in July 2024 to ¥8,348 in July 2026, leaving next summer’s benchmark at last year’s actuals would leave you a year behind the market’s step-up.
(4) Occupancy is there. Rule out the possibility that the decline is a pricing-side decision first. Estimated OCC rose from 86.1% (business) and 86.8% (city) in April to 92.0% and 93.9% in August, and even during May–July, when city hotels gave up rate, there is no sign at the level of these figures that inventory stopped clearing. If your own property is posting a negative year-on-year figure, before building a response on the assumption of weak demand, first audit the routes by which you are cutting your own rates: the floor on automated discounting rules on OTAs and elsewhere, the scope of long-stay discounts, and corporate or group rates that were never revisited.
With that in mind, here is an action plan organized by time horizon. None of these guarantee results; they are inputs to consider alongside your own booking position.
| Horizon | Action | Decision trigger | Objective |
|---|---|---|---|
| Today–this week | Re-align your property’s Jan–Jul 2026 ADR against same-segment year-on-year figures | When a business-segment property’s year-on-year figure is clearly below the market’s +5.2% (Jan–Jul combined) | Replace “market level” as a benchmark, from the whole prefecture to the same segment |
| Today–this week | Check whether remaining inventory on high-pace late-September dates is still flowing out at the floor rate | When, on a date like Saturday September 26 where the market reaches the high 90s at 45 days out, your property alone is holding inventory at standard rates | Correct pricing that leaves money on the table on the heaviest demand dates, early |
| Within two weeks | Take stock of the floor values and application conditions of automated discounting rules | When a city-segment property is negative year on year while running occupancy close to the market level of estimated OCC (the 93% range in July–August) | Identify the routes by which you are cutting rates yourself, rather than a shortfall in occupancy |
| Within two weeks | Review whether the higher segment’s added value (breakfast, late checkout and so on) is presented as the price difference | When your property’s premium over the business segment is well above the market’s ¥1,040 (July 2026) | Make the basis for the difference explicit within a shortened price ladder |
| Looking to next month | Build Saturdays from mid-October onward while checking against the market level at the 45-days-out checkpoint | When your property sits below the market’s 82.4% / 83.7% start at 45 days out for Saturday, October 17 | Manage the autumn weekend build-up against a market benchmark |
| Looking to next month | Design summer 2027 benchmark rates around the two-year step-up, not last year’s actuals | When a business-segment property’s assumed rate for next summer is set below the July 2026 market level of ¥8,348 | Leave the seasonal shape in place and update only the level |
Source: MetroEngines Research; compiled by the HotelBank Editorial Team
Summary — three yardsticks to take away from Akita in 2026
The first yardstick is segment-level year-on-year. On finalized values for January–July 2026, Akita was business +5.2% and city +2.1% (combined). Narrowing to the last three months, the signs split: business +6.2%, city −2.0%. In this phase, a single prefecture-wide number does not work as a yardstick for your own property.
The second yardstick is the ¥1,040 gap between segments. It halved from ¥2,050 in July 2025. In a market where the price ladder has flattened, the higher segment carries a heavier burden to explain what the difference buys, while the lower segment gains headroom on the upside. Measure your relative position within that gap.
The third yardstick is that the shape stays fixed while only the level moves. Overlay three years and the pattern — a peak in July–August, a trough in November–December — is unchanged; only the height moves. Keep the revision calendar and update only the benchmark each year: that is the operating model Akita’s three years of data point to.
About the data
- Definition of estimated OCC (based on OTA-published inventory): OTA-published-inventory occupancy = 100 − 100 × rooms remaining on OTAs ÷ total rooms. It is an estimate based on how inventory sold on OTAs is clearing, and is defined differently from actual room occupancy (it runs higher). The scope of this article is business and city hotels in Akita Prefecture, covering April–August 2026 (monthly actuals) and individual stay dates in September–October 2026.
- Booking curve: Based on observations from 45 days before the stay date through the most recent reading.
- Definition of settled ADR estimate: The transacted price level (tax-exclusive equivalent) estimated from OTA and other sales data (lowest-plan level × segment-specific coefficient, as an ensemble across multiple channels). Past months are finalized values; current and future months are estimates based on current sales conditions. Median error against published operating results is 6.6%. All year-on-year comparisons in this article are between finalized values (Jan–Jul 2025 vs Jan–Jul 2026); estimates from August 2026 onward are not used in comparisons.
- Breakdown of N: Settled ADR estimates — business hotels 52–57 properties in 2025 / 57–61 in 2026 (59 in July 2026); city hotels 14–16 properties in 2025 / 15–16 in 2026 (16 in July 2026). Estimated OCC — business hotels 50–53 properties, city hotels 14–15 properties. Note that the city-hotel sample is small, so rate changes at a few properties have a relatively large effect on the prefectural average.
- Data as of September 3, 2026. Sales conditions and inventory change daily, so the figures in this article are a snapshot as of the time of retrieval.
References and sources
■ Data sources
Monthly settled ADR estimates for business and city hotels in Akita Prefecture (January 2025 – July 2026, finalized months), monthly average estimated OCC for the same prefecture (April–August 2026), and booking pace by stay date (September–October 2026). All figures are aggregated data from MetroEngines Research & Consulting, re-retrieved and compiled by the HotelBank Editorial Team. Event dates were confirmed on each organizer’s official site.
■ Calculation assumptions
Year-on-year comparisons are limited to finalized month against finalized month (Jan–Jul 2025 vs Jan–Jul 2026); stay months from August 2026 onward, which are estimates based on current sales conditions, are not used in comparisons. Combined year-on-year figures compare levels across the full period rather than averaging monthly year-on-year figures. The segment price gap is calculated as city minus business for the same month on the same aggregation basis. Estimated OCC is not compared year on year from the same source, and is used only to confirm levels and shape within 2026.
■ Limitations and caveats
The city-hotel sample is small at N=15–16, so rate changes at a few properties can move the prefectural average by several percent. It cannot be treated with the same confidence as business hotels (N=57–61). Estimated OCC is an estimate based on OTA-published inventory and is defined so as to run higher than actual room occupancy. Settled ADR estimates carry a median error of 6.6% against published operating results and will not match any individual property’s actuals. This article is intended to convey market levels and does not guarantee the effect of any particular rate revision.
- Akita Kanto Festival official site (confirmation of dates)
- National Fireworks Competition “Omagari no Hanabi” official site — event overview (confirmation of the August 29, 2026 date)
- Akita City tourism and event information portal, Akitatch+ (confirmation of event dates in the prefecture)
Related reading
- Omagari Fireworks: Akita 97.8% OCC 45 Days Out, Only 2.2pt Headroom
- 94.5% Sold 45 Days Out: Omagari Fireworks vs a Normal Akita Weekend
- Yamagata ADR Splits by Segment: Business −4.8% in April, City +12.5%
- Aomori Settled ADR July 2026: Ryokan +19.1%, Business Hotels +0.6%
- Iwate Settled ADR H1 2026: Business −3.2% in June, City +4.3%
- Shimane July ADR: City Hotels −8.2%, Business +1.5%, Spread Halves
- North Tohoku’s 2,079 New Rooms: Which Segments Can Absorb the Supply