

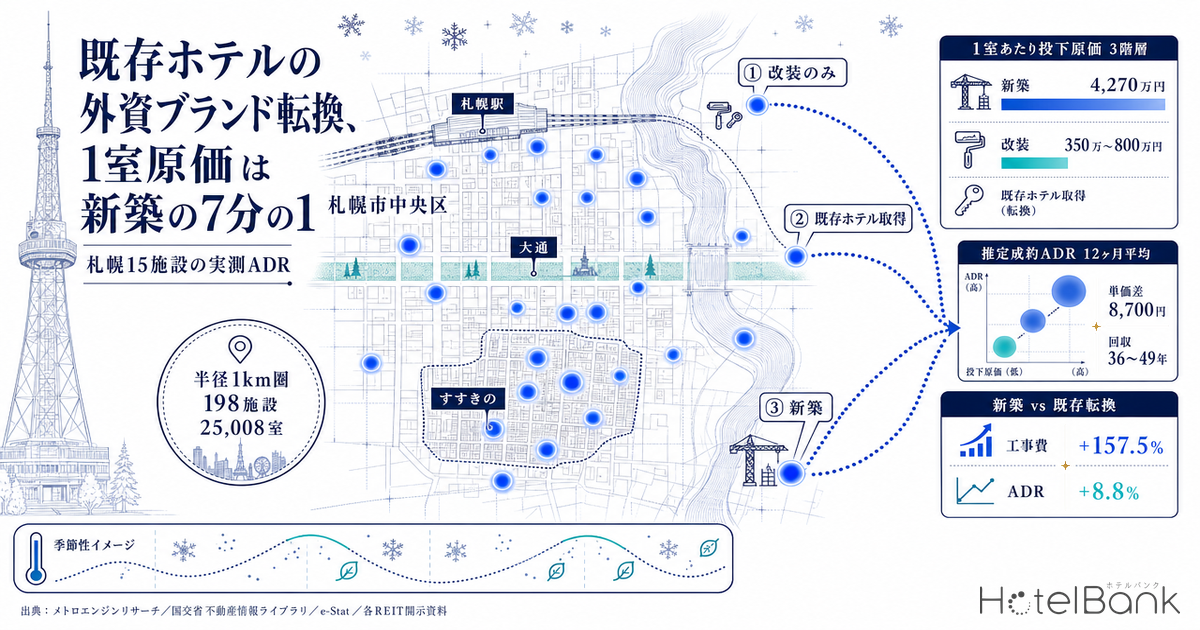
Converting an existing hotel to an international brand and building one from the ground up may both produce the same “internationally branded guest room,” but the capital required differs by an order of magnitude. Set side by side using measured data from Chuo Ward, Sapporo, the invested cost per room is roughly ¥42.7 million for new construction versus ¥3.5–8.0 million for a renovation conversion of stock a company already owns. The gap in achieved room rate between the two is just ¥8,700 on a monthly average. This article quantifies that asymmetry using four measured data series: estimated settled ADR, actual J-REIT acquisition prices, construction starts statistics, and published land prices.
Metric Definitions Used in This Article
- ADR (Average Daily Rate): An estimated settled rate (tax-exclusive equivalent) calculated by applying a segment-specific adjustment factor to the lowest published plan level each property lists on OTAs (double occupancy, per-room rate, tax-inclusive). Cross-checked against property-level results disclosed by listed hotel REITs (91 properties, most recent three months), the median error is approximately 7%. These are estimates and differ from each property’s actual transacted prices and accounting figures. Area-level ADR is the median of the target properties (the level of a typical property in the area).
- OCC (Occupancy Rate): The share of sold rooms against total rooms in the area (an estimate based on OTA sales inventory). Used only as a macro indicator at the prefecture and municipality level; not applied to individual properties.
- Data Sources: MetroEngines Research (pricing and supply), Ministry of Land, Infrastructure, Transport and Tourism Real Estate Information Library (published land prices, zoning), e-Stat (Building Construction Starts Statistics), and REIT disclosure documents
- — The median estimated settled ADR in Chuo Ward, Sapporo rose +8.8% year on year for January–July 2026 (¥14,513 / N=134–137 properties). The market as a whole is in an upward phase.
- — Lining up the ward’s 15 major properties (5,246 rooms combined) by opening year shows no positive correlation between building age and achieved rate. A property opened in 1934 comes in about ¥7,800 above one opened in 2012.
- — Invested cost per room splits into three tiers: renovation only ¥3.5–8.0 million / existing hotel acquisition ¥29.41 million (median of 11 Sapporo properties) / new build ¥42.7 million (modeled)。
- — The achieved rate gap between new build and conversion averages ¥8,700 over 12 months. Recovering the cost difference takes 23 years even under the assumptions most favorable to new construction.
- — Construction cost for lodging-use buildings in Hokkaido rose from ¥862,000 per tsubo in 2017 to ¥2.218 million per tsubo in 2024 (+157.5%). The entry barrier for new construction is lifting the relative value of existing stock.
The Market Backdrop — ADR in Chuo Ward, Sapporo Is Up 8.8% Year on Year
As a foundation for any investment judgment, it is worth first confirming the level of the market itself. According to MetroEngines Research data, the median estimated settled ADR in Chuo Ward, Sapporo (the level of a typical property in the area) averaged ¥14,500 over the seven months from January to July 2026, against ¥13,300 in the same period a year earlier — up 8.8%. The sample is N=134–137 properties, and month-to-month variation is small.
On a monthly basis, a jump to ¥20,600 in February shows up three years running. The winter demand season that includes the Sapporo Snow Festival forms this market’s annual peak. The trough is April, at ¥8,600 in 2026. The peak-to-trough ratio reaches 2.4x, which is wide for an urban market. In designing full-year returns, how to absorb this seasonal structure sits at the core of the investment case.
Source: MetroEngines Research; compiled by the HotelBank Editorial Team (Chuo Ward, Sapporo, N=129–137 properties)
The depth of demand is worth noting as well. Also by MetroEngines Research estimates, occupancy for Hokkaido’s 73 city hotels / 15,807 rooms in July 2026 (an estimate based on OTA sales inventory) was 93.6%. June was 90.8% across 74 properties / 15,884 rooms, so summer demand is holding at a high level. The cost comparison below should be read in the context of a supply decision made while the market is tight.
Building Age Does Not Set the Rate — 15 Properties, 5,246 Rooms in Chuo Ward
Whether a conversion investment works comes down to a single question: can an older building still reach a high rate? To test this, we extracted 15 hotels with 240 or more rooms located in the core of Chuo Ward, Sapporo (within a 1 km radius) and lined up their 12-month average estimated settled ADR from August 2025 to July 2026 by opening year. The set totals 5,246 rooms.
| Opening year | Property | Rooms | 12-month avg. estimated settled ADR | Market median = 100 |
|---|---|---|---|---|
| 1934 | Sapporo Grand Hotel (札幌グランドホテル) | 504 | ¥22,800 | 156 |
| 1974 | ANA Crowne Plaza Sapporo (ANAクラウンプラザホテル札幌) | 412 | ¥26,800 | 184 |
| 1980 | Sapporo Tokyu REI Hotel (札幌東急REIホテル) | 575 | ¥17,900 | 123 |
| 1982 | New Otani Inn Sapporo (ニューオータニイン札幌) | 340 | ¥17,400 | 119 |
| 1991 | Premier Hotel -TSUBAKI- Sapporo (プレミアホテル-TSUBAKI-札幌) | 322 | ¥22,200 | 152 |
| 1994 Brand conversion 2020 | Fairfield by Marriott Sapporo (フェアフィールド・バイ・マリオット札幌) | 254 | ¥22,900 | 157 |
| 1998 | Hotel MyStays Premier Sapporo Park (ホテルマイステイズプレミア札幌パーク) | 419 | ¥17,200 | 118 |
| 2008 | Hotel Resol Trinity Sapporo (ホテルリソルトリニティ札幌) | 305 | ¥15,900 | 109 |
| 2009 | Mercure Hotel Sapporo (メルキュールホテル札幌) | 285 | ¥19,500 | 134 |
| 2010 | Ibis Styles Sapporo (イビススタイルズ札幌) | 278 | ¥15,200 | 104 |
| 2012 | Daiwa Roynet Hotel Sapporo Susukino (ダイワロイネットホテル札幌すすきの) | 240 | ¥15,000 | 103 |
| 2021 | Susukino Granbell Hotel (すすきのグランベルホテル) | 300 | ¥20,400 | 140 |
| 2023 | Via Inn Prime Sapporo Odori (ヴィアインプライム札幌大通) | 255 | ¥16,600 | 114 |
| 2024 | SAPPORO STREAM HOTEL | 436 | ¥38,500 | 264 |
| 2024 | Courtyard by Marriott Sapporo (コートヤード・バイ・マリオット札幌) | 321 | ¥31,600 | 216 |
Source: MetroEngines Research; compiled by the HotelBank Editorial Team (12-month average, August 2025–July 2026, N=15 properties / 5,246 rooms; the market median is the ¥14,600 same-period average for Chuo Ward, Sapporo)
What this table shows is that there is no simple positive correlation between opening year and achieved rate. Sapporo Grand Hotel, opened in 1934, sits at ¥22,800 — about ¥7,800 above Daiwa Roynet Hotel Sapporo Susukino (¥15,000), opened in 2012. ANA Crowne Plaza Sapporo, opened in 1974, is at ¥26,800, higher than Via Inn Prime Sapporo Odori (¥16,600), opened in 2023. Grouped by opening era, the seven properties opened before 1999 (2,826 rooms) median ¥22,200 against ¥16,300 for the six opened between 2000 and 2023 (1,663 rooms) — the older generation actually comes out on top.
This does not mean newness carries no value. It means that within the same city center and the same trade area, what sets the rate a property reaches is the positioning of its brand and room specification, not the year of completion itself. Fairfield by Marriott Sapporo — which kept the 1994 structure as-is and swapped out the interior and the brand — standing at ¥22,900 (1.57x the market median) is the clearest illustration of this structure.
Source: MetroEngines Research; compiled by the HotelBank Editorial Team (circle size = number of rooms, N=15 properties)
The two properties opened in 2024 are clearly in a different band, however. SAPPORO STREAM HOTEL is at ¥38,500 and Courtyard by Marriott Sapporo at ¥31,600 — 2.2 to 2.6 times the market median. The room sizes, specification levels, and brand design of recent new builds are engineered to reach a ceiling rate that renovating existing stock struggles to touch. The two therefore coexist as a division of labor across price bands rather than as direct competitors.
The Monthly Ladder: New Build vs. Conversion — a 12-Month Average Gap of ¥8,700
To see how stable that division of labor is, we look at it monthly. Three series — a new-build international brand (Courtyard by Marriott Sapporo), a brand conversion of an existing building (Fairfield by Marriott Sapporo), and the market median — are overlaid across the 12 months from August 2025.
Source: MetroEngines Research; compiled by the HotelBank Editorial Team (market median is N=130–137 properties)
Across the 12 months, the three lines almost never cross. On a 12-month average, the new-build international brand is at ¥31,600, the conversion at ¥22,900, and the market median at ¥14,600. The gap between new build and conversion is ¥8,700. Indexed to the market median, new build sits at 216 and the conversion at 157.
The month-to-month range differs between them. Even as the market as a whole lifts, the conversion’s index moves across a band from 98 to 196, which reads as pricing being run flexibly against the monthly shape of demand. That matters to investors: a converted asset tracks the market rate more closely than a new build does. It can chase the upside when the market is rising, and it has room to price toward the market and turn rooms in thin months.
Three Tiers of Cost per Room — ¥5.75M Renovation, ¥29.41M Acquisition, ¥42.7M New Build
This is the heart of the investment question. Granted a ¥8,700 gap in achieved rate, how much must be paid to obtain it? Using Chuo Ward, Sapporo as the setting, we build up the per-room cost of three acquisition routes.
Tier 3: New construction.Starting from a site, land price bites first. According to published land price data from the MLIT Real Estate Information Library, the commercial standard sites around this area have moved as follows.
| Standard site | Nearest station / distance | Floor area ratio | 2024 | 2025 | 2026 | 2-year change |
|---|---|---|---|---|---|---|
| Sapporo Chuo 5-1 | Odori 0m | 800% | ¥6,550,000 | ¥6,950,000 | ¥7,440,000 | +13.6% |
| Sapporo Chuo 5-12 | Odori 260m | 800% | ¥2,300,000 | ¥2,600,000 | ¥2,860,000 | +24.3% |
| Sapporo Chuo 5-2 | Susukino 200m | 800% | ¥1,500,000 | ¥1,800,000 | ¥2,160,000 | +44.0% |
| Sapporo Chuo 5-21 | Susukino 300m | 800% | ¥773,000 | ¥925,000 | ¥1,100,000 | +42.3% |
| Sapporo Chuo 5-20 | Hosui-Susukino 350m | 600% | ¥575,000 | ¥609,000 | ¥640,000 | +11.3% |
Source: MLIT Real Estate Information Library (published land prices, commercial land); compiled by the HotelBank Editorial Team
That two points 200–300 m from Susukino Station show gains of over 40% in two years should not be overlooked. Zoning across these blocks is commercial in every case, with a building coverage ratio of 80% and floor area ratios of 400–800% designated across the nine surrounding parcels (per the same library’s zoning data).
Construction costs are moving further still. Extracting lodging-use buildings in Hokkaido by year from e-Stat’s Building Construction Starts Statistics and dividing planned construction cost by floor area gives the following unit costs.
Source: e-Stat “Building Construction Starts Statistics” (Statistics ID: 0003114490 / Hokkaido, lodging use); compiled by the HotelBank Editorial Team
¥260,600 per square meter in 2017 (¥862,000 per tsubo) became ¥671,100 per square meter in 2024 (¥2.218 million per tsubo) — a rise of +157.5% over seven years. The national average that year was ¥1.955 million per tsubo, so Hokkaido runs 13.5% above it. Starts in 2024 numbered 207 buildings across 191,797 square meters, a substantial count in itself, so the rise in unit cost is not an artifact of thinning construction starts.
On this basis we model a new build. A 1,000 square meter site at a floor area ratio of 800% gives 8,000 square meters of gross floor area. Land is valued at ¥1,100,000 per square meter, the 2026 published price for Sapporo Chuo 5-21, for ¥1.10 billion. Construction cost is set at ¥775,400 per square meter — the 2024 actual of ¥671,100 per square meter with three years of price escalation from start to completion (+4.5% to +5.3% per year) built in — for ¥6.20 billion. Total investment is ¥7.30 billion. At a guest room area ratio of 60% and 28 square meters per room, 171 rooms can be taken, which works out to ¥42.7 million per room.
Tier 2: Acquiring an existing hotel.Where the play is to buy an operating hotel rather than start from raw land and place a brand on it, the going rate can be read from J-REIT disclosures. Dividing acquisition price by room count for the 11 acquired properties in Sapporo registered in the ownership master (as of August 2026) gives the following.
| Property | Rooms | Acquisition date | Acquisition price | Per room |
|---|---|---|---|---|
| Hotel MyStays Sapporo Aspen (ホテルマイステイズ札幌アスペン) | 305 | July 2019 | ¥15,543 million | ¥50.96 million |
| La’gent Stay Sapporo Odori (ラ・ジェント・ステイ札幌大通) | 219 | June 2016 | ¥10,020 million | ¥45.75 million |
| Hotel MyStays Premier Sapporo Park (ホテルマイステイズプレミア札幌パーク) | 419 | August 2018 | ¥16,731 million | ¥39.93 million |
| THE KNOT SAPPORO | 140 | August 2023 | ¥4,900 million | ¥35.00 million |
| Hotel MyStays Sapporo Station North Exit (ホテルマイステイズ札幌駅北口) | 242 | October 2017 | ¥7,880 million | ¥32.56 million |
| Hotel MyStays Sapporo Susukino (ホテルマイステイズ札幌すすきの) (equal to the median of the 11 properties) | 104 | July 2019 | ¥3,059 million | ¥29.41 million |
| Hotel MyStays Sapporo Nakajima Park (ホテルマイステイズ札幌中島公園) | 86 | July 2019 | ¥2,118 million | ¥24.63 million |
| Ibis Styles Sapporo (イビススタイルズ札幌) | 278 | July 2010 | ¥6,797 million | ¥24.45 million |
| Mercure Sapporo (メルキュール札幌) | 285 | April 2009 | ¥6,000 million | ¥21.05 million |
| Hotel MyStays Sapporo Nakajima Park Annex (ホテルマイステイズ札幌中島公園別館) | 80 | July 2019 | ¥1,584 million | ¥19.80 million |
| Nest Hotel Sapporo Odori (ネストホテル札幌大通) | 121 | November 2015 | ¥1,450 million | ¥11.98 million |
Source: REIT disclosure documents and the ownership master (as of August 2026, N=11 properties); compiled by the HotelBank Editorial Team. Note: acquisition prices are the amounts at each acquisition date and do not indicate current asset value.
The median acquisition price per room across the 11 properties is ¥29.41 million. Because acquisition years span 2009 to 2023 this is not a straightforward present value, but it lands at roughly 70% of the ¥42.7 million new-build model. On top of this sits the renovation cost required to fit the brand.
Tier 1: Brand conversion of stock already owned.Where an operator already owns the building and swaps only the brand without moving title, all that is required is the renovation cost. Interior construction market data puts a city-hotel-grade guest room renovation at ¥2.5–5.0 million per room, with a further ¥1.0–3.0 million added where bathroom systems are replaced. Together that gives a range of ¥3.5–8.0 million per room. The midpoint of ¥5.75 million is roughly one-seventh of the ¥42.7 million new-build model. Renovating common areas — lobby, restaurant, fitness — is required separately, but even including it the order of magnitude differs.
Source: MetroEngines Research & Consulting model (new build) / REIT disclosure documents and the ownership master (existing acquisition, N=11 properties) / interior construction market rates (renovation); compiled by the HotelBank Editorial Team
Can a ¥8,700 Rate Gap Recover a ¥36.94 Million Cost Gap?
Bringing the figures together: a new-build international brand reaches a rate ¥8,700 higher on an annual average than a conversion does. Meanwhile the invested cost per room is ¥42.7 million for new construction against ¥5.75 million for a renovation conversion of owned stock (the midpoint of ¥3.5–8.0 million) — a gap of ¥36.94 million. How long would it take to close that cost gap on the rate difference alone? Note that GOP (Gross Operating Profit) in this article refers to the profit level after deducting costs directly attributable to operations from rooms revenue, before rent, depreciation, and interest expense.
| Assumed GOP margin | Annual incremental revenue from the rate gap (per room) | Same, as GOP | Simple payback on the ¥36.94 million cost gap | Total investment yield on new build |
|---|---|---|---|---|
| 30% | ¥2.54 million | ¥762,000 | 48.5 years | 6.5% |
| 35% | ¥2.54 million | ¥889,000 | 41.5 years | 7.6% |
| 40% | ¥2.54 million | ¥1.016 million | 36.4 years | 8.6% |
Source: MetroEngines Research & Consulting model (80% occupancy assumed [full-year basis, a modeling assumption], 365 days, ¥8,700 rate gap); compiled by the HotelBank Editorial Team. Note: this is a simplified model; an actual investment decision requires a detailed feasibility study.
Assuming 80% occupancy (full-year basis, a modeling assumption), the ¥8,700 rate gap generates ¥2.54 million in annual incremental revenue per room. Varying the GOP margin between 30% and 40%, simple payback on the ¥36.94 million cost gap works out to 36–49 years. That is as long as, or longer than, the building’s economic useful life, and the straightforward reading is that the difference in achieved rate alone cannot account for the additional cost of new construction.
So far this rests on one set of assumptions: a ¥8,700 rate gap, 80% full-year occupancy, and a 30–40% GOP margin. We check whether the conclusion changes when those are varied, using three scenarios and a two-axis sensitivity analysis.
| Scenario | Rate gap | Full-year occupancy | GOP margin | Renovation cost / room | Cost gap / room | Incremental GOP / room / year | Payback |
|---|---|---|---|---|---|---|---|
| Optimistic for new build | ¥12,000 | 85% | 40% | ¥8.0 million | ¥34.69 million | ¥1.489 million | 23 years |
| Midpoint (base case) | ¥8,700 | 80% | 35% | ¥5.75 million | ¥36.94 million | ¥889,000 | 42 years |
| Pessimistic for new build | ¥6,000 | 70% | 30% | ¥3.5 million | ¥39.19 million | ¥460,000 | 85 years |
Source: MetroEngines Research & Consulting model (new build cost per room ¥42.69 million, 365 days); compiled by the HotelBank Editorial Team. Note: occupancy and GOP margin are both full-year modeling assumptions, not actual results.
Even lining up the assumptions most favorable to new construction — widening the rate gap to ¥12,000, running at 85% full-year occupancy and a 40% GOP margin, and putting the conversion’s renovation cost at the ¥8.0 million top of the range — recovering the cost gap takes 23 years. Under assumptions harsh to new construction it runs to 85 years, well beyond the building’s economic useful life.
| Rate gap \ full-year occupancy | 65% | 70% | 75% | 80% | 85% |
|---|---|---|---|---|---|
| ¥6,000 | 74 years | 69 years | 64 years | 60 years | 57 years |
| ¥7,500 | 59 years | 55 years | 51 years | 48 years | 45 years |
| ¥8,700 | 51 years | 47 years | 44 years | 42 years | 39 years |
| ¥10,500 | 42 years | 39 years | 37 years | 34 years | 32 years |
| ¥12,000 | 37 years | 34 years | 32 years | 30 years | 28 years |
Source: MetroEngines Research & Consulting model; compiled by the HotelBank Editorial Team. Note: shading marks the base case (¥8,700 rate gap, 80% full-year occupancy).
The shortest of the 25 cells is still 28 years, and every cell spans at least one major refurbishment cycle. The number moves across a 2.6x range depending on how the assumptions are set, but the direction of the conclusion — that the rate gap alone cannot account for the additional cost of new construction — did not reverse anywhere in the range tested. The economic rationale for choosing new construction has to be found in factors other than the rate gap: remaining useful life, design freedom, and the breadth of the investor pool at exit, discussed next.
This is not to say new construction is disadvantaged. The reasons to choose it lie elsewhere than in recovering the rate gap. A newer structure pushes the major refurbishment cycle further out and leaves a longer remaining useful life. Because use, circulation, and room sizes can be designed from zero, specifications that an existing structure cannot physically accommodate become possible. The investor pool at sale is also wider. The 6.5–8.6% total investment yield in the new-build model should be assessed with these values included.
The advantages of conversion, meanwhile, are plain. First, capital efficiency: the ¥36.94 million difference need not be spent. Second, a construction period of a few months to about a year, against roughly three years for a new build, means a shorter gap in cash flow. Third, the lead time for land acquisition and the various permits is avoided entirely. In a market where land prices have risen 40% in two years and construction costs 1.6x in seven, the value of these three points grows year by year.
The Competitive Set — 198 Properties and 25,008 Rooms Within 1 km, 26.6% Added Since 2020
The competitive environment a converted asset lands in is also worth confirming. Within the scope MetroEngines Research covers, 198 properties and approximately 25,008 rooms are clustered within a 1 km radius of the target area’s center (near Minami 4-jo Higashi 1-chome) in Chuo Ward, Sapporo. Stacking room counts by opening year makes the waves of supply clearly visible.
Source: MetroEngines Research (based on confirmed OTA listings, N=198 properties within a 1 km radius); compiled by the HotelBank Editorial Team. Note: because OTA listings appear several months before opening, counts and room numbers for the most recent years may increase as listings are reflected.
After a peak of 1,929 rooms in 2019, additions of roughly 1,000 rooms a year continued from 2020 onward. The cumulative total from 2020 through 2026 is 52 properties and 6,658 rooms, or 26.6% of the stock inside the radius. Because the 2025 and 2026 figures run low by nature given the observation lead time on OTA listings, actual additions are expected to be larger. The breakdown of room supply planned from 2026 onward is covered in our analysis of Sapporo’s 2026–2029 supply pipeline. In an environment where a quarter of the stock inside the radius has turned over to new inventory in six years, a 1994 structure holding at 1.57x the market median is one piece of evidence for the effectiveness of brand conversion.
Mapping the distribution of the 15 properties also shows that price band does not necessarily align with location.
Source: MetroEngines Research; compiled by the HotelBank Editorial Team / circle size = number of rooms, color = 12-month average estimated settled ADR band
Guest Ratings Have Risen Steadily in the Six Years Since Conversion
An argument built on capital efficiency alone would be incomplete, because for a brand conversion to sustain its rate the guest experience has to match the price. According to guest reviews compiled by the HotelBank Editorial Team, the overall rating for Fairfield by Marriott Sapporo is 4.06 across 744 reviews in the most recent 36 months, 4.12 across 537 in the most recent 24 months, 4.28 across 302 in the most recent 12 months, and 4.36 across 64 in the most recent three months — higher the narrower the window. Ratings have accumulated as time since the conversion has passed.
| Rating category | Score, most recent 12 months | Gap vs. area median | Rank band within area | Reviews |
|---|---|---|---|---|
| Cleanliness | 4.90 | +0.68 | Top 10% | 10 |
| Guest room | 4.43 | +0.20 | Top 10% | 198 |
| Staff | 4.41 | +0.11 | Top 25% | 17 |
| Location | 4.36 | +0.05 | Top 25% | 205 |
| Service | 4.24 | +0.09 | Top 25% | 183 |
Source: HotelBank Editorial Team research (most recent 12 months, 302 total reviews; the area benchmark is N=60–65 properties)
What stands out is that the categories in the top 10% band are “cleanliness” and “guest room” — precisely the items renovation builds. Guest-side data corroborates that what determines ratings is the standard of interior and operations, not the vintage of the structure. As outcome measures for a conversion investment, these two categories can serve as leading indicators.
Three Conditions for Repeating This in Other Areas
From the Sapporo measurements, three conditions can be drawn for converting a single-room-oriented city hotel in a regional city to an international brand.
First, guest room area must be securable.Fairfield by Marriott Sapporo’s 254 rooms are built around 24–28 square meter twins, with doubles, singles, and suites added.That is a different range from the 15–18 square meters standard in business hotels. Whether an existing structure can meet the minimum area an international brand requires is the first gate. City hotels built up through the 1990s often carved out room counts on the assumption of single-room demand at the time, and whether the project involves merging two rooms into one — reducing the room count — changes the economics.
Second, the market median must sit above a certain level.The median estimated settled ADR in Chuo Ward, Sapporo was ¥14,600 on a 12-month average. A 1.57x index applied to that produces the ¥22,900 level. In a trade area where the market median itself is low, the same multiple will not reach a rate that recovers the renovation cost. Where an international brand becomes viable in a regional secondary city therefore turns on the level of the local market median rather than on the multiple alone.
Third, there must be an option that does not move title.Of the three tiers here, the most capital-efficient was renovation conversion of owned stock. For railway companies, real estate companies, and local capital that already hold buildings, an international brand franchise agreement is a way to bring in booking channels and a membership base without letting go of the asset. Put the other way, acquiring from outside and converting starts at Tier 2’s ¥29.41 million, with renovation cost on top, so the advantage is not as pronounced as in Tier 1. Where an acquisition route is under consideration, the room to negotiate the acquisition price itself governs whether the investment works.
In a market where construction costs have risen 1.6x in seven years and land prices 40% in two, the value of existing stock keeps rising in relative terms. Regional cities across Japan still hold many city hotels built between the 1970s and 1990s and still operated with single-room-oriented layouts. Reading those not as aging assets but as inventory holding locations and floor area that new construction cannot reproduce is what will matter in investment decisions from here.
Summary
The measured data from Chuo Ward, Sapporo showed four things. First, within the same city-center trade area there is no positive correlation between building age and achieved rate: the median for the seven properties opened before 1999 (¥22,200) exceeds that for the six opened between 2000 and 2023 (¥16,300). Second, the rate gap between a new-build international brand and a brand conversion of an existing building is just ¥8,700 on a 12-month average. Third, invested cost per room splits into three tiers — renovation only ¥3.5–8.0 million, existing hotel acquisition ¥29.41 million, new build ¥42.7 million — and recovering the cost gap on the rate gap alone takes 36–49 years. Fourth, construction cost for lodging-use buildings in Hokkaido is up 157.5% in seven years and land prices at nearby commercial sites up as much as 44.0% in two, so the cost of entry for new construction keeps climbing.
Taken together, converting an existing hotel to an international brand is positioned not as a strategy for capturing the ceiling rate but as a strategy for capturing capital efficiency and lead time. The two are not substitutes; they are parallel options to be selected between according to an investor’s cost of capital and holding period. What one Sapporo property demonstrated over six years is that the option actually works.
Related Reading
- Sapporo Hotel Supply 2026-2029: Hyatt Opens a New High-ADR Tier
- A 4.1 Review Score Is Average, Not a Strength: Sapporo Price Position
- Hokkaido ADR H1 2026: City −5.7%, Business +4.1%, April the Turn
- Corporate Retreat Conversions: 8.27% GOP Yield Across 5 Onsen Areas
- Hakodate Station Land +10.3%, Goryokaku Flat: 226 Hotels, 11,449 Rooms
References and Sources
■ Data sources
Area- and property-level estimated settled ADR is aggregated data from MetroEngines Research & Consulting (Chuo Ward, Sapporo: January 2025–August 2026; the 15 individual properties: August 2025–July 2026). Estimated occupancy is the same firm’s OTA-sales-inventory-based estimate (Hokkaido, city hotel segment, June and July 2026). Property and room counts for supply are based on confirmed OTA listings (within a 1 km radius of the target area’s center). Guest ratings are review aggregations by this editorial team. Acquisition prices, room counts, and acquisition dates are based on the ownership master built from each REIT’s disclosure documents (as of August 2026). Published land prices and zoning are from the MLIT Real Estate Information Library; planned construction costs are from e-Stat’s “Building Construction Starts Statistics.”
■ Modeling assumptions
The new-build cost per room assumes a 1,000 m² site, an 800% floor area ratio, 8,000 m² of gross floor area, a 60% guest room area ratio, and 28 m² per room (171 rooms); land is valued at the 2026 published price for Sapporo Chuo 5-21 of ¥1,100,000/m², and construction cost at ¥775,400/m² — the 2024 actual of ¥671,100/m² with price escalation from start to completion (+4.5% to +5.3% per year over three years) built in (total investment ¥7.30 billion ÷ 171 rooms = ¥42.69 million). Renovation conversion is ¥3.5–8.0 million per room (midpoint ¥5.75 million) and excludes common-area renovation cost and changes in room count from room reduction. Payback is the cost gap ÷ (rate gap × 365 days × full-year occupancy × GOP margin), with the base case at a ¥8,700 rate gap, 80% occupancy, and a 35% GOP margin. The sensitivity analysis recalculates across a ¥6,000–12,000 rate gap, 65–85% full-year occupancy, and a 30–40% GOP margin.
■ Limitations and caveats
Estimated settled ADR and estimated occupancy are estimates based on publicly available OTA information and differ from each property’s actual transacted prices and accounting figures. The 80% full-year occupancy is a modeling assumption, not the actual result of any target property. REIT acquisition prices are the amounts at each acquisition date (2009–2023); they do not indicate current asset value or replacement cost, and they are the median of 11 properties acquired at different points in time. The new-build model is a representative illustration not based on any specific plan, and does not incorporate individual conditions such as district plans, shadow regulations, or parking provision requirements, nor design supervision fees, pre-opening costs, financing costs, or operating agreement terms. Payback is a simple calculation looking only at the rate gap and does not include differences in remaining useful life, major refurbishment cycles, or exit price. Supply aggregates for the most recent years run low given the observation lead time on OTA listings. This article is not a substitute for a business feasibility assessment of any individual project.
■ Market data
- MetroEngines Research — estimated settled ADR (Chuo Ward, Sapporo N=129–137 properties; 15 individual properties), occupancy (OTA-sales-inventory-based estimate), supply data (based on confirmed OTA listings, N=198 properties within a 1 km radius)
- HotelBank Editorial Team research — aggregation of guest reviews (302 in the most recent 12 months, 744 in the most recent 36 months)
■ Government statistics and public data
- MLIT Real Estate Information Library — published land prices (commercial land: Sapporo Chuo 5-1 / 5-2 / 5-12 / 5-20 / 5-21), zoning
- e-Stat “Building Construction Starts Statistics” (Statistics ID: 0003114490 / Hokkaido and nationwide, lodging use, 2017–2024)
- City of Sapporo, “Land Price Information (Published Land Prices and Land Price Surveys)”
■ REIT and investment related
- Invincible Investment Corporation, Japan Hotel REIT Investment Corporation, and Ichigo Hotel REIT Investment Corporation disclosure documents (acquisition dates, acquisition prices, and room counts for Sapporo properties held, N=11 properties)
- Nikkei, “[Published Land Prices 2026] Hokkaido up 1.3%; growth in Sapporo’s suburbs slows on soaring construction costs”
■ Primary information on properties and businesses
- Gekkan Hoteres, “Tobu Railway / Tobu Ryokuchi / Marriott International — first location of the brand’s Japan debut, ‘Fairfield by Marriott Sapporo,’ opens April 26”
- Real Economy, “‘Sapporo Tobu Hotel’ to rebrand as ‘Fairfield by Marriott Sapporo’ in spring 2020”
- Nikkei, “Tobu Railway: Sapporo Tobu Hotel to reopen as ‘Fairfield by Marriott Sapporo’ in spring 2020”
- Sekisui House, “First entry into Hokkaido! ‘Courtyard by Marriott Sapporo’ opens July 23, 2024”
- Wikipedia, “Fairfield by Marriott Sapporo” (timeline of opening, closure, and rebranding)
- Tenpo-Naiso.com, “Interior construction cost benchmarks for hotels and ryokan (2026 edition)” — unit cost per guest room renovation