

Articles on lodging demand driven by semiconductor plants have piled up over the past few years. Articles starting from data centers (DCs), however, are almost nowhere to be found. The reason is simple: DCs scatter across a different geography than semiconductor clusters. What they need is not a concentration of talent but electricity, renewable energy and a cool climate. As a result, large projects are landing in municipalities that have barely been discussed in a lodging-investment context — Ishikari, Wakkanai, Oga, Satsumasendai and Yuzawa.
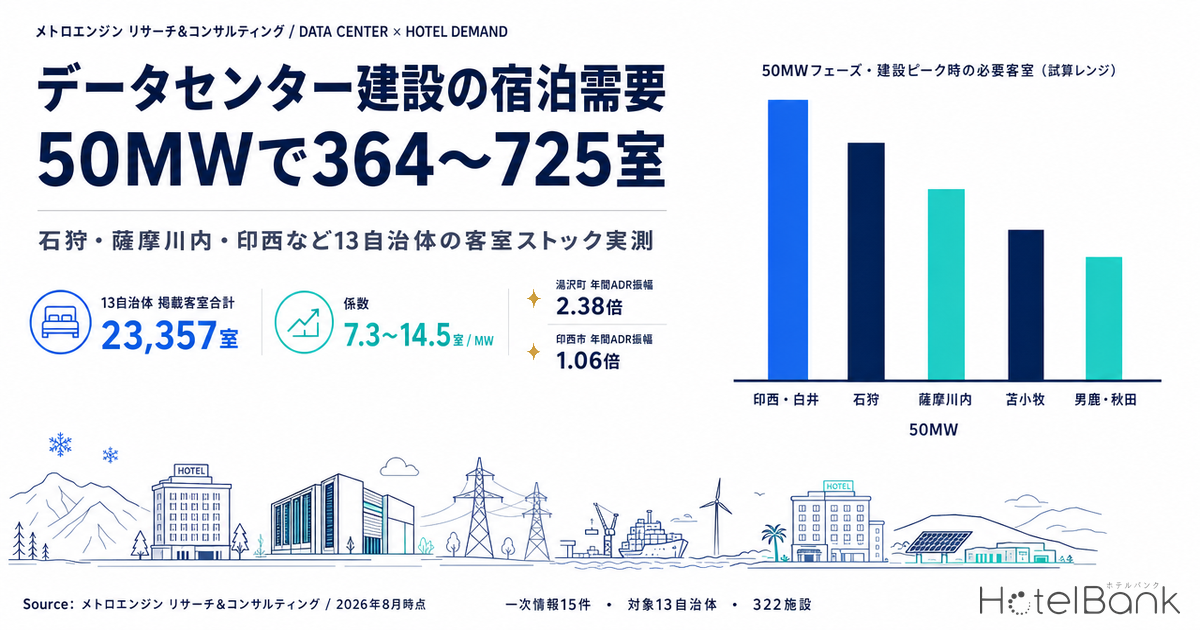
This article verifies, one by one and against primary sources, the DC projects scheduled to come online or expand between 2026 and the 2030s, then measures the room stock, employment and residential structure, estimated settled ADR, and the depth of medium- to long-stay inventory in the surrounding municipalities. The conclusion up front: building one phase of a 50-megawatt (MW) class facility requires roughly 364 to 725 rooms during construction. For many regional nodes that is anywhere from a few tens of percent of existing stock to the equivalent of all of it. And because maintenance staff remain on site permanently once the facility is operating, the demand does not end with the construction period.
Metric Definitions Used in This Article
- ADR (average daily rate): an estimated settled rate (tax-excluded equivalent) calculated by applying category-specific adjustment coefficients to the cheapest plan level each property publishes on OTAs (double occupancy, per-room rate, tax included). Cross-checked against property-level results disclosed by listed hotel REITs, the median error is 6.6% (verification covered business, city, resort, ryokan and capsule categories). It is an estimate and differs from each property’s actual transacted prices and accounting figures. Area-level ADR is the median across the properties covered (the level of a typical property in that area).
- Listed rooms: the total number of rooms at accommodation properties located in the municipality for which a selling price could be confirmed on an OTA for a check-in date within the last 60 days. Properties whose listings cannot be confirmed (temporarily closed, direct-booking only, small simple lodgings, and so on) are not included.
- Data source: MetroEngines Research & Consulting
- — 7.3 to 14.5 rooms per MW of contracted power. A coefficient for peak-construction room demand, back-calculated from the two projects with published total construction costs (Tomakomai, ¥65.0bn / 50MW; Ishikari, ¥9.8bn / 15MW).
- — 364 to 725 rooms for one 50MW-class phase. Even after flexing the assumptions, the sensitivity analysis stays within a 400 to 1,100 room range.
- — Listed rooms across the 13 municipalities total 23,357 (322 listed properties; property master 1,135 properties and 34,532 rooms, a 67.6% listing rate). Ishikari has 311 rooms, Inzai plus Shiroi 996, Satsumasendai 1,071 — the closer a municipality sits to a DC, the thinner its capacity to absorb demand.
- — Inventory that explicitly states self-catering facilities is between 0% and the 8% range at every node. Consecutive-night and weekly plans reach 50.0% in Inzai but only 13.0% in Ishikari: the more regional the node, the further behind it is in productizing long stays.
- — The annual ADR swing is 2.38x in Yuzawa and 2.05x in Wakkanai, against 1.06x in Inzai. The wider the swing, the more room a node has to level out its year when weekday-centric, year-round DC demand arrives.
The 2026-2030s DC pipeline — 15 projects verified against primary sources
Start by fixing the project list. Only those whose location and scale could be confirmed from an operator’s official release or a municipality’s siting-agreement announcement or primary reporting are included. Plans still described as “somewhere in the Kanto region” and concepts whose operator cannot be identified are excluded. A survey conducted by Nikkei xTECH in April and May 2026 (approximately 80 companies contacted, 42 valid responses) reported that 24 companies plan 38 new builds or expansions between 2026 and 2030, and that of the 35 with a confirmed location, 13 are in neither Greater Tokyo nor Greater Osaka. The 15 projects here are a subset of that picture, not an exhaustive market list.
| Region | Operator | Facility / location | Contracted power | Timing |
|---|---|---|---|---|
| Greater Tokyo | NTT DATA Group | Tokyo TKY11 / Inzai-Shiroi area, Chiba | 50MW | April 2027 |
| Greater Tokyo | NTT DATA Group | Tokyo TKY12 / Inzai-Shiroi area, Chiba | approx. 200MW | 2030 onward (phase 1) |
| Greater Tokyo | IIJ | Shiroi Data Center Campus Phase 3 / Shiroi, Chiba | 10MW (25MW in future) | FY2026 |
| Greater Tokyo | MC Digital Realty | NRT14 / Inzai, Chiba | approx. 100MW campus total | Opened April 2026 |
| Greater Osaka | KDDI | Osaka Sakai Data Center / Sakai (former Sharp Sakai plant site) | approx. 57,000 sqm floor area | In service since 22 January 2026 |
| Greater Osaka | SoftBank | Osaka Sakai AI Data Center / Sakai (Sharp Sakai plant) | approx. 150MW class | Full operation targeted during 2025 as announced in June 2024 |
| Regional | SoftBank | Hokkaido Tomakomai AI Data Center / Tomakomai | approx. 50MW, over 300MW in future | FY2026 (total cost over ¥65.0bn) |
| Regional | Tokyu Land Corporation / Flower Communications and others | Ishikari Renewable Energy Data Center No. 1 / Ishikari, Hokkaido | 15MW, 1,140 racks | Completed March 2026, partial operation planned for August |
| Regional | SAKURA internet | Ishikari Data Center expansion / Ishikari, Hokkaido | approx. ¥5.3bn investment | Server operation starts within 2026, generator expansion in 2027 |
| Regional | Toyota Tsusho / Eurus Energy | Soya Green Data Center I (provisional name) / Wakkanai, Hokkaido | 3MW | Construction starts April 2026, full operation during 2027 |
| Regional | HIGHRESO | AI data center in the former Hatto Elementary School / Oga, Akita | not disclosed | August 2027 |
| Regional | S2 / bitgrit | AI data center / industrial park in northern Akita City *Press-reported (development cost reported at around ¥2tn) | up to 500MW | Early 2030s |
| Regional | Kaishin Digital Infrastructure | Circular Park Kyushu (former Sendai thermal power plant site) / Satsumasendai, Kagoshima | 350MW by FY2032 | Container-type start in FY2026 |
| Regional | Digital Dynamic | Distributed AI data center / Iriki Industrial Park, Satsumasendai, Kagoshima | up to 19MW | Operations from November 2026 |
| Regional | GetWorks / GX Technology | Yuzawa GX Data Center / Yuzawa, Niigata | liquid-cooled container type | Operating since February 2025 (third site in the town) |
The share of regional projects is the thing to hold on to. Even on the market-survey basis, 13 of the 35 location-confirmed projects sit outside Greater Tokyo and Greater Osaka, and within the range this article could trace via primary sources, 9 of 15 are regional. Regional projects also differ in character from Tokyo-area ones. In areas such as Inzai and Shiroi, where data centers have already clustered, construction traffic and lodging demand are absorbed into existing flows. But where a large box goes up in a place almost nobody lives — the Ishikari Bay New Port area, the former Sendai thermal power plant site — the lodging of construction crews lands entirely on the nearest town.
Location assessment — nodes split between “nobody lives here” and “regional hub city”
Seen through a lodging lens, DC node locations split cleanly into two types. One is the coastal industrial site or former power plant site with almost no resident population or businesses around it. The other is the station-front area of a regional hub city that already has commercial and employment density. The first depends entirely on outside capacity to house construction crews; the second competes for slots with existing business demand. That difference changes the product design of anyone entering the market from the ground up.
| Node (reference point) | Establishments 1km radius | Employees 1km radius | Office-sector share | Residents 1.5km radius (2025) | Senior share | Population change by 2040 |
|---|---|---|---|---|---|---|
| Inzai / Shiroi (Chiba New Town Chuo Station) | 48 | 302 | 2.0% | 17,569 | 22.7% | +0.1% |
| Ishikari (Ishikari Bay New Port area) | 30 | 503 | 1.0% | 54 | 50.0% | −40.7% |
| Wakkanai (Wakkanai Station) | 351 | 2,969 | 14.6% | 3,241 | 40.7% | −36.9% |
| Oga (Oga Station)*employment figures are indicative | 232 | 1,786 | 2.9% | 2,582 | 53.4% | −45.8% |
| Satsumasendai (Sendai Station) | 698 | 5,948 | 9.4% | 17,514 | 28.0% | −12.2% |
| Yuzawa (Echigo-Yuzawa Station) | 331 | 2,839 | 9.6% | 3,138 | 37.7% | −16.9% |
Fifty-four people live within a 1.5km radius of the Ishikari Bay New Port area. There are 30 establishments and 503 employees. In other words, this is a place to work but neither a place to stay nor a place to live. While a 15MW DC is being built, crews will lodge in central Ishikari or northern Sapporo. Wakkanai has a similar structure: 351 establishments and 2,969 employees within 1km of the station, while the resident population has shrunk to 3,241 and is projected to fall a further 36.9% by 2040. The Soya Green Data Center site is a 9,900 sqm plot adjacent to the Kabaoka Wind Farm, away from the town center.
Satsumasendai is the contrast. Within 1km of Sendai Station there are 698 establishments and 5,948 employees, and within 1.5km a resident population of 17,514. Its 9.4% office-sector share puts Satsumasendai and Yuzawa at the top of the six nodes here, and the functions of a regional hub city are already in place. The projected population decline to 2040, at −12.2%, is also gentler than at the other regional nodes. A 350MW-class DC arriving here in phases makes this the node with the widest gap between demand scale and existing base.
Inzai and Shiroi are best treated as a third type. The resident population within 1.5km of Chiba New Town Chuo Station is 17,569 and is projected to be essentially flat at +0.1% in 2040. Population holds up as a commuter-belt new town, yet establishments within 1km of the station number only 48 with 302 employees, and the office-sector share stays at 2.0%. The DCs sit on industrial land away from the station, so demand arises on a different layer from the station-front commercial and employment cluster. In MLIT’s “2026 Official Land Price” survey (as of 1 January 2026), Chiba Prefecture reported that industrial land in Inzai rose more than 10% year on year. Hokkaido was also reported to be up 1.3% year on year across all uses, a tenth consecutive annual rise. Land pricing has already begun to reflect this demand.
Measuring room stock — 23,357 rooms across 13 municipalities, but few of them next to a DC
Next, count the capacity. The scope is each DC node’s host municipality plus the neighbouring municipalities crews could realistically commute from. Listed rooms are the sum of rooms at properties for which a selling price could be confirmed on an OTA for a check-in date within the last 60 days. Properties whose listings cannot be confirmed (temporarily closed, direct-booking only, small simple lodgings) are excluded, so the figure runs below the true total of rooms in existence. Registered counts from the property master are shown alongside for reference.
| Node / municipality | Listed properties | Listed rooms | Master properties | Master rooms | Listing rate (room basis) |
|---|---|---|---|---|---|
| Inzai / Shiroi / Inzai, Chiba | 5 | 970 | 8 | 999 | 97.1% |
| Shiroi, Chiba | 1 | 26 | 2 | 46 | 56.5% |
| Narita, Chiba (reference, adjacent) | 39 | 8,053 | 68 | 8,793 | 91.6% |
| Ishikari / Ishikari, Hokkaido | 8 | 311 | 23 | 456 | 68.2% |
| Wakkanai / Wakkanai, Hokkaido | 23 | 1,038 | 58 | 1,590 | 65.3% |
| Tomakomai / Tomakomai, Hokkaido (covered in an earlier article) | 16 | 1,384 | 45 | 2,070 | 66.9% |
| Oga / Oga, Akita | 14 | 566 | 40 | 1,060 | 53.4% |
| Katagami, Akita | 2 | 27 | 11 | 136 | 19.9% |
| Akita City, Akita (reference, adjacent) | 49 | 4,646 | 119 | 5,958 | 78.0% |
| Satsumasendai / Satsumasendai, Kagoshima | 26 | 1,071 | 112 | 1,898 | 56.4% |
| Ichikikushikino, Kagoshima | 4 | 63 | 12 | 145 | 43.4% |
| Yuzawa / Yuzawa, Niigata | 80 | 3,510 | 344 | 7,141 | 49.2% |
| Minamiuonuma, Niigata | 55 | 1,692 | 293 | 4,240 | 39.9% |
| 13 municipalities, total | 322 | 23,357 | 1,135 | 34,532 | 67.6% |
The spread in listing rates is what catches the eye. At 97.1%, Inzai sells almost every registered room on OTAs. Its stock is mostly urban business hotels with a year-round product mix. Yuzawa, by contrast, sits at 49.2% and Minamiuonuma at 39.9%. Both have many ski-season pensions, rental villas and small ryokan, which suggests a considerable number of properties stop selling altogether in the off season. Dormant capacity is waiting there to be brought back if a year-round source of demand arrives.
The 53.4% and 56.4% listing rates in Oga and Satsumasendai are also worth noting. Both cities hold stock that includes onsen ryokan and tourist inns, yet close to half of it is not on sale at any given time. DC construction demand — weekday-centric, long-stay and year-round — could be exactly the route that puts this dormant stock into operation.
Twelve months of estimated settled ADR — a 2.38x swing in Yuzawa against 1.06x in Inzai
Now the price level and seasonality. The chart lines up each municipality’s estimated settled ADR (area median) for the twelve months from August 2025 to July 2026. What matters here is less the absolute level than the annual swing. The wider the swing, the greater the levelling effect when year-round demand arrives.
| Municipality | Annual high | Annual low | Swing (x) | Character of demand |
|---|---|---|---|---|
| Yuzawa, Niigata | ¥23,200 (Jan) | ¥9,700 (Jun) | 2.38 | Winter resort. Large slack in the shoulder season |
| Wakkanai, Hokkaido | ¥13,900 (Jun) | ¥6,800 (Mar) | 2.05 | Summer tourism. Large slack in winter |
| Oga, Akita | ¥23,500 (Aug) | ¥16,500 (Feb) | 1.43 | Mix of onsen and tourism with business demand |
| Satsumasendai, Kagoshima | ¥7,500 (Jan) | ¥5,300 (Jun) | 1.42 | Business-led. Stable at a low price level |
| Inzai, Chiba | ¥7,800 (Apr) | ¥7,400 (Dec) | 1.06 | Almost purely year-round business demand |
Inzai’s 1.06x swing shows what a DC cluster arrives at. Rates barely move across the year. This is a state in which rooms are filled purely by business demand, with no seasonal tourism wave and little distinction between weekdays and weekends. What Inzai looked like before the DCs gathered is outside this article’s data range, but its present shape is at least underpinned by demand that can be read year-round.
Read the other way, Yuzawa’s 2.38x and Wakkanai’s 2.05x are a measure of headroom. Yuzawa’s June estimated settled ADR is ¥9,700, only just over 40% of its ¥23,200 January level. If weekday-centric, long-staying construction crews land in that trough, the annual RevPAR structure changes. Wakkanai’s trough is ¥6,800 in March, and the Soya Green Data Center schedule — construction from April 2026, operation during 2027 — straddles that shoulder season twice.
Rooms needed per DC project — a coefficient of 7 to 15 rooms per MW
From here it is an estimate. How many workers are on site at the peak of DC construction, and how many of them need a room? No DC project discloses crew numbers directly, so the approach here back-calculates from published total construction costs and construction labour unit rates. Every assumption is stated.
■ Estimate assumptions
- Labour cost ratio: 20% of construction investment. Set as a general level for building works (placed below typical building construction because DCs carry a higher share of electrical and mechanical equipment).
- Labour unit rate: ¥25,834 per person-day. The national all-trades weighted average in MLIT’s “Standard Labour Rates for Public Works Design applicable from March 2026” (a fourteenth consecutive annual increase, +4.5% year on year).
- Schedule and working days: 24 months, 250 working days per year (500 days in total).
- Peak coefficient: 1.8x the average headcount, assuming the crunch when structural and equipment works overlap.
- Share of crew from outside the area: 40%. The remaining 60% is assumed to commute from within the local area.
- Rooms per person: one room per person.
- The two reference projects: SoftBank’s “Hokkaido Tomakomai AI Data Center” at over ¥65.0bn total cost and approximately 50MW of contracted power; Ishikari Renewable Energy Data Center No. 1, which raised ¥9.8bn, at 15MW. Both are published figures.
- This is an approximate estimate; an actual investment decision requires a project-specific feasibility study.
| Reference project | Investment | Contracted power | Total person-days | Peak crew | Rooms needed | Per MW |
|---|---|---|---|---|---|---|
| Tomakomai type (large AI-DC) | ¥65.0bn | 50MW | approx. 503,000 person-days | approx. 1,812 per day | approx. 725 rooms | 14.5 rooms |
| Ishikari type (mid-size renewable DC) | ¥9.8bn | 15MW | approx. 75,900 person-days | approx. 273 per day | approx. 109 rooms | 7.3 rooms |
The coefficient obtained from the two real projects is 7.3 to 14.5 rooms per MW of contracted power. The difference in unit investment per MW (¥1.30bn versus ¥0.65bn) shows up directly as the width of that range. The denser and more liquid-cooled the AI specification, the larger the unit investment and the more rooms required. Applying the coefficient to each node gives the following.
| Node | Phase covered | Contracted power | Rooms needed (estimate) | Current listed rooms | Needed / current |
|---|---|---|---|---|---|
| Inzai / Shiroi | Tokyo TKY11, single building | 50MW | 364-725 rooms | 996 rooms (Inzai + Shiroi) | 37-73% |
| Ishikari | Ishikari Renewable DC No. 1 | 15MW | 109-217 rooms | 311 rooms | 35-70% |
| Wakkanai | Soya Green DC I | 3MW | 22-43 rooms | 1,038 rooms | 2-4% |
| Satsumasendai | Iriki Industrial Park (distributed) | 19MW | 138-275 rooms | 1,071 rooms | 13-26% |
| Satsumasendai | Circular Park Kyushu assuming an initial phase equivalent to 30MW | 30MW | 219-435 rooms | 1,071 rooms | 20-41% |
| Akita / Oga | Akita City AI-DC, 50MW phase equivalent | 50MW | 364-725 rooms | 5,239 rooms (Akita + Oga + Katagami) | 7-14% |
| Tomakomai | Tomakomai AI-DC, initial phase | 50MW | 364-725 rooms | 1,384 rooms | 26-52% |
Sensitivity analysis — rooms needed when the assumptions are flexed (50MW, ¥65.0bn case)
| Labour cost ratio \ outside-area crew share | 30% | 40% (base) | 50% |
|---|---|---|---|
| 15% | 408 rooms | 544 rooms | 680 rooms |
| 20% (base) | 544 rooms | 725 rooms | 906 rooms |
| 25% | 680 rooms | 906 rooms | 1,133 rooms |
Even with the assumptions flexed widely, the room requirement for one 50MW-class phase stays roughly within a 400 to 1,100 range. Where it lands within that band depends heavily on how many workers local contractors can mobilise (that is, the outside-area crew share). At nodes where population decline is advanced, such as Wakkanai and Oga, dependence on outside crews is likely to be higher, so it is natural to read those toward the upper end.
And the demand after commissioning should not be forgotten. DCs are described as close to unmanned, but in practice maintenance, network and electrical staff rotate through continuously. Add scheduled maintenance of liquid cooling systems and server expansion or replacement works every few years. Once the construction peak has passed, a mid-sized weekday-centric stay demand remains as a base load. That is the decisive difference from a typical construction project, where demand vanishes at completion.
The gap in category mix — kitchen-equipped inventory tops out in the 8% range
What kind of room matters as much as the room-count gap, and arguably more. Stays tied to DC construction run from several weeks to several months. What suits that segment is apartment-style, long-stay rooms with a kitchen and washing machine, not a one-night business hotel with breakfast. So for the registered properties in each municipality, the depth of inventory that explicitly promotes medium- to long-term stays was tallied from published room names and plan names.
| Municipality | Registered properties | Kitchen or other self-catering | Share | Consecutive-night, weekly, monthly | Share | Apartment / residence type |
|---|---|---|---|---|---|---|
| Inzai, Chiba | 8 | 0 | 0.0% | 4 | 50.0% | 0 |
| Shiroi, Chiba | 2 | 0 | 0.0% | 0 | 0.0% | 0 |
| Narita, Chiba | 68 | 4 | 5.9% | 29 | 42.6% | 0 |
| Ishikari, Hokkaido | 23 | 1 | 4.3% | 3 | 13.0% | 0 |
| Wakkanai, Hokkaido | 58 | 2 | 3.4% | 13 | 22.4% | 0 |
| Tomakomai, Hokkaido | 45 | 1 | 2.2% | 13 | 28.9% | 0 |
| Oga, Akita | 40 | 2 | 5.0% | 8 | 20.0% | 0 |
| Katagami, Akita | 11 | 0 | 0.0% | 0 | 0.0% | 0 |
| Akita City, Akita | 119 | 3 | 2.5% | 31 | 26.1% | 0 |
| Satsumasendai, Kagoshima | 112 | 0 | 0.0% | 21 | 18.8% | 0 |
| Ichikikushikino, Kagoshima | 12 | 1 | 8.3% | 2 | 16.7% | 0 |
| Yuzawa, Niigata | 344 | 6 | 1.7% | 88 | 25.6% | 7 |
| Minamiuonuma, Niigata | 293 | 7 | 2.4% | 51 | 17.4% | 3 |
Properties that explicitly state self-catering facilities stay in the single-digit percentages at every node. Satsumasendai and Inzai have none at all, and Yuzawa has six out of 344 properties (1.7%). Yuzawa should hold a substantial amount of rental-villa inventory converted from resort condominiums, yet few of them mention a kitchen in the published room or plan names. Put the other way, this is an area where demand can be captured simply by changing how the offer is described.
Properties with consecutive-night or weekly plans are more common on the Tokyo side — 50.0% in Inzai and 42.6% in Narita — and less common regionally, at 13.0% in Ishikari, 16.7% in Ichikikushikino and 17.4% in Minamiuonuma. Where DCs and logistics have already clustered, in Inzai and Narita, long stays have been productized. That difference is exactly the headroom at regional nodes. On how many nights a consecutive-night plan should start from and what discount rate to design, our article Japan Hotel Long-Stay Discounts: 15% at 7 Nights, 20% at 30 Nights sets out the measured market levels.
Properties already coming on stream
Openings aimed at industrial infrastructure demand have in fact already begun. In Oga, Akita, “Hotel Kinoshita Akita Oga Ekimae” (ホテル木下 秋田男鹿駅前) opened on 5 March 2026. Of its 161 rooms, 10 are long-stay double rooms (19 sqm, equipped with a washing machine and microwave), and the location has been reported as positioned for the start-up of offshore wind power. That single property accounts for well over a quarter of Oga’s 566 listed rooms.
Hokkaido is moving quickly too. Ishikari added a 175-room property in October 2025, and Tomakomai saw a 50-room property explicitly aimed at workers open in December 2025. Yuzawa, Niigata, saw a 220-room property in February 2026 and an 83-room property in September 2025. None of these are scaled on tourism demand alone. The movement covered in our earlier article Chitose & Tomakomai Worker Lodging — 7 New Hotels, 738 Rooms in 2026 can be read as spreading across a wider geography.
Looking at planning data on a building-confirmation basis from MLIT’s “Building Construction Statistics Survey”, however, no hotel-use applications can be confirmed in Akita, Kagoshima or Niigata, and the applications in Chiba and Hokkaido are concentrated in places away from the DC nodes — Funabashi, Urayasu, central Sapporo, Kutchan. Because building confirmation is normally filed one to two years before opening, this should be read as a lower bound on the confirmed pipeline at this point in time, with the count and room numbers expected to rise as further applications come in. Read the other way, for operators targeting openings from 2027 onward, there are still seats free. That said, new supply in that period is itself set to thin out on construction-cost grounds.
Conclusion — how to go after year-round demand
Wide gap Ishikari and Satsumasendai
In Ishikari, the 15MW project alone generates demand equivalent to 35-70% of current listed rooms. Almost nobody lives nearby, so crews flow into central Ishikari and northern Sapporo. Satsumasendai has a 350MW-class phased build ahead of it and, at a 56.4% listing rate, a thick layer of dormant stock. These are the nodes where the case for new medium- and long-stay entry is clearest.
Levelling Yuzawa and Wakkanai
Yuzawa’s annual ADR swing is 2.38x and Wakkanai’s 2.05x. Existing stock has plenty of absolute capacity, so product design that levels out off-season occupancy works better than building new. Stating self-catering facilities, running a permanent seven-night-plus plan and carving out rooms with a washing machine can capture the upside with the existing property as it stands.
Category shift Oga and Inzai
Oga already has a 161-room business-type property up and running, 10 rooms of it in a long-stay specification. Inzai has arrived at a fully year-round business-demand profile with a 1.06x annual swing. Both serve as leading cases of what a node looks like once DC and industrial infrastructure demand has settled in, and as a reference point for product design elsewhere.
To put it in order, lodging demand originating from DCs has three layers. First, the peak demand during construction — 7 to 15 rooms per MW of contracted power, 364 to 725 rooms for a 50MW-class phase. Second, a year-round base load from maintenance and expansion staff after commissioning. Third, business travel from the industries a DC cluster draws in: power, telecoms, cooling equipment, IT vendors. Judging the opportunity as “one-off” by looking only at the first layer means missing the second and third. Inzai’s 1.06x annual ADR swing is what those three layers look like once stacked.
For a regional node, this demand does not compete with tourism. Weekday-centric, long and year-round, it sits exactly on the other side of tourism demand, which concentrates on weekends and high season. June in Yuzawa, March in Wakkanai, February in Oga — the months where rates sink lowest are the ones with slots left to fill. DC construction demand overlays those troughs neatly.
For developers, the significant point is that there is no need to build the business case on visitor numbers in municipalities with thin existing lodging demand. For a feasibility assessment, take the operator’s published commissioning year and contracted power, derive a range of rooms needed, and lay it over existing listed rooms. The coefficient here should serve for that first-pass screening. From there, the specifics come down to local contractors’ mobilisation capacity (the outside-area crew share) and how the construction schedules overlap.
Frequently asked questions
Q. How is lodging demand from data center construction different from semiconductor plant construction demand?
The dispersion of locations and the time horizon differ. Semiconductor clusters concentrate in specific regions in search of talent and supplier density, whereas DCs seek electricity, renewable energy and a cool climate, so they locate at scattered nodes such as Ishikari, Wakkanai, Oga, Satsumasendai and Yuzawa. Demand also does not disappear at completion: maintenance, network and electrical staff rotate through continuously once operations begin, and server expansion and replacement works run every few years.
Q. How should the “7 to 15 rooms per MW of contracted power” coefficient be used?
As a rule of thumb for first-pass screening. Multiply the contracted power an operator publishes by the coefficient and compare it with the municipality’s listed rooms, and you get a rough read on how tight capacity is. Note, though, that the coefficient here is back-calculated from the two projects with published total costs, and the difference in unit investment per MW (¥0.65bn and ¥1.30bn) translates directly into the width of the range. Assume the denser and more liquid-cooled the AI specification, the closer to the upper end.
Q. Why do listed rooms differ from the room count in the property master?
Because listed rooms count only properties for which a selling price could be confirmed on an OTA for a check-in date within the last 60 days. Temporarily closed properties, those selling direct only, and those that stop selling in the off season are not included. Yuzawa’s low 49.2% listing rate reflects the large number of properties there that operate mainly around the ski season.
Q. What should an existing property do first to go after this demand?
Start by stating self-catering facilities and length-of-stay conditions in room names and plan names. In this tally, properties that state a kitchen or similar in public information stayed in the single-digit percentages at every node. A considerable number are likely to have the facilities without describing them. A permanent seven-night-plus plan, carving out rooms with a washing machine, and a room-only price tier are all moves that can be made without building anything.
Related reading
- Chitose & Tomakomai Worker Lodging — 7 New Hotels, 738 Rooms in 2026
- Niigata Hotel Investment Map: Niigata City, Yuzawa & Sado in 3 Layers
- Hotel Category Mix Explains Half of City ADR: 34 Municipalities
- Japan Hotel Long-Stay Discounts: 15% at 7 Nights, 20% at 30 Nights
References and sources
■ Data sources
Listed property and room counts are tallied from properties for which a selling price could be confirmed on an OTA for a check-in date within the last 60 days (listed properties N=322 / property master N=1,135, as of August 2026). Estimated settled ADR is the area median for each municipality, taken over the twelve months from August 2025 to July 2026 (monthly property counts: Yuzawa N=39, Satsumasendai N=20, Wakkanai N=17, Oga N=12, Inzai N=4). Medium- and long-stay inventory is tallied from descriptions in published room names and plan names (registered properties N=1,135). Employment structure comes from the Ministry of Internal Affairs and Communications / Ministry of Economy, Trade and Industry “Economic Census for Business Activity”; resident population from MLIT National Land Numerical Information (250m-mesh future population projections); labour unit rates from MLIT “Standard Labour Rates for Public Works Design applicable from March 2026”. The 15 DC projects were each verified for location and scale against operators’ official releases, municipal announcements and primary reporting.
■ Limitations and caveats
(1) The room requirement is back-calculated from total construction costs and labour unit rates; because DC operators do not publish crew numbers, it cannot be reconciled against actuals. The 20% labour cost ratio, 1.8x peak coefficient, 40% outside-area crew share and one-room-per-person basis are this article’s own settings, and should be read together with the range in the sensitivity analysis. (2) What is quantified here is only peak-construction demand; the base-load demand from maintenance and expansion staff after commissioning, and business travel from surrounding industries, are noted qualitatively because published information is scarce. (3) Listed rooms are limited to properties whose OTA listing could be confirmed and exclude temporarily closed properties, direct-booking-only properties and small simple lodgings, so the figure runs below the true room count. (4) Estimated settled ADR is an estimate and differs from each property’s actual transacted prices and accounting figures. Municipalities with single-digit property counts, such as Inzai, Ishikari and Shiroi, require a margin when interpreting levels. (5) The initial 30MW-equivalent phase at Circular Park Kyushu is a provisional assumption, and Yuzawa GX Data Center is excluded from the estimate because its contracted power is not published. (6) Planning data on a building-confirmation basis is filed one to two years before opening, so it should be read as a lower bound on the confirmed pipeline at this point in time.
■ Market data
- MetroEngines Research & Consulting — listed property and room counts (OTA-listing confirmed basis), estimated settled ADR, tally of medium- and long-stay inventory, room requirement estimates
■ Government statistics and public data
- MLIT “Standard Labour Rates for Public Works Design applicable from March 2026” (national all-trades weighted average ¥25,834 per person-day)
- MLIT National Land Numerical Information (250m-mesh future population projections, 2024 IPSS-based estimate)
- Ministry of Internal Affairs and Communications / Ministry of Economy, Trade and Industry “Economic Census for Business Activity” (boundaries from Population Census small areas, e-Stat statistical GIS)
- MLIT “Building Construction Statistics Survey” (planning data on a building-confirmation basis)
- Chiba Prefecture “2026 Official Land Price”
■ Operator releases and municipal announcements
- NTT DATA Group, “Launch of an approximately 250MW data center campus development in the Inzai-Shiroi area of Chiba, one of Japan’s largest” (17 April 2026)
- IIJ, “Expansion of Shiroi Data Center Campus Phase 3 to meet growing demand for own services” (8 May 2025)
- MC Digital Realty, “Opening of NRT14, the third building at the NRT campus in Inzai, Chiba”
- KDDI, “Osaka Sakai Data Center enters service on 22 January”
- SoftBank, “On the construction of a large-scale AI data center using the Sharp Sakai plant” (7 June 2024)
- SoftBank, “Groundbreaking ceremony for the Hokkaido Tomakomai AI Data Center, one of Japan’s largest with a state-of-the-art AI platform” (21 April 2025)
- Tokyu Land Corporation, “Completion of Ishikari Renewable Energy Data Center No. 1” (2026)
- City of Ishikari, Hokkaido, “Ishikari Renewable Energy Data Center No. 1”
- SAKURA internet news releases (Ishikari Data Center expansion, participation in the Ishikari Data Center Consortium)
- Toyota Tsusho, “Start of Japan’s first green data center business directly connected to a wind farm” (14 January 2026)
- City of Wakkanai, Hokkaido, “On the start of a wind-farm-connected green data center business in Wakkanai”
- City of Satsumasendai, Kagoshima, “A preparatory company will be established to open one of Japan’s largest AI data centers in this city”
- eole, “Launch of a distributed AI data center business with Digital Dynamic in Satsumasendai, Kagoshima”
- Kinoshita Group, “Hotel Kinoshita Akita Oga Ekimae grand opening, 5 March 2026”
■ Press coverage
- Nikkei xTECH — survey on data center new-build and expansion plans (conducted April-May 2026, approximately 80 companies contacted, 42 valid responses)
- Jiji Press, “Japan’s largest AI data center planned in Akita: ¥2tn development cost, clustering companies and talent — using offshore wind, with state support” (16 August 2026)
- Kahoku Shimpo, “Plan for one of Japan’s largest AI data centers: the key to entering Akita City is ‘latent energy supply capacity'” (7 August 2026)
- “HIGHRESO opens an AI data center in a former school building in Oga, Akita” (May 2026)
- Cloud Watch, “GetWorks and GX Technology begin full operation of the liquid-cooled container-type ‘Yuzawa GX Data Center'”
- Nikkei, “[Official land prices 2026] Hokkaido up 1.3%, growth slows in Sapporo’s suburbs on rising construction costs”
- Nikkei, “A business hotel in Oga, Akita, eyeing the start-up of offshore wind”