

In the first half of 2026, Japan’s accommodation market reached a turning point: inbound visitor arrivals fell year on year for the first time in five years. Nationwide guest nights for January-May 2026 were down 3.9% from the same period a year earlier. Behind that headline, however, ten prefectures posted double-digit growth in guest nights — and in every one of them, 80-90% of the increase came from Japanese guests. This article combines prefecture-level data from the Japan Tourism Agency’s Overnight Travel Statistics Survey with MetroEngines Research estimated settled ADR and inventory sell-through data to identify which prefectures domestic demand lifted, and whether rate and occupancy have followed.
Metric Definitions Used in This Article
- Guest nights and room occupancy rate (official statistics): Figures published in the Japan Tourism Agency’s Overnight Travel Statistics Survey. The room occupancy rate is the survey’s own actual figure covering all accommodation facilities, and is a different measure from the estimated OCC discussed later.
- ADR (average daily rate): An estimated settled rate (tax-exclusive equivalent) calculated by applying category-specific adjustment factors to the lowest published plan level each property lists on OTAs and similar channels (double occupancy, per-room rate, tax-inclusive). Cross-checked against property-level results disclosed by listed hotel REITs (184 property-months, April-May 2026), the median error is approximately 7.5%. These are estimates and differ from each property’s actual transacted rates and accounting figures. Area-level ADR is the median of the properties covered (the level of a typical property in that area).
- OCC (estimated occupancy): The share of sold rooms against total rooms in the area (an estimate based on OTA-listed inventory). Because it is derived from the sell-through of inventory offered on OTAs, it differs from a property’s actual overall occupancy rate.
- Data sources: Japan Tourism Agency, Overnight Travel Statistics Survey; Japan National Tourism Organization (JNTO); MetroEngines Research
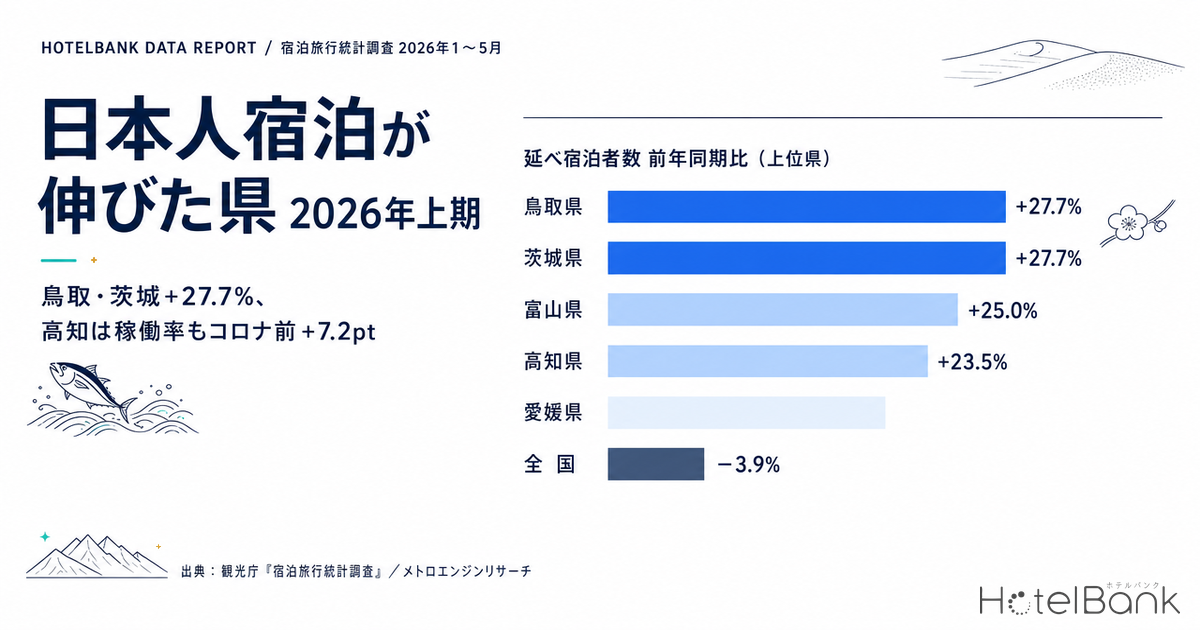
- — Ten prefectures posted double-digit year-on-year growth in guest nights for January-May 2026. Against a national decline of 3.9%, Tottori and Ibaraki led with identical gains of +27.7%.
- — In all ten double-digit prefectures, at least 79% of the increase came from Japanese guests — 97% in Akita and 95% in Toyama, Yamaguchi and Shimane. Domestic demand, not inbound, did the lifting.
- — Against the pre-pandemic benchmark (2015-2019 January-May average), room occupancy was up +7.19pt in Kochi, +6.12pt in Nara and +5.84pt in Toyama. The national figure was −0.36pt, essentially flat.
- — Rate has followed unevenly. Year-on-year estimated settled ADR rose +6.4% in Ibaraki, +6.3% in Ehime and +4.9% in Kochi, versus +2.0% in Toyama and −0.6% in Tottori.
- — The correlation between foreign-guest share and year-on-year growth in guest nights is −0.563 (N=47). The 12 least inbound-dependent prefectures had a median of +9.86%; the 11 most dependent, −8.03%.
National occupancy stood at 56.2% in June — how a 2.0% inbound decline reached lodging demand in H1 2026
Start with the national outline. Inbound arrivals for the first half of 2026 (January-June), announced by the Japan National Tourism Organization on 15 July 2026, totalled 21,084,800 — down 2.0% year on year. It was the second consecutive first half above 20 million, but the first decline in five years. By market, China fell 56.4% to 2,058,200, while South Korea rose 18.6% to 5,675,100 and Taiwan rose 20.9% to 3,972,200 — a sharp divergence between source markets.
That shift has carried through to lodging demand. According to the Japan Tourism Agency’s Overnight Travel Statistics Survey, guest nights in June 2026 (first preliminary figures) came to 46.78 million, down 6.5% year on year — 34.26 million Japanese (−4.4%) and 12.51 million foreign (−11.9%). The room occupancy rate was 56.2%, down 2.6 points from 58.8% a year earlier. A prefecture-by-prefecture breakdown of that June occupancy figure, read as a map of demand headroom, is set out in June 2026 Occupancy 56.2%: Guest-Nights per Room in 47 Prefectures. Using the January-May 2026 cumulative period, for which prefecture-level figures are complete, national guest nights were 250.93 million, down 3.9% year on year — 179.91 million Japanese (−2.3%) and 71.02 million foreign (−7.8%).
National averages, however, flatten out market structure. The January-May 2025 base includes the lift the Osaka-Kansai Expo (which opened on 13 April 2025) gave the Kansai region, and the payback from that is now dragging on Kansai’s 2026 year-on-year comparison. The national figure of −3.9% is a blend of that special factor, the change in inbound composition, and a geographic shift in domestic demand. That is precisely why breaking the data down by prefecture is worth doing.
Ten prefectures grew guest nights by double digits — 80-90% of the gain was domestic
Comparing cumulative January-May 2026 guest nights across all 47 prefectures, 28 were up year on year, and ten of those posted double-digit growth. Tottori and Ibaraki tied at the top, both up 27.7%, followed by Toyama (+25.0%), Kochi (+23.5%) and Ehime (+23.2%). Given that the national figure was −3.9%, these ten prefectures diverged from the national average by 15 to 30 points or more.
Source: Compiled by the HotelBank Editorial Team from the Japan Tourism Agency’s Overnight Travel Statistics Survey
What matters is where that growth came from. Decomposing the increase (the difference between January-May 2026 and the same period in 2025) into Japanese and foreign guests, 97% of Akita’s gain, 95% of Toyama’s, 95% of Yamaguchi’s and Shimane’s, and 93% of Ibaraki’s came from Japanese guests. In all ten prefectures, the domestic contribution was 79% or higher. While inbound demand decelerated nationally, these prefectures were running on a different engine: domestic demand.
| Prefecture | Guest nights Jan-May 2026 |
Total YoY |
Japanese YoY |
Foreign YoY |
Foreign share |
Domestic share of the gain |
|---|---|---|---|---|---|---|
| Tottori | 1,193,590 | +27.7% | +27.8% | +27.4% | 8.4% | 92% |
| Ibaraki | 3,615,560 | +27.7% | +26.8% | +51.3% | 4.6% | 93% |
| Toyama | 1,753,650 | +25.0% | +27.4% | +8.8% | 11.3% | 95% |
| Kochi | 1,311,520 | +23.5% | +22.7% | +35.1% | 6.5% | 91% |
| Ehime | 2,181,980 | +23.2% | +21.2% | +35.7% | 14.9% | 79% |
| Yamaguchi | 1,793,790 | +22.0% | +22.1% | +20.9% | 5.1% | 95% |
| Aomori | 2,117,580 | +18.0% | +17.4% | +23.0% | 12.3% | 85% |
| Akita | 1,220,180 | +17.1% | +17.6% | +9.0% | 5.4% | 97% |
| Shimane | 1,339,930 | +13.5% | +13.3% | +19.3% | 3.5% | 95% |
| Fukushima | 4,045,690 | +11.7% | +10.5% | +34.4% | 5.9% | 86% |
| National | 250,927,260 | −3.9% | −2.3% | −7.8% | 28.3% | 41% |
Source: Compiled by the HotelBank Editorial Team from the Japan Tourism Agency’s Overnight Travel Statistics Survey (N=47 prefectures, cumulative January-May 2026)
Foreign-guest share puts these ten prefectures in sharper relief. Ibaraki at 4.6%, Yamaguchi at 5.1%, Akita at 5.4% and Shimane at 3.5% all sit far below the national average of 28.3%. These were markets with limited exposure to inbound demand to begin with, and therefore relatively insulated from the recent shift in external conditions. Ehime is the exception among the ten, with a foreign share of 14.9% — but its foreign guest nights also grew 35.7%, making it a rare case where domestic and inbound demand rose together.
Prefectures now above pre-pandemic occupancy — Kochi +7.19pt, Nara +6.12pt, Toyama +5.84pt
Because guest nights also reflect the volume of supply, room occupancy is the cleaner read on how tight a market is. Here the January-May 2026 average room occupancy rate is compared with the same months (January-May) averaged over 2015-2019 as the pre-pandemic benchmark. Nationally, January-May 2026 came to 58.4% against a 2015-2019 average of 58.7% — essentially back to pre-pandemic levels.
Source: Compiled by the HotelBank Editorial Team from the Japan Tourism Agency’s Overnight Travel Statistics Survey (January-May average for each year)
Kochi stands well above that national average. Its room occupancy rate for January-May 2026 was 53.5%, 7.19 points above the 46.3% averaged over the same months in 2015-2019. Nara follows at 51.9% (+6.12pt versus pre-pandemic), then Toyama at 54.3% (+5.84pt) and Ehime at 59.0% (+4.94pt). Nagano, Tochigi and Niigata are also roughly four points above pre-pandemic levels, giving a leaderboard dominated by regions with deep domestic leisure demand.
| Prefecture | Room occupancy Jan-May 2026 |
2015-19 same-period avg |
vs pre-pandemic | 2025 same period |
YoY change |
|---|---|---|---|---|---|
| Kochi | 53.5% | 46.3% | +7.19pt | 46.3% | +7.18pt |
| Nara | 51.9% | 45.7% | +6.12pt | 50.1% | +1.74pt |
| Toyama | 54.3% | 48.5% | +5.84pt | 50.1% | +4.16pt |
| Ehime | 59.0% | 54.0% | +4.94pt | 57.4% | +1.56pt |
| Nagano | 38.7% | 34.2% | +4.49pt | 36.9% | +1.86pt |
| Tochigi | 51.6% | 47.4% | +4.27pt | 51.2% | +0.46pt |
| Niigata | 43.8% | 39.9% | +3.96pt | 43.5% | +0.34pt |
| Akita | 44.1% | 42.2% | +1.90pt | 41.1% | +2.98pt |
| National | 58.4% | 58.7% | −0.36pt | 59.8% | −1.48pt |
| Tottori | 44.4% | 49.1% | −4.76pt | 48.1% | −3.76pt |
| Osaka | 69.9% | 80.9% | −11.06pt | 77.5% | −7.64pt |
Source: Compiled by the HotelBank Editorial Team from the Japan Tourism Agency’s Overnight Travel Statistics Survey
Four prefectures — Kochi, Toyama, Ehime and Akita — appear in the top ten on both measures, guest nights and occupancy. Two differently constructed indicators pointing the same way makes the movement in these four a comparatively robust signal.
Elsewhere the two measures disagree. Tottori leads the country on guest nights at +27.7%, yet its room occupancy rate of 44.4% sits 4.76 points below its pre-pandemic average of 49.1%. When guest numbers rise without occupancy following, either the denominator — room supply — is growing at the same time, or the survey design change discussed later is affecting the figures. The practical lesson is visible here: do not judge a prefecture’s supply-demand balance on a single indicator.
Did rate follow volume? Year-on-year estimated settled ADR
If demand rises but rate does not move, revenue growth cannot escape the constraint of room count. To test this, the January-May 2026 average estimated settled ADR from MetroEngines Research was compared with the same period a year earlier for the six leading prefectures. The number of properties covered was stable in every month, and no unusually thin month is included.
Source: Compiled by the HotelBank Editorial Team from MetroEngines Research
Across all hotel categories combined, the largest year-on-year gains in estimated settled ADR were Ibaraki at +6.4% (¥6,700 to ¥7,100, N=306-317 properties), Ehime at +6.3% (¥6,700 to ¥7,100, N=204-213 properties) and Kochi at +4.9% (¥7,500 to ¥7,900, N=115-124 properties). Toyama and Akita were more modest at +2.0% each, and Tottori was essentially flat at −0.6%. For reference, over the same period Tokyo was +5.9% (N=1,111-1,151 properties), Kyoto +3.0% (N=580-607 properties), Okinawa +18.4% (N=485-501 properties) and Osaka −13.8% (N=640-653 properties). Note that Osaka’s decline is measured against a base inflated by Expo demand the previous year.
Splitting by hotel category makes the differences clearer. Ryokan estimated settled ADR rose sharply in Ibaraki, up 19.0% (¥7,300 to ¥8,700, N=95-104 properties), followed by Akita (+7.0%), Kochi (+5.0%) and Ehime (+4.4%). Among business hotels, five of the six prefectures recorded gains of 4% or more: Ehime +6.7%, Kochi +5.3%, Tottori +4.6%, Akita +4.5% and Ibaraki +4.5%. Growth in guest numbers is, at least in the business segment, beginning to show up in rate. How the signs break by category across every prefecture is surveyed in H1 2026 ADR YoY: 16 Prefectures Aligned, 31 Split Across 4 Categories.
Toyama runs the other way: against an all-category gain of +2.0%, business hotels were −1.0% and ryokan −4.7%. Set against a demand backdrop of 25.0% growth in guest nights and occupancy 5.84 points above pre-pandemic levels, rate is still catching up. Read from the other side, that means a market with demonstrated demand depth still has headroom on rate, leaving considerable scope for a staged pricing design. Toyama’s rate structure at the municipal level is examined in detail in Toyama’s 14 Municipalities 2026: 3.3x ADR Gap, Four Price Tiers.
How far has inventory sold through? Estimated OCC by hotel category (July 2026)
Because official occupancy statistics take time to compile, a different yardstick is needed to read current conditions. Here MetroEngines Research estimated OCC — an estimate based on OTA-listed inventory — is used to check inventory sell-through by hotel category for July 2026. Note that these figures are estimates derived from the sell-through of inventory offered on OTAs, and differ from a property’s actual overall occupancy rate.
| Prefecture | All properties | Business | City | Resort | Ryokan | Properties / total rooms |
|---|---|---|---|---|---|---|
| Akita | 90.4% | 91.5% | 93.2% | 86.5% | 85.8% | 191 properties / 10,436 rooms |
| Kochi | 87.2% | 88.7% | 91.1% | 84.0% | 79.7% | 157 properties / 7,859 rooms |
| Ibaraki | 85.9% | 85.6% | 85.3% | 92.1% | 85.6% | 305 properties / 18,215 rooms |
| Ehime | 84.6% | 82.5% | 88.9% | 62.4% | 88.5% | 253 properties / 14,307 rooms |
| Tottori | 84.0% | 85.1% | 85.1% | 83.2% | 79.2% | 171 properties / 8,129 rooms |
| Toyama | 82.6% | 86.1% | 85.4% | 83.2% | 84.1% | 169 properties / 12,165 rooms |
Source: Compiled by the HotelBank Editorial Team from MetroEngines Research (July 2026, monthly average on a check-in-date basis)
Akita shows the highest estimated OCC, with all properties at 90.4%, business at 91.5% and city hotels at 93.2% — every major category in the 90s. Kochi is close to the ceiling as well, at 88.7% for business and 91.1% for city hotels. Both prefectures posted double-digit growth in guest nights, so the official statistics for the first half of the year and current inventory sell-through are telling a consistent story.
Ryokan, by contrast, remain in the high 80s or below in all six prefectures, with Kochi at 79.7% and Tottori at 79.2% — a gap of five to nine points behind the business segment. Ryokan carry higher room rates and see demand concentrate heavily on weekends and holidays, so weekday inventory tends to linger. In a market like Ibaraki, where ryokan estimated settled ADR has risen 19.0%, where to strike the balance between rate increases and inventory sell-through becomes the practical question. Categories with few properties — Toyama’s resort segment (83.2%) or Ehime’s (62.4%, covering six properties and 116 rooms) — are easily swayed by a handful of properties and should be treated as reference values.
The lower the foreign-guest share, the stronger the total growth — a correlation of −0.563
The prefecture-level movements described so far are, in fact, connected by a single structural line. Plotting foreign-guest share as of January-May 2025 (inbound dependence) on the horizontal axis against year-on-year growth in January-May 2026 guest nights on the vertical axis, the 47 prefectures form a clearly downward-sloping distribution. The correlation coefficient is −0.563 (N=47).
Source: Compiled by the HotelBank Editorial Team from the Japan Tourism Agency’s Overnight Travel Statistics Survey (N=47 prefectures)
Splitting by quartile of foreign-guest share sharpens the contrast further. The least inbound-dependent group (foreign share 3.4-7.4%, 12 prefectures) had a median year-on-year change in guest nights of +9.86%, with 10 of the 12 positive. The most dependent group (23.5-57.3%, 11 prefectures) had a median of −8.03%, with only 3 of 11 positive.
| Foreign-guest share (Jan-May 2025) | Prefectures | Guest nights YoY, median |
Japanese guest nights YoY, median |
Prefectures positive YoY |
|---|---|---|---|---|
| 1st quartile (3.4-7.4%) | 12 | +9.86% | +9.14% | 10 / 12 |
| 2nd quartile (7.7-12.0%) | 12 | +0.64% | +0.96% | 6 / 12 |
| 3rd quartile (12.2-22.1%) | 12 | +3.34% | +4.24% | 9 / 12 |
| 4th quartile (23.5-57.3%) | 11 | −8.03% | −6.20% | 3 / 11 |
Source: Compiled by the HotelBank Editorial Team from the Japan Tourism Agency’s Overnight Travel Statistics Survey (N=47 prefectures)
It would be wrong, however, to read this correlation simply as “inbound-dependent prefectures are weak.” The fourth quartile contains markets such as Osaka and Kyoto that are directly exposed to the Expo payback, so the shift in external conditions and a special factor overlap. Prefectures with a high foreign share also tend to have far larger absolute demand, and their occupancy levels remain well above the national average of 58.4% — 75.5% in Tokyo and 69.9% in Osaka. What the data shows is not superiority but dispersion: markets with different demand sources respond differently to the same external shock. For more on the country-level skew within inbound demand, see Only 6 of 47 Prefectures Peak in Autumn: Japan’s Inbound Share Map.
Implications for development and investment — read it as a portfolio of demand sources
Placed in the context of development planning and investment decisions, the data raises three points.
First, diversifying demand sources worked to lower portfolio volatility. In the January-May 2026 results, the median year-on-year change in guest nights was +9.86% for the 12 prefectures with low foreign-guest share and −8.03% for the 11 with high share — a spread of nearly 18 points. Urban assets with high inbound exposure hold the advantage on rate level and absolute demand volume, but shifts in external conditions hit them directly. Regional markets driven by domestic demand sit at lower levels, yet in this episode they acted as a buffer. This is a moment where the value of combining the two can be verified against actual data.
Second, few markets are improving on all three of volume, occupancy and rate. Four prefectures — Kochi, Toyama, Ehime and Akita — exceeded both pre-pandemic and prior-year levels on guest nights and room occupancy alike. All four also posted positive year-on-year estimated settled ADR: Kochi (+4.9%), Ehime (+6.3%), Akita (+2.0%) and Toyama (+2.0%). Kochi and Ehime in particular combine occupancy roughly five to seven points above pre-pandemic levels with rate growth of 5-6%, making them among the few markets where volume, occupancy and rate moved together.
Third, current inventory sell-through shows uneven headroom across hotel categories. In the July 2026 estimated OCC, business and city hotels in the six prefectures reached a high 85-93%, while ryokan remained in the 79-88% range. In these growing markets, the relative sell-through headroom sits on the ryokan side — an area where creating weekday and off-peak demand and designing rate work in tandem. The 19.0% rise in Ibaraki’s ryokan estimated settled ADR is one indication that upward room on price exists in that segment.
When considering expansion into regional markets, look beyond prefecture-level averages to the rate structure at the municipal level. Price dispersion within a single prefecture is wide, as set out in Intra-Prefecture ADR Gaps 2026: Median 2.74x, Okinawa Widest at 5.86x and Japan’s Second Cities: 21 Prefectures Where the Capital Isn’t #1.
Methodology and caveats
On the survey design change. To improve statistical accuracy, the Japan Tourism Agency’s Overnight Travel Statistics Survey changed its stratification basis from number of employees to number of guest rooms beginning with the January 2026 survey month. As the Agency itself notes in its trend tables, year-on-year comparisons (both ratios and differences) may include the effect of this revision. The comparisons used in this article — January-May 2026 against the same period in 2025, and against the 2015-2019 average — both straddle the change in basis. In prefectures where small properties make up a large share, changes in real demand and changes in survey design cannot be separated in the figures. The divergence noted earlier in Tottori, where guest nights rose sharply but occupancy remained below pre-pandemic levels, may also be affected by this.
On the period. Prefecture-level guest nights and room occupancy rates have been published as second preliminary figures through May 2026. First preliminary figures are available through June, but prefecture-level analysis uses the cumulative January-May period to prioritise the firmer figures. The national June figure is a first preliminary reading.
On estimated settled ADR. This is an estimate calculated by applying category-specific adjustment factors to the lowest published plan level each property lists on OTAs and similar channels; cross-checked against property-level results disclosed by listed hotel REITs, the median error is approximately 7.5% (tax-exclusive equivalent). It differs from actual transacted rates and accounting figures. All of January-May 2026 is aggregated on a settled historical basis, and months with an unusually small number of covered properties are excluded.
On estimated OCC. This is an estimate based on the sell-through of inventory offered on OTAs and differs from a property’s actual overall occupancy rate. Given how the data accumulates, it reaches a reliable level for check-in dates from 7 May 2026 onward; this article uses July 2026. Categories covering few properties (resort, deluxe and similar) are easily swayed by a small number of properties.
Frequently asked questions
Q. Which prefectures grew guest nights the most in January-May 2026?
A. Tottori and Ibaraki, both up 27.7% year on year, followed by Toyama (+25.0%), Kochi (+23.5%) and Ehime (+23.2%) (Japan Tourism Agency, Overnight Travel Statistics Survey, N=47 prefectures).
Q. Was that growth driven by inbound demand?
A. No. In all ten prefectures with double-digit growth, at least 79% of the increase came from higher Japanese guest nights. The domestic contribution was 97% in Akita and 95% in Toyama, Yamaguchi and Shimane.
Q. Which prefecture is furthest above its pre-pandemic room occupancy rate?
A. Comparing the January-May 2026 average with the 2015-2019 average for the same months, Kochi leads at +7.19 points (53.5% versus 46.3%), followed by Nara (+6.12 points), Toyama (+5.84 points) and Ehime (+4.94 points).
Q. Has rate risen in the prefectures where guest numbers grew?
A. It varies by prefecture. Year on year, the January-May 2026 average estimated settled ADR rose 6.4% in Ibaraki, 6.3% in Ehime and 4.9% in Kochi, while Toyama was up 2.0% and Tottori essentially flat at −0.6%. By category, business hotels rose 4% or more in five of the six prefectures.
Q. What should be kept in mind when reading these year-on-year figures?
A. The Japan Tourism Agency’s Overnight Travel Statistics Survey changed its stratification basis from number of employees to number of guest rooms beginning with the January 2026 survey month, so year-on-year ratios and differences may include the effect of that revision. In addition, January-May 2025 includes the lift the Osaka-Kansai Expo gave the Kansai region, which weighs on that region’s 2026 year-on-year comparison.
Related reading
- Only 6 of 47 Prefectures Peak in Autumn: Japan’s Inbound Share Map
- Toyama’s 14 Municipalities 2026: 3.3x ADR Gap, Four Price Tiers
- Yamaguchi Settled ADR H1 2026: Business +3.4%, City Hotels −6.4%
- Japan’s Second Cities: 21 Prefectures Where the Capital Isn’t #1
- Intra-Prefecture ADR Gaps 2026: Median 2.74x, Okinawa Widest at 5.86x
- June 2026 Occupancy 56.2%: Guest-Nights per Room in 47 Prefectures
- H1 2026 ADR YoY: 16 Prefectures Aligned, 31 Split Across 4 Categories
References and sources
■ Government statistics and official data
- Japan Tourism Agency, “Overnight Travel Statistics Survey” (May 2026 second preliminary figures; June 2026 first preliminary figures)
- Japan Tourism Agency, “Overnight Travel Statistics Survey — trend tables (guest nights and room occupancy rate by prefecture)” (stratification basis changed from number of employees to number of guest rooms beginning with the January 2026 survey month)
- Japan National Tourism Organization (JNTO), “Statistics on Foreign Visitors to Japan”
■ News
- “Inbound visitors post first decline in five years as travel restraint from China bites — H1 2026” (Jiji Press, 15 July 2026)
- “First-half inbound arrivals fall for the first time since the pandemic, JNTO reports: fewer visitors from China” (nippon.com, July 2026)
■ Data sources
This article uses the prefecture-level trend tables of the Japan Tourism Agency’s Overnight Travel Statistics Survey (guest nights and room occupancy rate; May 2026 second preliminary figures and June 2026 first preliminary figures), the Japan National Tourism Organization’s Statistics on Foreign Visitors to Japan, and MetroEngines Research estimated settled ADR (by prefecture and hotel category, January 2025 to July 2026) and estimated OCC (OTA-listed inventory basis, July 2026). Prefecture-level guest nights and room occupancy rates cover N=47 prefectures; the number of properties covered for estimated settled ADR and estimated OCC is stated alongside each table and paragraph in the body text.
■ Calculation assumptions
Guest nights are compared as cumulative January-May 2026 against the same period in 2025, and room occupancy as the average for that period against both the same period in 2025 and the 2015-2019 January-May average. The domestic contribution to the increase is calculated by decomposing the difference between the cumulative January-May figures for 2026 and 2025 into Japanese and foreign guests. Year-on-year estimated settled ADR compares monthly averages for January-May 2025 with those for January-May 2026, excluding months with an unusually small number of covered properties. Estimated OCC is the July 2026 monthly average on a check-in-date basis. The correlation coefficient is the Pearson correlation between foreign-guest share in January-May 2025 and year-on-year growth in January-May 2026 guest nights (N=47).
■ Limitations and caveats
The Japan Tourism Agency’s Overnight Travel Statistics Survey changed its stratification basis from number of employees to number of guest rooms beginning with the January 2026 survey month, so year-on-year ratios and differences may include the effect of that revision. In addition, January-May 2025 includes the lift the Osaka-Kansai Expo gave the Kansai region, which weighs on that region’s 2026 year-on-year comparison. Estimated settled ADR and estimated OCC are both estimates and differ from each property’s actual transacted rates and actual occupancy (see “Metric Definitions Used in This Article” at the top for definitions and error levels). Categories covering few properties are easily swayed by a small number of properties and should be treated as reference values.
■ Market data
- MetroEngines Research — estimated settled ADR (by prefecture and hotel category, January 2025 to July 2026); estimated OCC (OTA-listed inventory basis, July 2026)