

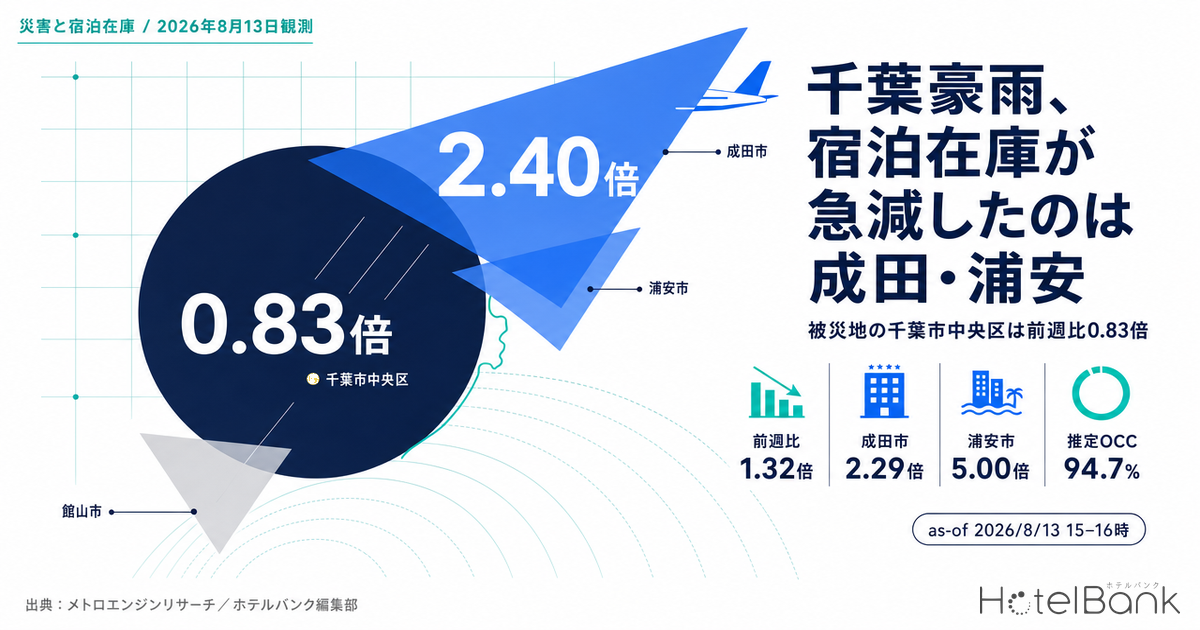
On August 13, 2026, Chiba was hit by record-breaking rainfall. Chuo Ward in Chiba City recorded 351 millimetres of rain in 24 hours — the highest figure ever observed there — and the prefecture applied the Disaster Relief Act to 25 municipalities including Chiba City (as announced on August 14, third bulletin). Media coverage has focused on casualties and physical damage, but what happened on the accommodation side of the market? This article uses daily remaining-inventory data for hotels across Chiba to examine how inventory moved on the day of the disaster, broken down by municipality and by property segment.
Metric Definitions Used in This Article
- OCC (occupancy rate): The share of sold rooms against total rooms in the area (an estimate based on OTA sales inventory). It reflects how listed OTA inventory is being taken up and differs from a property’s actual overall occupancy.
- Remaining rooms: The number of rooms still listed as available inventory on OTAs at each observation point (room basis).
- LT (lead time): Days remaining until check-in. LT1 = the day before, LT0 = same day.
- Same-property set: Aggregation limited to properties observed continuously on every observation day being compared. This removes apparent movement caused by properties entering or leaving the sample.
- Listed price on remaining inventory: The average listed price of inventory still unsold at that point. As remaining rooms decline the mix of that inventory changes, so this is not the same thing as a transacted rate.
- ADR (average daily rate): An estimated settled rate (tax-exclusive equivalent) calculated by applying segment-specific adjustment coefficients to the lowest published plan level each property lists on OTAs (double occupancy, per-room rate, tax-inclusive). Cross-checked against property-level disclosures from listed hotel REITs (91 properties, most recent three months), the median error is roughly 7%. It is an estimate and differs from each property’s actual transacted prices and accounting figures. Area-level ADR is the median across the properties covered (the level of a typical property in that area).
- Data source: MetroEngines Research
On the as-of point: Of the Chiba remaining-inventory data used here, the most recent observation is from 15:00–17:00 JST on August 13, 2026. That is a cross-section taken before the Emergency Heavy Rain Warning was issued and before the flooding around Chiba Station (NHK footage was from about 19:00). Observations from August 14 onward were not yet reflected in the aggregation at the time of writing. What this article captures, therefore, is how far accommodation inventory had moved before the peak of the rainfall arrived — not the full picture after the disaster.
- — The denominator did not shrink. The number of observed properties held steady at 717–723 between August 8 and 13, so the rise in occupancy is not an artefact of properties delisting.
- — Prefecture-wide day-before take-up was 1,622 rooms, or 1.32× the previous Friday. That sits at the top of the past fortnight’s range (195–2,312 rooms) but is not an outlier at the prefectural level.
- — Broken down by municipality: Narita 2.29×, Urayasu 2.40×, Funabashi 5.00×. What moved were the airport and the bayside rail corridors; the prefectural average had cancelled out those regional differences.
- — Chuo Ward in Chiba City, the worst-hit area, came in at 0.83× — slower, with 267 rooms still available as of the August 13 observation. Demand formed not where the damage was, but where transport had stopped.
- — About 78% of the rooms taken up were in the business and city hotel segments. Only inventory holding same-day allocation could serve as a fallback; meanwhile, of the 82 properties that hit zero remaining rooms, 4 hit zero across three or more nights at once, which more likely indicates suspended sales.
First things first — is the occupancy rise just a shrinking denominator?
When estimated occupancy appears to jump immediately after a disaster, the first thing to suspect is not demand but the denominator. If a damaged property stops selling on OTAs, its inventory disappears from the aggregation. Only the fill rate of the remaining properties feeds the average, so occupancy can rise on paper even when nothing has actually sold. There are past cases of exactly this kind of apparent surge right after an earthquake. We tested that trap against real data in Kumamoto Quake 2026, 72 Hours On: 6 Closures vs 17.9% Inventory Loss, which sets out a procedure for separating inventory lost to delisting from inventory absorbed by genuine demand.
So this analysis began by laying out, day by day, the number of properties and rooms entering the aggregation. The short answer: no contraction of the denominator could be found in Chiba. The number of properties observed holding inventory for the August 14 stay date moved within a range of 717 to 723 from August 8 through 13, with no discontinuous drop-out on the day of the disaster. Total observed rooms prefecture-wide moved only 0.6%, from 49,219 rooms as of August 6 to 48,924 rooms as of August 14.
Source: MetroEngines Research; compiled by the HotelBank Editorial Team (stay date August 14, 2026, Chiba)
The bars are remaining rooms and the line is the number of observed properties. Remaining rooms fell sharply, from 4,257 in the August 12 observation to 2,605 in the August 13 observation — while behind that the observed property count actually rose, from 717 to 718. In other words, the decline in inventory is not an artefact of properties dropping out of the sample. All analysis from here on is done on a same-property set basis, limited to properties observed continuously across every observation day being compared.
Prefecture-wide, this is the top of the normal range — 1.32× the previous Friday
Next, how much inventory actually moved across the prefecture. For the stay date of Friday August 14, the August 13 observation — the day before — shows remaining rooms falling from 4,135 to 2,513, a decline of 1,622 rooms in a single day (same-property set observed on both August 12 and 13: N=715 properties, 47,138 rooms). Estimated OCC rose 3.5pt, from 91.2% to 94.7%.
That figure alone, however, does not license the claim that the disaster caused a demand surge. Day-before take-up routinely runs in the 1,000–2,000 room range even in normal conditions. Over the past fortnight (stay dates July 30 to August 14), day-before take-up ranged from a low of 195 rooms to a high of 2,312. The equivalent Friday a week earlier (August 7) was 1,226 rooms, which makes the 1,622 rooms on August 14 a 1.32× reading. Higher, yes — but hard to call exceptional.
Source: MetroEngines Research; compiled by the HotelBank Editorial Team (same-property set; stay date Aug 14 N=703 properties / 45,043 rooms, stay date Aug 7 N=687 properties / 47,660 rooms)
Comparing the two lines, August 14 — mid-Obon — tracks consistently higher than the previous week, showing that inventory was already thin to begin with. At LT8, estimated OCC stood at 89.1% (for the August 14, 2026 stay date, observed August 6, same-property set), 7pt above the 82.0% recorded at the same point the previous week. The sequence, in other words, is that heavy rain landed on a market already close to selling out on Obon demand. Our own analysis published on August 13 of nationwide T-1 peak days over Obon 2026 likewise found that the peaks fell on August 8 and August 13 rather than August 15.
Writing “the disaster filled the hotels” on the strength of the prefecture-wide aggregate alone would be going too far at this point. Reading the market’s response requires one more level of granularity.
What moved: the airport and the bay. What didn’t: the disaster’s core and southern Boso
The table below compares day-before room take-up by municipality against the equivalent Friday a week earlier. Against a prefectural average of 1.32×, the regional spread is extreme.
| Municipality | Properties | Rooms | Aug 7 (Fri) rooms taken |
Aug 14 (Fri) rooms taken |
vs prior week | Estimated OCC Aug 12 → Aug 13 obs. |
|---|---|---|---|---|---|---|
| Narita | 29 | 8,639 | 174 | 398 | 2.29× | 88.6→93.2% |
| Urayasu | 32 | 10,879 | 127 | 305 | 2.40× | 95.1→97.9% |
| Mihama Ward, Chiba City | 12 | 4,139 | 168 | 321 | 1.91× | 90.3→98.0% |
| Funabashi | 13 | 1,093 | 18 | 90 | 5.00× | 86.0→94.2% |
| Ichihara | 24 | 1,282 | 19 | 38 | 2.00× | 92.2→95.2% |
| Kashiwa | 14 | 1,893 | 34 | 41 | 1.21× | 82.7→84.8% |
| Chuo Ward, Chiba City | 29 | 3,719 | 137 | 114 | 0.83× | 89.8→92.8% |
| Kamogawa | 52 | 1,281 | 26 | 16 | 0.62× | 93.1→94.4% |
| Ichikawa | 10 | 1,034 | 34 | 14 | 0.41× | 90.8→92.2% |
| Minamiboso | 87 | 1,109 | 44 | 18 | 0.41× | 94.6→96.2% |
| Kisarazu | 20 | 1,641 | 54 | 17 | 0.31× | 94.6→95.7% |
| Tateyama | 72 | 868 | 15 | −29 (inventory returned) | — | 96.5→93.2% |
Source: MetroEngines Research; compiled by the HotelBank Editorial Team. Same-property set basis; only municipalities with 300+ rooms and 5+ properties are shown
Source: MetroEngines Research; compiled by the HotelBank Editorial Team (same-property set, day-before room take-up)
What emerges is not inventory moving in one direction across the prefecture, but demand converging on transport nodes. Narita ran at 2.29× the previous week, Urayasu at 2.40×, Mihama Ward in Chiba City — home to Makuhari — at 1.91×, and Funabashi at 5.00×, all in the space of a single day. Each shares the same characteristic: an airport or a bayside rail corridor.
According to news reports, roughly 7,000 people were stranded at Narita Airport as of 04:00 on August 14. The Uchibo and Sotobo lines (Chiba to Awa-Kamogawa), the Sobu Main Line (Chiba to Naruto) and the Narita Express limited express service were all suspended from the first train on the 14th. When the rail network is severed during the period when Obon travel and homecoming demand is in motion, some people are forced to stop mid-journey. Areas with large inventory bases — 8,639 rooms in Narita, 10,879 in Urayasu — most likely functioned as that fallback.
Chuo Ward in Chiba City, the worst affected area, meanwhile absorbed inventory at 0.83× the previous week — a slowdown, if anything. As of the August 13 observation the ward still had 267 rooms available. While reports described people spending the night at Chiba Station, inventory remained on the OTAs. Public data alone cannot settle what accounts for that gap. It is more natural to assume several factors were working at once: flooding making the properties themselves hard to reach, halted trains leaving people stuck at stations, emergency bookings flowing to phone calls or walk-ups, and properties throttling intake while they checked for safety.
Southern Boso presents an even sharper contrast. Minamiboso came in at 0.41×, Kisarazu 0.31× and Kamogawa 0.62× — slower across the board — while in Tateyama inventory increased by 29 rooms. Inventory comes back either because bookings were cancelled or because properties released allocation again. Stays motivated by beaches and leisure take the full force of bad weather and severed transport. Within the same prefecture, on the same day, inventory movement flipped from leisure destinations to transport nodes.
Source: MetroEngines Research; compiled by the HotelBank Editorial Team. Circle size is observed rooms; colour is the ratio to the same weekday a week earlier (blue = accelerating, grey = slowing)
By segment — 80% of rooms taken were business and city hotels
Segmenting by property type makes the breakdown of the inventory that disappeared on August 13 clear. Business hotels accounted for 647 rooms and city hotels for 617, so those two segments alone made up roughly 78% of the 1,622 rooms taken up prefecture-wide.
Source: MetroEngines Research; compiled by the HotelBank Editorial Team (stay date August 14, 2026, same-property set)
| Segment | Properties | Rooms | Remaining Aug 12 → Aug 13 | Rooms taken | Estimated OCC |
|---|---|---|---|---|---|
| Business hotel | 139 | 16,621 | 1,883 → 1,236 | 647 | 88.7 → 92.6% |
| City hotel | 48 | 14,492 | 1,322 → 705 | 617 | 90.9 → 95.1% |
| Resort hotel | 57 | 6,566 | 398 → 246 | 152 | 93.9 → 96.3% |
| Ryokan | 103 | 2,350 | 144 → 112 | 32 | 93.9 → 95.2% |
| Minshuku (guesthouse) | 43 | 356 | 19 → 11 | 8 | 94.7 → 96.9% |
| Deluxe hotel | 8 | 3,862 | 26 → 25 | 1 | 99.3 → 99.4% |
Source: MetroEngines Research; compiled by the HotelBank Editorial Team (same-property set). The table above shows only segments with 5+ properties and 300+ rooms; including segments not shown, prefecture-wide take-up was 1,622 rooms
Deluxe hotels were already close to full as of August 12, at an estimated OCC of 99.3% (for the August 14, 2026 stay date, observed August 12, N=8 properties), leaving almost no room to move. Ryokan and minshuku are small in absolute terms and had virtually no effect on the prefecture-wide picture. What shows through here is a structural point: the properties that can genuinely act as a fallback in an emergency are the business and city segments — those with substantial room counts and same-day allocation on hand.
The 82 properties that hit zero — telling a sell-out from a suspension
For the August 14 stay date, 82 properties that had held inventory as of August 12 showed zero remaining rooms in the August 13 observation. Between them, those properties had held 820 rooms the day before. But a zero reading covers both “sold out” and “stopped selling,” and in a disaster that distinction matters especially.
One clue for separating the two is whether multiple stay dates went to zero simultaneously. If only a single night went to zero, it is natural to read that as demand for that date filling the property. If, on the other hand, several nights from August 14 through 18 all went to zero at once, it becomes more likely that the property temporarily throttled intake for safety checks or facility inspections.
| Stay dates simultaneously at zero | Properties | How to read it |
|---|---|---|
| 1 night only | 67 | Readable as filled by demand for that date |
| 2 nights at once | 11 | Either reading is tenable |
| 3+ nights at once | 4 | More likely a temporary suspension of sales |
Source: MetroEngines Research; compiled by the HotelBank Editorial Team (stay dates Aug 14–18, same-property set)
Of the 82 properties, 67 went to zero on one night only, so most can be read as take-up by same-day demand. Four went to zero across three or more nights at once, located in Chuo Ward, Chiba City (2), Mihama Ward, Chiba City (1) and Funabashi (1) — all areas where damage was reported. We are not naming individual properties, but it is worth noting that all four are several hundred rooms in scale. That means a single property can move the prefecture-wide aggregate by hundreds of rooms, and when such a property suspends sales, prefecture-level averages feel the effect strongly.
Note that inventory going to zero on an OTA, or a listing becoming invisible, does not mean a property has closed or ceased trading. Suspending sales is a reversible action a property can lift at any time; operating status must be confirmed against official announcements from each property or operating company.
How to read price — listed prices on remaining inventory can move either way
Accommodation pricing during a disaster attracts attention easily, but public data has to be handled with care. For the August 14 stay date, the prefecture-wide listed price on remaining inventory fell from ¥30,800 in the August 12 observation to ¥27,700 in the August 13 observation. This does not indicate that prices were cut. As remaining rooms decline, the composition of the inventory still on sale changes, so the average moves mechanically in either direction. If cheaper inventory sells first the average rises; if large, higher-priced properties are left unsold the average falls.
Neither “price gouging occurred” nor “prices were cut” can therefore be inferred from this figure. To look at transacted rate levels, settled monthly data is the appropriate source. How Chiba’s rates have moved over the course of the year is set out on a settled-month YoY basis in Chiba Settled ADR: H1 2026 Beats Last Year, July Turns -8.2%. For reference, estimated settled ADR for July 2026 (a settled month) is shown below.
| Municipality | Estimated settled ADR (July 2026) | Properties covered |
|---|---|---|
| Urayasu | ¥18,200 | N=29 |
| Tateyama | ¥16,200 | N=28 |
| Mihama Ward, Chiba City | ¥10,900 | N=12 |
| Ichikawa | ¥9,800 | N=8 |
| Funabashi | ¥9,300 | N=13 |
| Kisarazu | ¥9,200 | N=12 |
| Chuo Ward, Chiba City | ¥8,900 | N=35 |
| Narita | ¥7,400 | N=29 |
Source: MetroEngines Research; compiled by the HotelBank Editorial Team (July 2026, settled month; tax-exclusive equivalent estimate)
Narita’s estimated settled ADR sits at the low end among Chiba’s major cities. Its airport-adjacent location concentrates limited-service properties that hold thick same-day allocation. Large inventory, restrained rates and easy same-day access — the convergence of those three conditions is likely what lay behind its functioning as a fallback in an emergency.
What this observation tells us
First, occupancy figures immediately after a disaster must always be read together with the population they are drawn from. In Chiba this time, the observed property count held steady at 717–723, confirming that the rise was not an apparent one caused by delisting. Had the same procedure not been followed and occupancy read on its own, the opposite conclusion was entirely possible. When a number moves, the denominator is the first thing to question.
Second, prefecture-level aggregation cancels out regional differences. Prefecture-wide, 1.32× against the previous week is an unremarkable figure — but broken down by municipality the spread ran more than sevenfold, from Narita’s 2.29× to Kisarazu’s 0.31×. Looking only at prefecture-level indicators, that movement is undetectable. For operators and public authorities alike, the granularity required for emergency decision-making sits at the municipal level.
Third, emergency accommodation demand forms not where the disaster struck but where transport stopped. This time, take-up accelerated along the airport and bayside rail corridors, while Chuo Ward in Chiba City — the worst affected — actually slowed. For local governments weighing evacuation centres and support for stranded commuters, the practical implication is that the distribution of damage and the distribution of accommodation demand do not coincide. Chiba Prefecture did in fact open the prefectural government hall to people unable to get home.
Fourth, from a revenue-management perspective, the value of inventory in an emergency comes down to whether same-day allocation is still held. What moved this time was centred on business and city hotels; the deluxe segment, already at an estimated OCC of 99.3% as of August 12 (for the August 14, 2026 stay date, observed August 12), had no capacity to serve as a fallback. In periods like Obon, when inventory is thin to begin with, there is little physical room to respond when something unexpected happens. Put the other way round: designing in a measure of same-day allocation during peak periods is both a revenue opportunity and, at the same time, the region’s own capacity to take people in.
⚠ On the data range of this article: The final observation of the remaining-inventory data used here is from 15:00–17:00 JST on August 13, 2026 — a cross-section taken before the Emergency Heavy Rain Warning was issued and before the flooding in front of Chiba Station. Inventory movement from August 14 onward is not reflected. Figures such as casualties and the scope of the Disaster Relief Act are the values published as of the time of writing (August 14, 2026) and will be updated. For the latest information, please refer to announcements from Chiba Prefecture and the Cabinet Office (Disaster Management).
Related reading
- Japan’s Last Summer Weekends: 82.8% on Aug 22, 81.0% on Aug 29
- Hiroshima Booking Curves: 26.2pt Gap at T-45, Ryokan +10.9pt Late
- Tokyo Early Sep: Booking Curves at T-45/T-30/T-14, OCC 76.0-81.5%
- Kumamoto Quake 2026, 72 Hours On: 6 Closures vs 17.9% Inventory Loss
- Chiba Settled ADR: H1 2026 Beats Last Year, July Turns -8.2%
References and Sources
■ Primary sources (government and public bodies)
- Chiba Prefecture, “Application of the Disaster Relief Act for the disaster caused by the heavy rain from August 13, 2026 (Third Bulletin)” (announced August 14, 2026)
- Chiba Prefecture, “Response to the heavy rain from August 13, 2026”
- Cabinet Office, Director-General for Disaster Management, “Application of the Disaster Relief Act for the disaster caused by the heavy rain from August 13, 2026 [Second Bulletin]” (August 14, 2026)
■ News coverage
- Nikkei, “Record rainfall in Chiba, death toll rises to 8; unstable air continues across the Kanto region” (August 14, 2026)
- Nikkei, “Record rain in Chiba City: families spend the night at the station, many vehicles left on the roads” (August 14, 2026)
- Tokyo Shimbun, “Level 5 Emergency Heavy Rain Warning for Chiba: flooding in front of Chiba Station, prefectural hall opened to stranded commuters”
- NHK, “Widespread flooding around Chiba Station (approx. 19:00)” (August 13, 2026)
- Weathernews, “Record downpour: large-scale flood damage across Chiba Prefecture” (August 13, 2026)
■ Data sources
This article uses our own aggregated data, observing daily the number of rooms listed as sales inventory on OTAs for accommodation properties in Chiba Prefecture (observation dates August 5–13, 2026; stay dates July 30 – August 18, 2026). All municipal and segment aggregations are on a same-property set basis, limited to properties observed continuously across every observation day compared. Estimated settled ADR is the aggregated figure for July 2026 (a settled month).
■ Calculation assumptions
Estimated occupancy is calculated as the share of sold rooms against observed rooms, and is an estimate based on how inventory listed on OTAs is taken up. The ratio to the same weekday a week earlier compares day-before (LT1) rooms taken for the stay dates of Friday August 14, 2026 and Friday August 7, 2026. The municipal table is limited to areas with 300+ rooms and 5+ properties, and the segment table to segments with 5+ properties and 300+ rooms; including entries not shown, prefecture-wide take-up was 1,622 rooms.
■ Limitations and caveats
The final observation is from 15:00–17:00 JST on August 13, 2026, a cross-section preceding the Emergency Heavy Rain Warning and the flooding in front of Chiba Station; inventory movement from August 14 onward is not reflected. Estimated occupancy differs from a property’s actual overall occupancy and cannot capture bookings made outside OTAs, such as by phone or at the front desk. Zero remaining rooms covers both “sold out” and “sales suspended,” and public data alone cannot distinguish between them. Listed prices on remaining inventory move mechanically with changes in inventory mix and cannot be used as evidence of price increases or decreases. Estimated settled ADR is an estimate with a median error of roughly 7% when cross-checked against property-level disclosures from listed hotel REITs.
■ Market data
- MetroEngines Research — daily remaining-inventory data for accommodation properties in Chiba Prefecture (stay dates July 30 – August 18, 2026; observation dates August 5–13, 2026; same-property set basis)
- MetroEngines Research — estimated settled ADR by municipality (July 2026, settled month)