

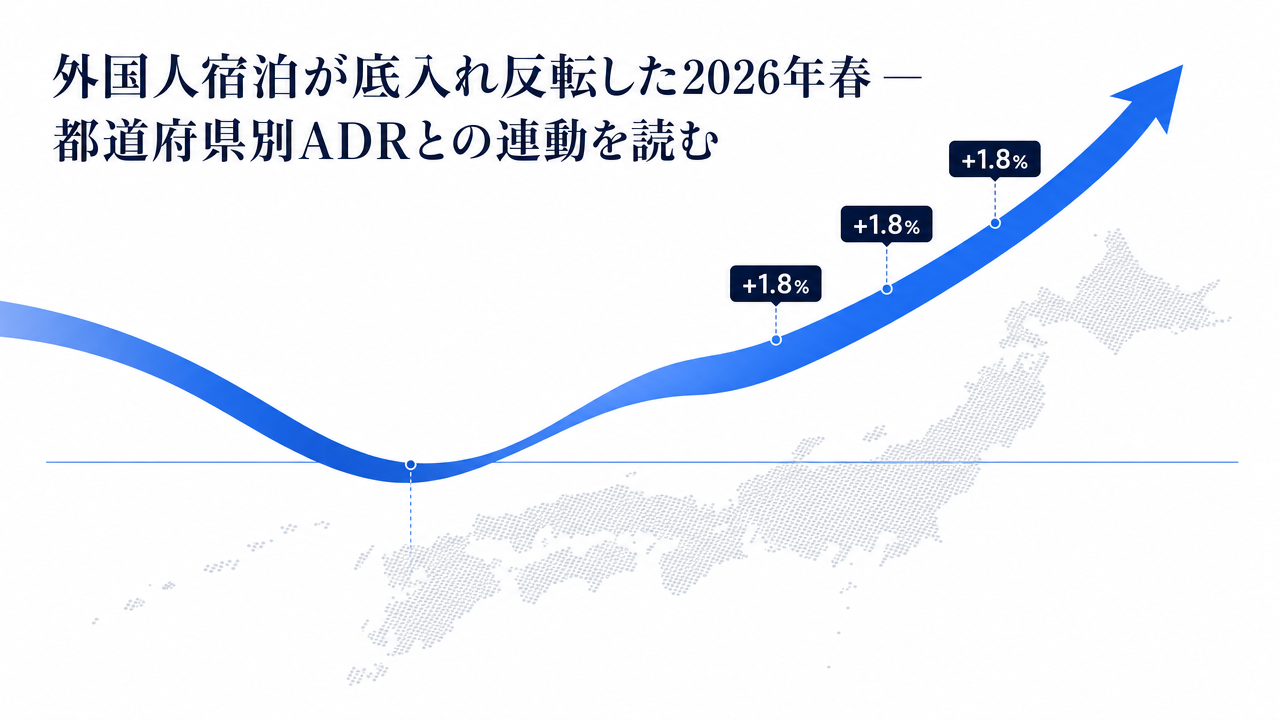
According to the Overnight Travel Statistics Survey released by the Japan Tourism Agency at the end of April 2026, total guest-nights for March 2026 came in at 55.46 million (–0.1% year-on-year), essentially flat. Breaking it down, Japanese guest-nights weakened to 40.39 million (–0.7% YoY), while foreign guest-nights turned positive at 15.08 million (+1.8% YoY). After a long stretch of dragging the total down, foreign overnight stays hit bottom and showed signs of reversal this spring. This article examines how this bottoming-out in foreign overnight stays is linked to movements in prefecture-level OTA-published rates (ADR) tracked by MetroEngines Research.
Metric Definitions Used in This Article
- Total Guest-Nights: The number of guests multiplied by the number of nights stayed, as compiled by the Japan Tourism Agency’s “Overnight Travel Statistics Survey.” This article uses the first preliminary figures for March 2026.
- ADR (Average Daily Rate): Average of published selling prices on OTAs. This differs from actual booked rates (cross-referencing against REIT disclosure data shows OTA-published rates run roughly +25–30% above booked ADR, because unsold high-end plans linger on OTAs and skew the published average upward). Per-room rate for double occupancy (tax included), averaged across all plan types (room-only through plans with meals).
- Data Sources: Japan Tourism Agency “Overnight Travel Statistics Survey” / MetroEngines Research
- — March 2026 total guest-nights were essentially flat at 55.46 million (–0.1% YoY), but foreign guest-nights swung to +1.8% YoY (15.08 million) — the first positive print in roughly 10 months, signaling a bottoming-out and reversal.
- — The composition of that reversal marks a shift from “China-only dependence” to “multi-market dispersion.” Taiwan, Korea, Hong Kong, and Western short-stay visitors offset China’s drop on a volume basis.
- — Prefecture-level published ADR was positive across all six surveyed prefectures. Led by Kyoto at ¥46,400 (+18.4%), followed by Tokyo ¥36,400 (+10.0%) and Osaka ¥24,800 (+9.6%), inbound concentration was visualized as the gradation in ADR growth rates.
- — The facility-count-weighted average ADR across the six major prefectures rose from ¥29,400 in March 2024 to approximately ¥33,200 in March 2026 (+11% level). Seasonal patterns held while both ceiling and floor levels stepped up.
- — On a booked-rate REIT basis, the uptrend also holds. JHR (8985) posted April 2026 ADR of ¥21,100 (+4.6%) and RevPAR of ¥18,100 (+4.1%), meaning published rates, booked rates, and entry data are all pointing positive.
Foreign Overnight Stays Turn Positive for First Time in 10 Months — Breaking Down 55.46 Million Guest-Nights
March 2026 total guest-nights of 55.46 million were down only 0.1% YoY — essentially flat statistically. Yet inside this “sideways” reading, a clear structural shift is underway. Japanese overnight stays fell 0.7% YoY (the 15th consecutive monthly decline) and dragged on the headline, while foreign overnight stays rebounded to +1.8% and offset the negative.
The contribution of foreign overnight stays to the total swung to +0.47 points in March, indicating that foreign demand is emerging from its prolonged downturn and returning to a supporting role. Importantly, JNTO’s March foreign-visitor count was also up +3.5% YoY — the second consecutive monthly gain — so the rebound in the overnight-statistics data is not a single-month wobble but is consistent with entry-side data. In other words, spring 2026 marks an inflection point where multiple data series simultaneously confirmed the “bottoming-out” of foreign overnight stays.
Source: Japan Tourism Agency “Overnight Travel Statistics Survey” (March 2026, first preliminary), compiled by HotelBank Editorial Team
What’s Inside the Reversal — Taiwan, Korea, and the West Fill China’s Gap
The reversal in foreign overnight stays was not a result of uniform growth across all markets. The biggest headwind was China: March 2026 saw a sharp YoY drop in Chinese visitors to Japan. Despite that, the foreign-overnight total managed to land in positive territory because neighboring Asian markets — Taiwan, Korea, and Hong Kong — filled the gap on volume, and Western “short-stay” visitors have kept rising.
This composition ties into the regional dispersion of lodging demand. Western visitors stay longer and tend to venture beyond major cities into the regions. Meanwhile, neighboring Asian visitors are high-repeat travelers who generate revisit demand that doesn’t concentrate solely on the Golden Route. Escaping single-market dependence strengthens the entire lodging market’s resilience against shocks in any one source country. Taken positively, the spring 2026 bottoming-out can be read as the demand-side confirmation that we’ve shifted from “China-only” to “multi-market dispersion.” For more on how Southeast Asian demand is filling “China’s gap” with regional impact, see our analysis of JNTO April -5.5%: China -56.8% Yet Regional ADR Rises as 9 Markets Hit Records, which examines the country mix in detail.
Source: Japan Tourism Agency “Overnight Travel Statistics Survey” / “Statistics of Foreign Visitors to Japan,” compiled by HotelBank Editorial Team. Market-by-market directions reflect the March 2026 trend.
Before Reading the YoY — A Note on the January 2026 Room-Count-Basis Revision
Before comparing the 2026 overnight-statistics data with prior-year readings, an important caveat must be noted. Starting from the January 2026 release, the Japan Tourism Agency revised the stratification variable used to classify lodging facilities from “number of employees” to “number of rooms.” This change reflects the fact that with the spread of unstaffed front desks and labor-saving operations, employee headcount no longer represents facility scale accurately.
The revision is expected to improve coverage of small lodgings, such as simplified accommodations and small ryokans. At the same time, this is the most significant methodology change since 2021, so YoY and month-on-month comparisons from January 2026 onward may carry mixed effects from the methodology revision. Accordingly, the YoY readings cited here — foreign +1.8% and Japanese –0.7% — may include not only pure demand variation but also some statistical-methodology revision effects. The prudent stance is to read the figures as “directional signals” and reserve precise absolute-level interpretation for subsequent secondary preliminary releases.
Prefecture-Level ADR Mirrors the Foreign-Demand Map
How does this bottoming-out in foreign overnight stays show up in price data? According to MetroEngines Research, March 2026 ADRs (published rates, double occupancy, tax included) across the six major prefectures were all positive YoY, with the strength of foreign demand surfacing as regional differentiation in pricing. Kyoto stood out at ¥46,400 (+18.4% YoY, N=1,550 facilities), followed by Tokyo at ¥36,400 (+10.0% YoY, N=1,640 facilities) and Osaka at ¥24,800 (+9.6% YoY, N=873 facilities).
What stands out is that the ranking of ADR growth roughly mirrors the inbound concentration map. Kyoto, Tokyo, and Osaka — the core of the Golden Route — all posted double-digit gains, followed by Hokkaido (+9.0% YoY) and Okinawa (+7.8% YoY) as the receiving destinations for regional dispersion. Meanwhile, Fukuoka, where neighboring-Asia business and circular-tour demand dominates, was more subdued at +3.2% — its market mix is relatively more exposed to the Chinese-visitor decline, and that exposure is reflected in the softer price gain. In short, the bottoming-out of foreign overnight stays is not a uniform national phenomenon; the differences in market composition are visualized as gradations in prefecture-level ADR.
Source: MetroEngines Research, compiled by HotelBank Editorial Team (March 2026, N=facility count per prefecture noted alongside)
| Prefecture | ADR (Mar 2026) | YoY | Facilities (N) |
|---|---|---|---|
| Kyoto | ¥46,400 | +18.4% | 1,550 |
| Tokyo | ¥36,400 | +10.0% | 1,640 |
| Osaka | ¥24,800 | +9.6% | 873 |
| Hokkaido | ¥30,000 | +9.0% | 1,476 |
| Okinawa | ¥26,800 | +7.8% | 1,696 |
| Fukuoka | ¥29,000 | +3.2% | 712 |
Source: MetroEngines Research, compiled by HotelBank Editorial Team (rates are per room for double occupancy, tax included, averaged across all plan types)
ADR Steps Up Beyond Seasonality — Six-City Rate Trends
The prefecture-level ADR rise is not a single-month event. Overlaying the facility-count-weighted average ADR for the six major prefectures by year shows that the price level itself is stepping up year after year. March 2024 was approximately ¥29,400, March 2025 was approximately ¥29,900, and March 2026 reached approximately ¥33,200 — roughly +11% YoY. Seasonal patterns (the spring/summer/fall busy peaks) are preserved, while both the ceiling and floor of each month rise in tandem.
This sustained step-up is the flip side of the foreign-demand bottoming-out functioning as a price floor. Published rates haven’t broken down even as domestic demand has softened, because the return of foreign visitors is absorbing the upper price tier and lifting the entire price range. Viewed constructively, the more multi-market dispersion advances, the more the ADR floor strengthens against shocks in any single market (for context on how high-rate, long-stay neighboring-Asia demand is lifting Kyoto, Hokkaido, and Okinawa ADRs, see Singapore Inbound 2026 Summer — 7-8 Night Stays Drive Kyoto/Hokkaido/Okinawa ADR).
Source: MetroEngines Research, compiled by HotelBank Editorial Team (facility-count-weighted average ADR across the six major prefectures)
REIT Booked ADR Also Trends Up — Consistency with Published Rates
Beyond published OTA rates, the booked-rate side also confirms the price uptrend. Japan Hotel REIT Investment Corporation (8985), which holds many urban hotels with a high inbound-guest mix, reported April 2026 operating results showing ADR at ¥21,100 (+4.6% YoY) and RevPAR at ¥18,100 (+4.1% YoY), with occupancy essentially flat at OCC 85.8% — a rate-led growth pattern.
One caveat: OTA-published ADR is the average of currently listed selling prices and is methodologically distinct from booked rates (published rates run on average roughly +25–30% higher than booked rates). Therefore, comparing the absolute values is less meaningful than comparing YoY direction across the two series. The fact that both published rates and booked rates are pointing positive reinforces that the spring 2026 rate gain is not a transient “list-price-only” optical effect but a step-up backed by real demand.
About REIT Metrics: The REIT ADR/RevPAR figures used in this article are from each company’s monthly operating disclosures (official) and are booked-rate values. The OTA-published ADR has a different aggregation basis. Comparisons here focus on YoY direction rather than absolute values.
Summary — How to Capitalize on the Post-Bottoming-Out Spring
March 2026 overnight statistics looked “roughly flat” on the surface but contained a structural turning point inside: the bottoming-out and reversal of foreign overnight stays. The drop in Chinese visitors was offset by Taiwan, Korea, and Western source markets, and as multi-market dispersion advanced, the resilience of the entire lodging market strengthened. This demand map is also clearly visible in price data as the double-digit ADR gains across Kyoto, Tokyo, Osaka, and other key prefectures.
That said, the January 2026 room-count-basis revision means YoY comparisons may include statistical-methodology effects. The prudent stance is to treat the numbers as directional signals and wait for the secondary preliminary release for refinement. Even so, the fact that published rates, booked rates, and entry data are all pointing positive strongly suggests that spring 2026 was not a mere sideways print but a likely inflection point. Where you capture the post-bottoming demand — by source market and by area — will shape the next leg of rate growth. The tailwind of multi-market dispersion is best converted into area-specific pricing strategy to unlock constructive growth opportunities.
Related Articles
- JNTO April 3.69M Visitors at -5.5% — China -56.8%, Yet Regional ADRs Rise: 9 Markets at Record Highs Show Structural Shift in Japan Inbound Demand
- Singapore Inbound 2026 Summer — 7-8 Night Stays Drive Kyoto/Hokkaido/Okinawa ADR
- USD/JPY Nears 160 x Japan Summer 2026 Inbound: Tipping Point for Ultra-Luxury Ryokan Demand
- Shuri Castle Revival Lifts Naha Hotel Demand — Supply & ADR Upside
References & Sources
- Japan Tourism Agency, “Overnight Travel Statistics Survey (February 2026 Second Preliminary, March 2026 First Preliminary)” (April 30, 2026)
- Japan Tourism Agency, Overnight Travel Statistics Survey Press Release (PDF)
- Japan Tourism Agency, “Overnight Travel Statistics Survey (January 2026 First Preliminary, on the Revision to Room-Count Basis)”
- Japan Tourism Agency, “Overnight Travel Statistics Survey” landing page
- MetroEngines Research — Prefecture-level OTA-published price data (ADR, January 2024–March 2026, N=facility count per prefecture noted in the text and tables)
- REIT monthly operating disclosures — Japan Hotel REIT Investment Corporation (8985), April 2026 operating results