

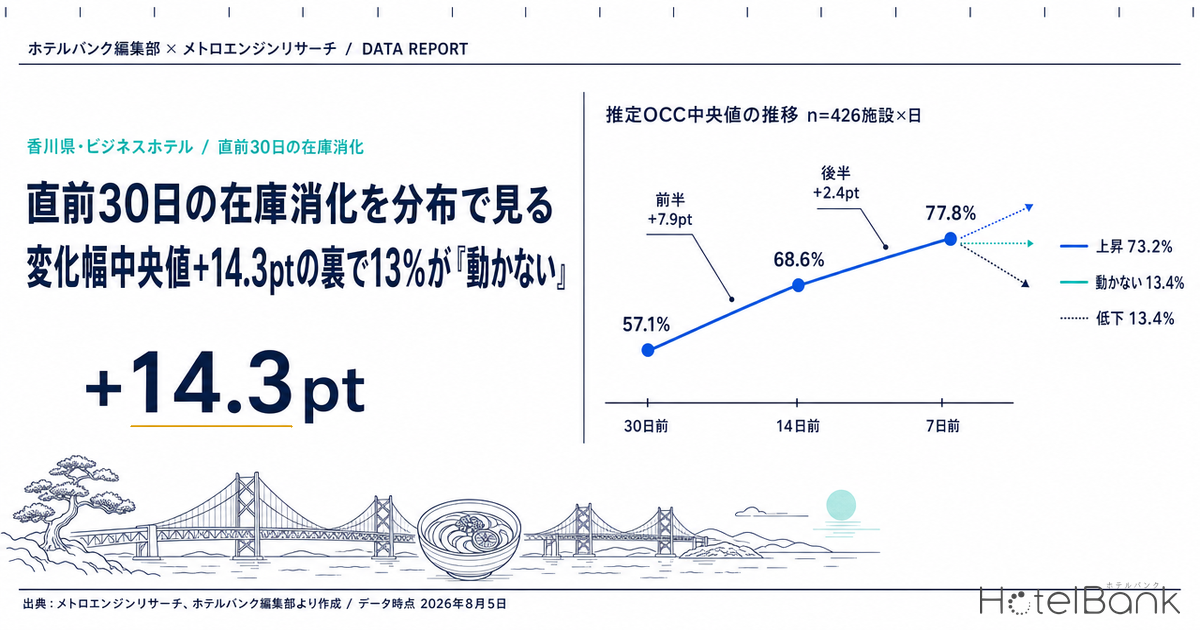
For business hotels in Kagawa Prefecture, we mapped the distribution of inventory sell-down at three fixed checkpoints — 30, 14 and 7 days before the stay date — at the individual-property level. Median estimated OCC (based on OTA-listed inventory) ran 57.1% at 30 days out → 68.6% at 14 days → 77.8% at 7 days (n=426 property-days, pooled across 10 stay dates from 11 July to 12 August 2026). Matching the same property at 30 days and 7 days out, the median change was +14.3pt. That headline hides a split, however: 73.2% of property-days rose (312 cases), 13.4% moved less than ±1pt and were effectively “flat” (57 cases), and 13.4% actually declined into the 7-day mark (57 cases, median −10.0pt). The final 30 days run in three distinct patterns. This article translates that distribution into operating terms, on an anonymized, quantile basis.
About the data in this article
Scope: Kagawa business hotels, N=163 properties (of which 85 have inventory-trend data; 35–47 properties per stay date meet this article’s analysis conditions). The price metric is estimated settled ADR (the transaction price level inferred from OTA and similar sales data, tax-exclusive equivalent); occupancy is an estimate based on OTA-listed inventory. Full definitions appear at the end of the article. Data as of 5 August 2026.
- — Estimated OCC for Kagawa business hotels at 7 days out was 77.8% (median at the property level across 10 stay dates from 11 July to 12 August 2026, n=426 property-days). From 57.1% at 30 days out, the median change is +14.3pt.
- — The build-up is front-loaded. 30 days → 14 days adds +7.9pt; 14 days → 7 days adds only +2.4pt. The main battleground for rate changes sits earlier than 14 days out.
- — The distribution splits three ways: 73.2% rising, 13.4% flat, 13.4% declining. The median alone cannot tell you which type your own hotel is.
- — The 57 “flat” cases divide into 24 early-fill cases (90%+ at 30 days out) and 26 low-and-static cases (under 70%) — and the right response is the exact opposite in each.
- — The widest room to move is 40–69% at 30 days out × 80–149 rooms, at +24.4pt. At the same starting level, properties with 79 rooms or fewer manage only +12.7pt.
- — On the price side, estimated settled ADR for July 2026 was ¥6,952 (−7.5% year on year). Rooms are filling, but the rate is not following.
The build-up in the final 30 days is skewed to the first half
Start with the overall picture. Covering 67 business hotels in Kagawa across 426 property-days, we took estimated OCC at 30, 14 and 7 days before the stay date and organized it into quartiles at the property level. The medians are 57.1% at 30 days, 68.6% at 14 days and 77.8% at 7 days. The first quartile runs 33.3% → 50.0% → 57.1%; the third quartile runs 75.2% → 89.9% → 92.6%.
What deserves attention is that this build-up is skewed toward the first half of the final 30 days. Taking the change interval by interval within the same property, the median for 30 days → 14 days is +7.9pt, while 14 days → 7 days delivers only +2.4pt. In other words, against the intuition that “bookings come in at the last minute,” the actual accumulation is largely settled by two weeks out. This shape suggests that results can hinge on whether rate changes take effect before the 14-day mark. For how much this front-loading varies by hotel category, our article Tokyo Aug 14: 434 Hotels, Front-Loaded 10.8% vs Late-Surge 9.4% breaks down the same inventory sell-down for a single stay date.
Source: MetroEngines Research; compiled by the HotelBank Editorial Team
Broken out by stay date, the differences in pace become sharper still. Saturday 18 July 2026 was the first day of a three-day weekend including Marine Day: the median at 30 days out was already high at 76.0% (n=36), and it reached 100.0% by 7 days out. The median change was +22.5pt and the share of flat properties was the lowest of any date at 5.6%. By contrast, Saturday 8 August — the weekend before Obon — went from 67.4% at 30 days out to 88.9% at 7 days (n=45), a median change of just +8.7pt, with 24.4% of properties flat, the highest across all 10 dates. A high level and late-stage movement are two different things.
| Stay date | Properties | 30 days out median |
14 days out median |
7 days out median |
30 → 7 days change (median) |
Share of flat properties |
|---|---|---|---|---|---|---|
| Jul 11 (Sat) | 44 | 56.5% | 66.8% | 75.2% | +9.6pt | 15.9% |
| Jul 15 (Wed) | 35 | 58.0% | 59.6% | 70.4% | +13.5pt | 11.4% |
| Jul 18 (Sat, first day of three-day weekend) | 36 | 76.0% | 98.0% | 100.0% | +22.5pt | 5.6% |
| Jul 22 (Wed) | 46 | 47.2% | 61.0% | 67.9% | +13.8pt | 10.9% |
| Jul 25 (Sat) | 47 | 58.9% | 60.1% | 69.1% | +7.6pt | 12.8% |
| Jul 29 (Wed) | 47 | 47.6% | 63.6% | 68.5% | +19.6pt | 12.8% |
| Aug 1 (Sat) | 40 | 54.2% | 61.9% | 74.2% | +13.8pt | 10.0% |
| Aug 5 (Wed) | 43 | 50.0% | 58.8% | 68.9% | +14.6pt | 16.3% |
| Aug 8 (Sat) | 45 | 67.4% | 88.6% | 88.9% | +8.7pt | 24.4% |
| Aug 12 (Wed, day before Obon) | 43 | 62.6% | 81.0% | 88.6% | +20.0pt | 11.6% |
Source: MetroEngines Research; compiled by the HotelBank Editorial Team
Grouped by day of week, the five Saturdays (n=212 property-days) run 63.1% at 30 days out → 83.4% at 7 days, a median change of +13.1pt; the five Wednesdays (n=214 property-days) run 50.8% → 73.2%, or +15.9pt. Saturdays sit at a higher level, but Wednesdays capture slightly more ground over the final 30 days. Demand on Saturdays is locked in early, while weekdays build up close to arrival — a two-layer structure characteristic of Kagawa’s business hotels.
Seven in ten rose, one in ten stayed flat, one in ten fell — the three types in the distribution
Look only at the median and this market appears to be one that “builds +14.3pt over the final 30 days.” Open up the property-level distribution, however, and the pace splits cleanly into three. Of 426 property-days, 312 (73.2%) had estimated OCC at 7 days out at least 1pt above the 30-day reading, with a median gain of +22.2pt; 57 (13.4%) moved less than ±1pt; and 57 (13.4%) fell by 1pt or more, with a median of −10.0pt.
Re-cutting this three-way split by quartile of the 30-day level sharpens the outline further. The top quartile by estimated OCC at 30 days out (n=107, median 86.7% at 30 days) reaches 94.8% at 14 days and 94.3% at 7 days, for a median change of 0.0pt. These properties are already full and have almost no room to add over the final 30 days. The bottom quartile (n=106, median 13.9% at 30 days) climbs to 31.0% at 14 days and 48.2% at 7 days, a median change of +29.6pt — the largest build of any group. The middle 50% (n=213) runs 57.1% → 68.0% → 76.7%, or +18.0pt, a straightforward shape.
Source: MetroEngines Research; compiled by the HotelBank Editorial Team
The fourth line is the declining group (n=57), which runs 74.3% at 30 days out → 67.9% at 14 days → 63.6% at 7 days, with estimated OCC falling as arrival approaches. Because the metric is based on OTA-listed inventory, this decline mainly reflects sellable allocation being opened (or returned) later. It can be read as properties that had reached a little over 70% at the 30-day mark releasing additional inventory in the final two weeks — a moment when close-in rate decisions come under scrutiny. At 7 days out, properties with no listed inventory visible on OTAs (estimated sold-out rate) accounted for 14.8% of the total, and 21.4% had reached 95% or above.
The 57 “flat” cases: full, or stalled?
Operationally, the most important question is what sits inside those 57 cases (13.4%) that moved less than ±1pt. Split by the level at 30 days out, they fall into two groups of opposite character. Twenty-four cases had already reached 90% or more at the 30-day mark (median 100.0% at 30 days). These are not “not moving” so much as having no need to move — they filled up before the final 30 days even began. The other group is 26 cases that were below 70% at 30 days out, with a median of 24.3% at both 30 and 7 days. They arrive at the week before the stay date with only a quarter of the house sold, exactly as they stood a month earlier. The remaining 7 cases fell in the middle band.
| Type | Cases (property-days) | 30 days out, median | 7 days out, median | How to read it |
|---|---|---|---|---|
| Early-fill (90%+ at 30 days out, flat) | 24 | 100.0% | 100.0% | Filled early. The side that should audit rate left on the table |
| Low-and-static (under 70% at 30 days out, flat) | 26 | 24.3% | 24.3% | The final 30 days are barely functioning. The side that should rethink demand capture |
| Middle band (70–90% at 30 days out, flat) | 7 | — | — | Too few cases to report quantiles |
Source: MetroEngines Research; compiled by the HotelBank Editorial Team
Cut by size, this “stillness” turns out to be related to property scale. Properties with 79 rooms or fewer (n=226 property-days) show a median change of +10.0pt and a flat share of 18.6%; those with 80–149 rooms (n=132) show +20.1pt and 4.5%; those with 150 rooms or more (n=68) show +15.6pt and 13.2%. The band that moves most over the final 30 days is 80–149 rooms, where the flat share is a strikingly low 4.5%. Mid-size properties have more scope to adjust inventory and rate on a daily basis, while smaller properties have fewer units — so a single booking moves the ratio less — and tend toward a more fixed approach to releasing inventory.
Combining “level at 30 days out” and “room count” on two axes makes the map of available movement explicit. The table below takes the median 30-day → 7-day change for each band of estimated OCC at 30 days out (rows) and each room-count band (columns).
| Estimated OCC at 30 days out | 79 rooms or fewer | 80–149 rooms | 150 rooms or more |
|---|---|---|---|
| 90% or above | +0.0pt (n=34) | +0.9pt (n=7) | +0.2pt (n=4) |
| 70–89% | +2.9pt (n=37) | +13.0pt (n=37) | +13.7pt (n=17) |
| 40–69% | +12.7pt (n=87) | +24.4pt (n=55) | +16.3pt (n=25) |
| Below 40% | +31.1pt (n=67) | +30.0pt (n=33) | +25.6pt (n=22) |
Source: MetroEngines Research; compiled by the HotelBank Editorial Team
There are two ways to read this. First, the 90%-or-above row shows a change of close to zero in every size band (+0.0 to +0.9pt), confirming that there is “no room to move” regardless of scale. Once a date lands here, it should be treated as a rate question rather than an inventory question. Second, scale matters most in the 40–69% band at 30 days out, where 79 rooms or fewer manage +12.7pt against +24.4pt for 80–149 rooms — a gap of roughly two to one. From the same starting point of “half full at 30 days out,” mid-size properties build nearly twice as much over the final 30 days. If your hotel has 79 rooms or fewer and sits in this band, +12.7pt is the realistic baseline, and setting +24.4pt as a target would be overreaching. Conversely, if you have 80–149 rooms and are stuck around +12pt, there is headroom relative to the median for your size band.
For context, the monthly level for Kagawa business hotels as a whole was an estimated OCC of 86.5% (as of July 2026, based on OTA-listed inventory, weighted by room count across the prefecture, 79–84 observed properties, 7,663 total rooms). That it comes out above this article’s property-level median (77.8% at 7 days out) is because larger properties sell down further — consistent with the results by size band. It is worth remembering that an area average and your own position can differ by nearly 10pt on weighting alone.
Whether that 86.5% is high or low is easier to judge alongside neighboring prefectures and the major metros. The main prefectures of Shikoku and Chugoku all fall within an 82–89% range, and Kagawa sits in the middle of that group. It is 6.7pt below Tokyo (93.2% as of July 2026) and 1.8pt below Osaka (84.7%), meaning Kagawa’s level itself is typical for a regional core city. The differentiation lies not in the level, but in the pace over the final 30 days that this article has been examining.
| Prefecture | Estimated OCC (July 2026) | Observed properties | Rooms covered |
|---|---|---|---|
| Tokyo | 93.2% | 825–873 | 125,487 |
| Kochi | 88.7% | 57–64 | 5,414 |
| Okayama | 88.5% | 83–88 | 10,006 |
| Hiroshima | 87.3% | 159–168 | 18,776 |
| Kagawa | 86.5% | 79–84 | 7,663 |
| Tokushima | 85.3% | 50–62 | 4,060 |
| Osaka | 84.7% | 447–453 | 72,938 |
| Ehime | 82.5% | 89–91 | 8,651 |
Source: MetroEngines Research; compiled by the HotelBank Editorial Team
The price side — confirmed estimated settled ADR and current projections
Separating the inventory story from rate leads to poor judgment, so it is worth setting out the price side as well. Comparing confirmed figures year on year, estimated settled ADR for Kagawa business hotels was ¥6,952 in July 2026 (n=92 properties) against ¥7,512 in July 2025 (n=86), or −7.5%. June was ¥6,490 (n=91) against ¥6,547 (n=87), or −0.9%; May was ¥7,474 (n=90) against ¥7,788 (n=88), or −4.0%. January, by contrast, was ¥7,768 (n=87) against ¥6,206 (n=87), a gain of +25.2% — an asymmetric shape in which the first part of the year ran ahead while early summer onward fell below the prior year.
Source: MetroEngines Research; compiled by the HotelBank Editorial Team
From August onward the figures are not yet confirmed, so they are estimates based on current sales conditions: ¥10,005 for August (n=90 properties), ¥9,777 for September (n=89), ¥9,920 for October (n=85), ¥9,714 for November (n=77) and ¥9,219 for December (n=71). These values can shift with future sales activity, and a straight comparison with the prior year’s confirmed figures is best left until month-end confirmation. What matters here is less the level itself than the combination: in a market where inventory sell-down over the final 30 days runs a median +14.3pt, the price side has posted a run of months below the prior year on a confirmed basis. It is worth checking your own numbers for the possibility that the house is filling while the rate is not following.
For revenue managers running business hotels in Kagawa — implications and an action plan
(1) “It comes in at the last minute” is only half true. For Kagawa business hotels, the build over the final 30 days is a median +7.9pt from 30 to 14 days out and +2.4pt from 14 to 7 days. Most of the accumulation is finished by two weeks out. Move rates after the 14-day mark and there is simply little demand left to move. There is room to redesign the rate-change calendar one to two weeks earlier than instinct suggests.
(2) Judge your position by change, not level. The top quartile by estimated OCC at 30 days out (median 86.7%) shows a median change of 0.0pt over the final 30 days and a flat share of 29.0%. Sitting still at a high level is not necessarily healthy full occupancy — it may be a sign of having filled too early. The bottom quartile (13.9% at 30 days out) builds +29.6pt. Compare not just “what percentage am I at 30 days out” but “how many points did I move from there” against these quantiles.
(3) Flat properties come in two kinds, and the responses are opposite. The 57 cases moving less than ±1pt split into 24 early-fill cases at 90%+ at 30 days out and 26 low-and-static cases below 70% (median 24.3% at both 30 and 7 days). The first calls for an audit of rate left on the table; the second calls for rethinking demand capture itself. Same “not moving,” entirely different prescriptions. Start by sorting which one you are, using the level at 30 days out.
(4) Mid-size properties have the widest room to move. The 80–149 room band shows a median change of +20.1pt and a flat share of 4.5% — the most active group among Kagawa’s business hotels. If your change falls below that within the same band, there is likely headroom in how inventory is released or how often rates are revised. For 79 rooms or fewer (+10.0pt, 18.6%), interpret the figures bearing in mind that a single booking moves the ratio more easily.
| Time horizon | Action | Decision trigger (check against the figures in this article) | Purpose |
|---|---|---|---|
| 30 days out (T-30) | Record your own OCC at 30 days out for the target date and check which market quartile it falls into (33.3% / 57.1% / 75.2%) | If it is well below the median of 57.1%, or above the third quartile of 75.2% | Settle first whether this is a date you still have to build, or one that is already full |
| 30 days out (T-30) | Consider whether the center of gravity of the rate-change calendar can be shifted earlier than 14 days out | If your revisions are concentrated after the 14-day mark, against a market split of +7.9pt (30→14 days) and +2.4pt (14→7 days) | Apply measures to the interval where movable demand still remains |
| 14 days out (T-14) | Calculate your change since 30 days out and compare it with the market median of +14.3pt | If the change is under ±1pt and the 30-day level was below 70% (the same shape as the 26 low-and-static cases) | Detect a “not moving” state before the stay date arrives |
| 14 days out (T-14) | Review remaining scope to release final inventory, and check that multi-night conditions and minimum-stay settings are not shutting out residual demand | If your change is below the +20.1pt median within the 80–149 room band | Sell through every available unit in the band with the widest room to move |
| 7 days out (close-in) | For dates sitting still at a high level, review after the fact whether rate was left on the table | Dates at 90%+ at 30 days out with a change under ±1pt (the same shape as the 24 early-fill cases) | Feed this into the opening rate for the next equivalent weekday and demand period |
| Looking to next month | Line up your own confirmed-month ADR against the market’s confirmed estimated settled ADR on the same basis (July 2026: ¥6,952, n=92 properties) | If inventory sell-down is at or above the market but your confirmed ADR is below the same month last year | Correct a state of winning occupancy without the rate, ahead of the next demand period |
Source: MetroEngines Research; compiled by the HotelBank Editorial Team
Conclusion — three yardsticks for Kagawa’s final 30 days
First, the split between intervals. The front-loaded shape of +7.9pt from 30 to 14 days out and +2.4pt from 14 to 7 days (n=426 property-days) is the baseline for timing measures at Kagawa’s business hotels. Second, change rather than level. The market’s median change is +14.3pt, but it divides into 73.2% rising, 13.4% flat and 13.4% declining — and level alone cannot tell you which group you belong to. Third, sorting what “flat” means. Whether a property was above 90% or below 70% at 30 days out determines whether the same flat line calls for opposite responses.
Track these three at the same fixed checkpoints every month (30, 14 and 7 days out) and you can place your own pace within the market distribution, rather than reacting to a single sold-out or disappointing date. Some dates run like Saturday 18 July, climbing from 76.0% at 30 days out to 100.0% at 7 days; others look like Saturday 8 August, holding a high level while nothing moves close in (a flat share of 24.4%). Judging by where you sit in the distribution, rather than by the story of any one date, is what raises the precision of the final 30 days.
About the data
| Definition of estimated OCC | Occupancy based on OTA-listed inventory = 100 − 100 × rooms still listed on OTAs ÷ total rooms. It is an estimate based on how listed inventory sells down, and its definition differs from actual room occupancy (it tends to read higher). This article labels it “estimated OCC (based on OTA-listed inventory).” |
| Booking curve | Based on observations from 90 days before the stay date through to the most recent reading. The fixed checkpoints used in this article are the three points at 30, 14 and 7 days out. |
| Definition of estimated settled ADR | The transaction price level (tax-exclusive equivalent) inferred from OTA and similar sales data (lowest-plan level × category coefficient, ensembled across multiple channels). Past months are confirmed values; the current and future months are estimates based on current sales conditions. Median error against published operating results is 6.6%. |
| Breakdown of N | Inventory sell-down analysis: Kagawa business hotels, 163 properties in scope / 85 with inventory-trend data / of which those meeting the condition that peak listed inventory reaches at least 30% of total rooms (35–47 properties per stay date, 67 distinct properties, 426 property-days in total). The stay dates covered are 11, 15, 18, 22, 25 and 29 July and 1, 5, 8 and 12 August 2026 — 10 dates. Estimated settled ADR: n=71–92 properties (varies by month). Prefecture-wide monthly estimated OCC: 79–84 observed properties. |
| Checkpoint matching rule | For each of the 30-, 14- and 7-day checkpoints, where an observation at exactly that lead time was missing, it was substituted with the nearest observation within ±3 days (beyond ±3 days, that property and checkpoint were excluded as missing). After this treatment, the valid counts in the 10-date pool are 425 at 30 days, 426 at 14 days and 426 at 7 days (property-days). |
| Calculation of quantiles and change | Medians and quartiles are calculated treating each property-day as one sample (no property-level weighting). Change is the difference between the 30-day and 7-day readings for the same property on the same stay date; “flat” means a change under ±1pt, while “rising” and “declining” mean changes of +1pt or more and −1pt or more respectively. Only the prefecture-wide monthly estimated OCC (86.5%) is room-count weighted, so its weighting method differs from the property-level medians. |
| Data as of | Data as of 5 August 2026. Sales conditions and inventory change daily, so the figures in this article are a snapshot at the time of retrieval. |
Source: MetroEngines Research; compiled by the HotelBank Editorial Team
References and sources
■ Data sources
MetroEngines Research & Consulting inventory-trend aggregation and estimated settled ADR aggregation for business hotels in Kagawa Prefecture (both retrieved 5 August 2026). Inventory trends are daily observations of rooms still listed on OTAs from 90 days before the stay date through to the most recent reading; estimated settled ADR is inferred from OTA and similar sales data. The prefecture-wide monthly estimated OCC (86.5%, as of July 2026) is the room-count weighted value from the same aggregation.
■ Calculation assumptions
Estimated OCC = 100 − 100 × rooms still listed on OTAs ÷ total rooms. Scope is limited to properties whose peak listed inventory reached at least 30% of total rooms (to exclude properties listing an extremely small allocation). The checkpoints are 30, 14 and 7 days out; only where an observation at that lead time is missing is it substituted with the nearest observation within ±3 days. Medians and quartiles treat each property-day as one sample, and change is the difference between the 30-day and 7-day readings for the same property on the same stay date. “Flat” is defined as under ±1pt.
■ Limitations and caveats
(1) Estimated OCC is based on OTA-listed inventory and differs in definition from actual room occupancy (it generally reads higher). Direct-booking and corporate-contract inventory is not captured in the observations. (2) A “decline” most likely reflects listed inventory being released later rather than demand disappearing, and changes in listed allocation cannot be separated from changes in real demand. (3) The scope is 35–47 properties per stay date and 67 distinct properties, and is not representative of all 163 properties in Kagawa Prefecture. At the cell level by size and by level band, n ranges from 4 to 87; cells with n under 10 (90%+ × 80 rooms or more) should be treated as indicative only. (4) Estimated settled ADR from August onward is a pre-confirmation estimate, so a straight comparison with the prior year’s confirmed values requires care (median error against published operating results is 6.6%).
• Cabinet Office of Japan, “National Holidays” https://www8.cao.go.jp/chosei/shukujitsu/gaiyou.html
• BestCalendar, “July 2026 Holiday and Long-Weekend Calendar (Marine Day)” https://bestcalendar.jp/2026/7/holidays
Related reading
- Tokyo Aug 14: 434 Hotels, Front-Loaded 10.8% vs Late-Surge 9.4%
- Osaka Obon 2026 Booking Curve: Aug 14 at 74.9%, Aug 16 Stuck at 64.1%
- Awaodori 2026: 98.8% Sold 45 Days Out — 39.4pt Over Normal Weekends
- Yosakoi 2026: Kochi Aug 11 86.9% Sold Out at 45 Days, 45.0pt Gap
- Kyoto Obon 2026 Booking Curves: Ryokan Add the Most Close In, +11.4pt