

In the first half of 2026, the number of Chinese visitors to Japan fell sharply, down 55.1% year on year. The decline followed a wave of group-tour cancellations triggered by the Chinese government’s call for citizens to refrain from travel, in response to Prime Minister Sanae Takaichi’s remarks concerning Taiwan. According to JNTO estimates, the January–April cumulative total from China was 1.404 million, roughly half the prior year’s 3.14 million. Korea (+22.0%) and Taiwan (+24.2%), meanwhile, drove the market forward, and total inbound arrivals surpassed 14 million. The broader structure — in which record highs across nine markets absorb the collapse of this single market — is examined in detail in our structural analysis of JNTO’s April data and rising regional ADR.
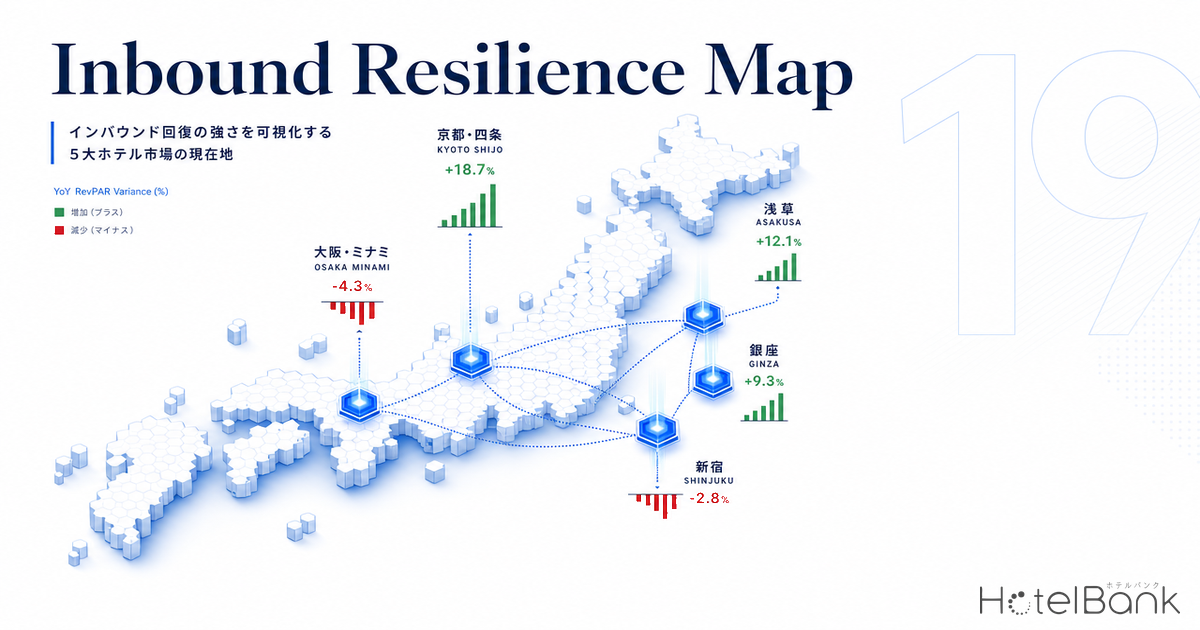
In which segment of the hotel market, and in which cities, does this “single-engine structure” surface? Taking five markets that were inbound-tourist clusters as of 2024 — Osaka Minami, Kyoto Shijo, Asakusa, Ginza, and Shinjuku — as a proxy for China dependency, this article reads their room-rate changes from July 2025 to July 2026 along three axes: market × grade × review-language composition.
Metric Definitions Used in This Article
- ADR (Average Daily Rate): The average of listed selling prices published on OTAs and similar channels. It differs from actual transacted rates (cross-checked against REIT disclosure data, it tends to run on average +25–30% above transacted ADR). Per-room rate for double occupancy (tax included), averaged across all plans (from room-only to meal-inclusive plans).
- OCC (Occupancy Rate): The share of sold rooms against the total room count in the area (an estimate based on OTA sales inventory).
- Data source: MetroEngines Research
- — Chinese visitors plunged −55.1% YoY, yet Korea (+22.0%) and Taiwan (+24.2%) carried the total past 14 million — and this “single-engine structure” surfaces in different forms across the five markets.
- — Osaka Minami is the only market in negative territory, with mid-grade ADR at −22.0%. The vulnerability of the China-dependency proxy “mid-grade × heavy supply × entertainment-district location” is most clearly exposed here.
- — Kyoto Shijo rose across every grade, absorbing the accommodation-tax impact. FIT demand from Western, Australian, Korean, and Taiwanese travelers for the experiential product that is the ryokan creates structural resilience.
- — In Ginza, deluxe softened while the mid-grade led; Asakusa and Shinjuku secured stable occupancy through station-front locations and domestic-repeat-guest flows.
- — As a proxy for China dependency, “mid-grade + heavy supply × entertainment-district location” becomes the dividing line for resilience, while markets with station-front locations and domestic-repeat-guest flows form the portfolio with the least downside risk.
Year-on-Year Across the Five Markets — Osaka and Kyoto Swung in Opposite Directions
First, consider the headline figures for all markets. All five posted year-on-year gains, which at a glance looks as though “inbound as a whole is doing the pulling.” But the breakdown reveals an entirely different picture.
Source: MetroEngines Research; compiled by the HotelBank Editorial Team
Ginza (Chuo Ward) surged +43.8% year on year, showing headline resilience among the strongest in the country. Osaka Minami (Chuo Ward) was +17.0%, Kyoto Shijo (Shimogyo Ward) +11.7%, Asakusa (Taito Ward) +11.9%, and Shinjuku (Shinjuku Ward) +10.5% — all double-digit gains. Looking only this far, one is tempted to conclude that “no one is feeling the China decline,” but that is misleading.
Break It Down by Grade and the Single-Engine Structure Appears
Rather than the market average, comparing the year-on-year change broken down into five grades — deluxe hotels, city hotels, business hotels, hostels, and ryokan — transforms the picture entirely. The heatmap below maps the year-on-year ADR change rate by market × grade.
Source: MetroEngines Research; compiled by the HotelBank Editorial Team
In Osaka Minami, business hotels (N=154, ¥17,100) fell −19.5% year on year and hostels (N=18, ¥17,500) −19.9%, registering steep declines in the low-to-mid price band. City hotels (N=25) were also lackluster at −4.3%. Deluxe hotels (N=9, ¥49,200), by contrast, were nearly flat at −0.5%, and ryokan (N=5, ¥42,900) showed resilience at −0.7%. Minami’s decline is concentrated on the “lower side of the price band,” while the upper grades have not broken down significantly.
Kyoto Shijo, by contrast, is the exact opposite: ryokan (N=23, ¥29,700) rose +23.3% year on year, hostels (N=47, ¥23,100) +19.5%, and deluxe hotels (N=8, ¥86,700) +11.3% — gains at both the top and the bottom. Business hotels (N=118) held +2.8%, securing positive growth across every grade.
Ginza shows even more complex behavior. Its headline +43.8% year-on-year gain is thought to stem mainly from the firm growth of city hotels (N=21, +7.1%) and business hotels (N=130, +6.6%), plus a shift in the per-property procurement mix. Yet deluxe hotels (N=7, ¥114,100) fell −22.0% year on year and hostels (N=18, ¥46,800) −15.8%, with both extremes declining. The deluxe drop partly reflects a change in the sample as the property count (N) rose from 5 to 7 through acquisitions, renovations, and new openings, but even net of that it remains soft.
How to read this: Looking only at the market-average headline, every market appears to have risen; but breaking it down by grade reveals three distinct patterns — ① Osaka’s low-to-mid band declines, ② Kyoto rises across all grades, and ③ Ginza’s deluxe falls while its mid-grade leads. As a proxy for China dependency, “mid-grade + heavy supply × entertainment-district location” looks the most vulnerable.
A Cluster Map of the Five Markets — The Geography of Inbound Flows and Price Change
We plot the geographic relationship of the five markets and each one’s year-on-year ADR on a map. Circle size represents the scale of room supply (the number of OTA-listed properties in that ward).
Source: MetroEngines Research
The three Kanto markets (Ginza, Shinjuku, Asakusa) all remain in positive territory. In Kansai, Kyoto Shijo is rising soundly, but Osaka Minami alone carries a dual structure — “+17.0% overall, yet by grade, business hotels and hostels are down nearly 20%.” This aligns with the fact that Chuo Ward, Osaka was among the areas most heavily allocated to Chinese group-tour demand as of 2024. When package-group demand vanished, the cluster of business hotels and hostels around Shinsaibashi and Dotonbori was likely left unable to clear inventory even after cutting ADR.
The Divergence Point of the Three Prefectures, Seen in Monthly Trends
Overlaying prefecture-level monthly ADR from January 2025 to July 2026, we can confirm that Osaka alone has moved close to flat since autumn 2025. Kyoto peaked in November 2025 (¥47,400) and has since sustained its autumn-foliage and winter highs. Tokyo peaked in January 2026 (¥40,900) and has traded within a range thereafter.
Source: MetroEngines Research; compiled by the HotelBank Editorial Team
Osaka Prefecture’s overall monthly ADR fell from ¥25,900 in October 2025 to ¥22,900 in January 2026, then recovered to ¥26,300 in May 2026 before being pushed back down to ¥24,700 in June. July returned to positive year-on-year territory at ¥27,400, but this reflects both a recovery after the post-Expo pullback ran its course in the second half of 2025 and a shift in guest composition following the end of Expo 2025 Osaka, Kansai demand. Kyoto Prefecture, after reaching ¥49,700 in April 2026, fell to ¥42,100 in June and recovered to ¥44,400 in July — a range-bound path that maintains an upward structure overall. For the Kansai ADR structure before and after the Expo, see our analysis of the Osaka Expo’s impact on hotel ADR.
Reading “Which Segment Is Supporting Demand” Through Occupancy by Category
From the booking curve for July 2026 check-in dates, we calculate the average occupancy (estimated) for a lead time of 0–30 days by city × category. The fill rate over this window serves as an indicator of how much of the inventory has actually been booked.
Source: MetroEngines Research; compiled by the HotelBank Editorial Team
Tokyo maintains stable fill rates across every category — luxury 88.3%, city 85.1%, business 80.8%, ryokan 75.8%. Kyoto shows a city- and business-led pattern: city 81.4%, business 75.6%, luxury 71.3%, ryokan 64.3%. In Osaka, the upper tier holds up well — city 82.8%, luxury 83.4% — but the lower tier and ryokan lag, at business 70.2% and ryokan 58.6%.
What stands out here is that Osaka’s business-category average price over the 0–30-day lead-time window, ¥11,300, is far below Tokyo’s ¥19,300 and Kyoto’s ¥14,800. With occupancy still in the 70s and the average price falling into the ¥11,000 range, this suggests price-cutting to stimulate demand is under way. It can be read as a stage at which a supply-demand gap has surfaced: repeat-oriented Korean and Taiwanese guests have not fully filled the space vacated by Chinese group tours.
The Effective Inbound Share, Seen Through Review-Language Composition
Aggregating the language composition of guest reviews posted over the past 24 months by city brings each market’s “effective” inbound share into relief. Below is the share of review counts for four languages: English, Traditional Chinese, Simplified Chinese, and Korean.
Source: MetroEngines Research (HotelBank Editorial Team analysis; N = 232,000 for Tokyo, 78,000 for Osaka, 84,000 for Kyoto; past 24 months)
Osaka has the highest non-English share of the three cities — English 80.4%, Traditional Chinese 9.8%, Simplified Chinese 4.3%, Korean 5.4%. Traditional Chinese (the main written language of Taiwanese and Hong Kong guests) is the highest at 9.8%, and Simplified Chinese (mainland Chinese guests) adds another 4.3%, for a combined 14.1%. Kyoto has a high Asian share — Traditional Chinese 5.7%, Simplified Chinese 3.2%, Korean 1.9% — but at lower absolute levels than Osaka. Tokyo is overwhelmingly English at 88.4%, with Traditional Chinese, Simplified Chinese, and Korean each staying at just a few percent.
This language composition suggests that Osaka Minami was relatively dependent on demand from the Chinese-speaking world (the mainland plus Hong Kong and Taiwan). Should the impact spread partly to Hong Kong and Taiwan group tours on top of the sharp drop in mainland Chinese guests, the structure in which Osaka’s low-to-mid-price hotels react most sensitively is on display here.
The Domestic Repeat-Guest Flow That Absorbs Substitute Demand
As a force capable of absorbing the drop in Chinese demand, the domestic repeat-guest flow is drawing renewed attention. Among nationwide business-hotel chains, names like Toyoko Inn and Route Inn continuously secure repeat bookings from domestic business and leisure travelers with near-flat daily pricing strategies. By clustering along station fronts and arterial roads a little away from entertainment-district locations, these chains form a customer-acquisition network distinct from the inbound group-package flow.
Even within Osaka Minami, the cluster of nationwide-chain business hotels in station-front locations some 10–15 minutes’ walk from the entertainment-district core of Shinsaibashi and Namba likely can secure relatively stable occupancy anchored on the domestic repeat-guest flow. This China-dependency proxy analysis shows that the vulnerability of “mid-grade + heavy supply × entertainment-district location” is the most exposed; conversely, the combination of “station-front location × domestic repeat-guest flow × flat-rate strategy” can hold up against shifts in inbound composition.
Kyoto Shijo’s across-the-board gains — notably ryokan +23.3% and hostels +19.5% — confirm that this city holds a strong flow in which “the stay itself is the purpose of travel.” Demand for the ryokan, a lodging type built around experiencing Japanese culture, is supported by FIT (independent) travelers from the West, Australia, Korea, and Taiwan rather than group tours, giving it structurally low China dependency. This Kyoto structure also offers a hint as to how other areas might reposition. On Kyoto’s move upmarket, our analysis of the price-band shift one month after Kyoto City’s new accommodation tax is also worth consulting.
A Resilience Matrix of the Five Markets — Summary
We organize the analysis so far into a matrix of the five markets × their key grades, from the standpoint of resilience.
| Market | ADR (2026-07) | YoY | Strongest Grade | Weakest Grade | Assessment |
|---|---|---|---|---|---|
| Ginza (Chuo Ward) | ¥55,700 | +43.8% | City +7.1% | Deluxe −22.0% | Mid-grade firm, upper soft |
| Shinjuku (Shinjuku Ward) | ¥30,300 | +10.5% | Hostel +8.1% | None (all positive) | All grades up |
| Asakusa (Taito Ward) | ¥31,200 | +11.9% | Ryokan +9.8% | None (all positive) | FIT flow is firm |
| Osaka Minami (Chuo Ward) | ¥41,600 | +17.0% | Deluxe −0.5% (flat) | Business −19.5% | Vulnerable in low-to-mid band |
| Kyoto Shijo (Shimogyo Ward) | ¥38,000 | +11.7% | Ryokan +23.3% | None (all positive) | Upside across all grades |
* YoY = the average ADR change rate from July 2025 → July 2026. ADR is for double occupancy, tax included, averaged across all plans.
Three implications emerge from this. First, the combination that most clearly exposes vulnerability as a proxy for China dependency is “Osaka Minami × business hotels and hostels.” Second, Kyoto rose across ryokan, hostels, and deluxe alike, confirming the resilience of a city that holds a FIT-centered flow. Third, all three Tokyo markets (Ginza, Shinjuku, Asakusa) held on to gains, showing that diversification across varied demand sources functions as lower China dependency.
A note on ADR for future dates: The July 2026 data in this article is the average of selling prices published on OTAs at the time of the survey, and will fluctuate as check-in dates approach. In particular, Osaka Minami’s low-to-mid price band retains room for last-minute discounting depending on how inventory clears, so the final landing level may come in below the figures compiled here.
Related Reading
- Did Non-China Inbound Fill the −58% China Gap? Re-examining April 2026 Lodging Statistics and Regional ADR
- 3.69 Million Visitors in April, −5.5% YoY — Regional ADR Rises Despite China −56.8%: Nine Markets at Record Highs Signal a Structural Shift in Inbound Demand
- The Osaka Expo’s Impact on Hotel ADR — Verified with REIT and OTA Data
- One Month Into Kyoto’s New Accommodation Tax: Kyoto ADR +18.6% YoY as the Price Band Shifts Upmarket
- Language-by-Language Review Rating Gaps at Tokyo’s Popular Hotels — How Differently Japanese and Inbound Guests Judge
- Golden Week 2026 Hotel Prices YoY Across Six Major Cities — Unpacking the Real Drivers Behind Kyoto +20% and Tokyo +17%
References and Sources
- JNTO, “Number of Foreign Visitors to Japan (April 2026 Estimates)” (released May 20, 2026)
- JNTO, “Foreign Visitor Statistics”
- Yamatogokoro, “April 2026 Inbound Arrivals Down 5.5% to 3.69 Million”
- Travel Voice, “March 2026 at 3.62 Million; China Halved”
- Aun Consulting, “Annual Trends of Foreign Visitors to Japan in 2025 and Forecast for 2026”
- Japan Research Institute, “A Full-Blown Deterioration in Japan-China Relations Could Cut Inbound Spending by ¥2.3 Trillion Over Three Years”
- MetroEngines Research — OTA published-price data (of roughly 168,000 domestic properties tracked by MetroEngines, approximately 27,000 with confirmed activity), ADR aggregation by city × grade, booking-curve estimated OCC, and review-language composition analysis