

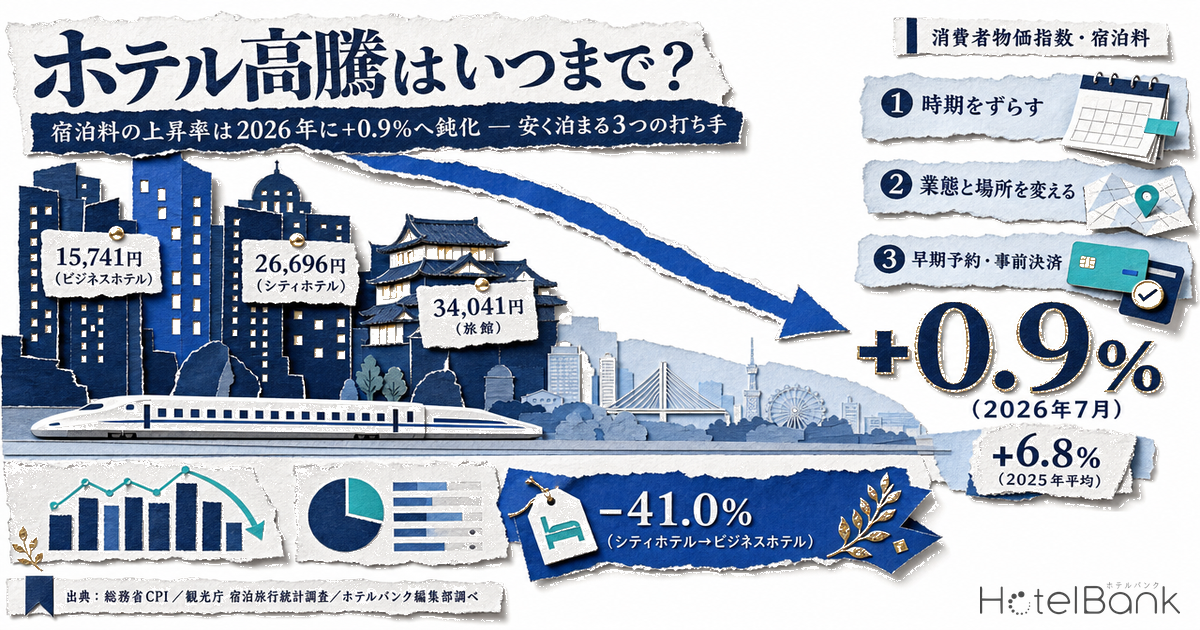
Why have hotels in Japan become so expensive? There are three main answers: lodging demand hit a record high, operating costs such as labor and utilities rose, and demand-based variable pricing spread across the industry. As for “how long will the increases last,” official statistics already offer a clue. According to the Consumer Price Index (CPI) published by the Ministry of Internal Affairs and Communications, the year-on-year change for the “accommodation charges” item narrowed from an average of +6.8% in 2025 to +0.9% in July 2026. The phase of rapid increases has paused, and the market is moving into a period of flat movement at a high level. That said, waiting for prices to return to earlier levels is not a realistic strategy. The first half of this article confirms the “why” and “how long” using official data; the second half is devoted to the moves readers can use right now to pay less — shifting the dates, changing the property type and location, and changing how you book.
- — The pace of increase has already slowed. The year-on-year change in accommodation charges went from an average of +6.8% in 2025 to +0.9% in July 2026 (Ministry of Internal Affairs and Communications, Consumer Price Index). The “prices keep climbing” phase has paused.
- — But prices have not come down. The year-on-year figure remains positive, and the level is holding near a record high. A strategy of waiting for the prices of a few years ago to return is a poor bet.
- — Three reasons prices rose: record lodging demand (661.11 million person-nights in 2025, with international guests up +9.4%), higher labor and utility costs, and the spread of variable pricing.
- — Current market levels are ¥15,741 for business hotels, ¥26,696 for city hotels and ¥34,041 for ryokan (nationwide, as of September 2026, per room for two guests, tax included, N=20,334 properties).
- — Three moves work. Changing the property type (−36% to −54%) has the largest effect, followed by shifting the dates (−20% to −50%) and using advance-purchase or prepaid plans (−10% to −20%).
Why Did Hotels Get Expensive — Three Factors
The first factor is the strength of demand. According to the Japan Tourism Agency’s Overnight Travel Statistics Survey, the confirmed annual figure for 2025 shows 661.11 million person-nights nationwide (+0.3% year on year), a record high. Within that total, Japanese guests fell to 481.18 million person-nights (−2.7%), while international guests grew sharply to 179.92 million person-nights (+9.4%) — inbound travelers are what pushed the overall figure up. In other words, even as domestic travel declined, competition for rooms did not ease. This is what supports prices, mainly in urban areas.
The second is rising costs. Labor, electricity and gas, breakfast ingredients, outsourced linen and cleaning, and even renovation costs — operating costs at lodging facilities have risen across the board over the past several years. How far those costs have been passed through into room rates is analyzed in detail elsewhere, so this article does not repeat that discussion here.
The third is the spread of variable pricing (dynamic pricing). Rates that were once nearly uniform through the year now rise on strong-demand days and fall on weak ones. Many people feel the surge most acutely when they see “double the usual” pricing on long weekends or major event days, and that mechanism is largely why.
Most cases where a regional city feels surprisingly expensive can also be explained by supply and demand. In cities with a small room stock, a single large concert, academic conference or sporting event can wipe out nearly all vacancies in town, and prices for that one date can multiply. In cities where few new hotels are opening, supply also fails to keep up with recovering demand, so even ordinary-day pricing tends to firm up. Rather than certain towns being “always expensive,” the reality is closer to this: the expensive days are the ones where a peak in demand lands on a place with thin supply.
How Long Will Prices Keep Rising? — The Rate of Increase Slowed Sharply in 2026
“How much have prices risen” and “will they rise further” can both be checked against the “accommodation charges” item in the Consumer Price Index (CPI) published by the Ministry of Internal Affairs and Communications. Lining up the most recent published figures makes the change in pace clear.
| Period | Year-on-year change in accommodation charges | Base year |
|---|---|---|
| 2025 annual average | +6.8% | 2020 base |
| December 2025 | +7.8% | 2020 base |
| June 2026 | +1.5% | 2025 base |
| July 2026 | +0.9% | 2025 base |
Source: Ministry of Internal Affairs and Communications, “Consumer Price Index” (nationwide, item “accommodation charges.” The July 2026 figure was published on August 21, 2026. From the January 2026 figure onward the index has shifted to the 2025 base year, so comparisons across periods with different base years should be read as an indication of the trend.)
The annual increases of more than 5% that continued from 2022 narrowed to around 1% year on year in 2026. In other words, the “prices keep climbing” phase has already paused. At the same time, prices that went up have not come back down. As long as the year-on-year figure stays positive, the level is holding near a record high, and given the cost structure, a return to the prices of a few years ago is unlikely. That is precisely why the practical payoff lies in knowing how to buy cheaply within the same market level, rather than “waiting for prices to fall.”
The outlook cannot be stated with certainty, but starting from the recent trend, the range of possibilities can be organized as follows. All of these are assumptions placed by the HotelBank Editorial Team based on the movement of published figures, not forecasts.
| Scenario | Indicative year-on-year change | What would have to happen | What it means for you |
|---|---|---|---|
| Optimistic (cooling) | Flat, around 0% | Inbound demand growth slows and cost increases run their course | Levels stay high, but waiting is unlikely to cost you much |
| Middle (holding high) | Continues in the 0% to 1% range | The July 2026 state (+0.9%) simply persists | Waiting for a drop achieves almost nothing. How you buy is what makes the difference |
| Pessimistic (re-acceleration) | Back to 2% or above | Labor and utility costs rise again, or demand concentrates around major events | The earlier you lock in, the better. Advance-purchase plans gain value |
The indicative year-on-year figures are assumptions placed by the HotelBank Editorial Team, starting from the move in the Ministry of Internal Affairs and Communications “Consumer Price Index” (nationwide, item “accommodation charges”) from an average of +6.8% in 2025 to +0.9% in July 2026. They are not a forecast of future prices.
What Does It Actually Cost Now? — Listed Prices by Property Type (as of September 2026)
Nationwide OTA listed prices compiled by the HotelBank Editorial Team from publicly available OTA data (as of September 2026, per room for two guests, tax included) are shown below. Use them as a sense of what you would actually pay.
| Property type | Average listed price (per room, two guests, tax incl.) | Properties in sample |
|---|---|---|
| Ryokan (Japanese inn) | ¥34,041 | N=6,339 |
| City hotel | ¥26,696 | N=1,253 |
| Hostel | ¥22,723 | N=1,826 |
| Guesthouse | ¥21,866 | N=2,049 |
| Minshuku (family-run inn) | ¥20,851 | N=1,308 |
| Capsule hotel | ¥19,753 | N=106 |
| Business hotel | ¥15,741 | N=7,453 |
Source: HotelBank Editorial Team research (aggregation of publicly available OTA data, as of September 2026, nationwide. Average listed price per room for two guests, tax included. Actual booking prices vary by date and room type.)
If you are booking one room for two people, business hotels are the most affordable of the major property types at an average of about ¥15,700. That is 40% to 50% below ryokan (about ¥34,000) and city hotels (about ¥26,700) — so even when hotels feel expensive, rethinking the property type can change what you pay by a wide margin.
Move 1: Shift the Dates — The Same Room Can Swing by Tens of Percent
The flip side of the variable-pricing era is that choosing a weak-demand day lets you stay well below the standard rate. Moving a single day off a long weekend, the Obon period or the New Year holidays produces a large step in the displayed price. At summer resort destinations, for example, sea temperatures barely change between August and September, yet listed prices drop by 20% to 50% the moment September begins — this gap between the calendar and the actual conditions is examined with specific properties and prices in “The September Sea Is Only 0.8°C Cooler Than August” (tabilog, in Japanese). As for which months run high and which run low, Tokyo’s listed prices peak in November and bottom out in June, a gap of 1.33x, and that month-by-month calendar is covered in a separate article rather than repeated here. The point is this: rather than picking the dates after you have fixed the destination, hold several candidate dates and compare the prices.
Move 2: Change the Property Type and the Location
As the table above shows, rethinking the property type is the single most effective move. Simply switching from a ryokan to a guesthouse or minshuku, or from a city hotel to a business hotel, produces a difference of roughly ¥10,000 per night on an average basis. Hostels and guesthouses increasingly offer private-room types as well, so the assumption that “it’s shared rooms only” is already out of date.
Rethinking the location works too. Even on days when a tourist district or a city center is surging, station-front hotels in an adjacent area 10 to 20 minutes away by train often hold their normal prices. Once you reframe where you sleep from “the destination itself” to “a base with easy access to the destination,” the range of options widens considerably.
Move 3: Use Advance-Purchase and Prepaid Plans
Even for the same room at the same hotel, what you pay changes with the plan you choose. There are three things to watch.
(1) Use advance-purchase plans. Plans booked “28 days ahead” or “60 days ahead” are typically set 10% to 20% below standard plans. In high-demand cities, variable pricing tends to move upward as the stay approaches. A strategy of “waiting for a last-minute discount” is a poor bet in the current market. Our study tracking when price revisions actually occur across 12,821 properties — When Do Hotels Raise Rates? — also found that the phase where increases dominate is concentrated 30 to 15 days before the stay, confirming that prices get less likely to fall the closer you get.
(2) Consider prepaid and non-refundable plans. If your plans are firm, plans with advance card payment or non-refundable terms are often cheaper than pay-at-the-property options. Weigh the chance of cancellation against the price difference.
(3) Check member rates on official websites and apps. Many chains and individual properties reserve their best prices and perks for members booking through their official website or app. Once you have narrowed down your candidates, simply making a habit of comparing the official-site price before booking adds up to a difference worth having over a year.
Here is how much room each of the three moves gives you.
| Move | Indicative reduction | Basis |
|---|---|---|
| 1. Shift the dates | −20% to −50% | Tokyo shows a 1.33x gap between its highest and lowest months (the cheapest month is −24.8% versus the peak month). At summer resort destinations there are cases of a 20% to 50% drop from August to September |
| 2. Change the property type | −36% to −54% | City hotel to business hotel: −¥10,955 (−41.0%); ryokan to minshuku: −¥13,190 (−38.7%); ryokan to business hotel: −¥18,300 (−53.8%). Differences between the averages in Table 2 |
| 3. Change how you book | −10% to −20% | The typical setting level for advance-purchase and prepaid plans. Not an aggregated measurement, but the range commonly seen in how plans are priced |
Move 2 is calculated from the differences between the property-type averages in Table 2. Moves 1 and 3 are indicative figures based on the examples cited in the text and typical plan pricing levels, not measured values for specific properties or dates. The three can be combined, but the reductions cannot simply be added together.
If You Want to Dig Deeper
For hands-on comparisons of specific properties, these articles go further. Both are written in Japanese.
“The September Sea Is Only 0.8°C Cooler Than August — How the Peak of Water Temperature and the Going Rate at Seaside Inns Diverge on a Single Day of the School Calendar” (tabilog, in Japanese)
Overlays the Japan Meteorological Agency’s normal sea-surface temperatures with the listed prices of 140 coastal properties, showing that the September sea is almost as warm as midsummer while only the going rate falls by 20% to 50%. It uses three properties as concrete examples: Haimurubushi on Kohama Island (¥80,000-plus in August, ¥44,000 in September), Hotel Orion Motobu Resort & Spa in Motobu, Okinawa, and Nanki-Shirahama Marriott Hotel.
“Commuting to Kyoto Without Staying in Kyoto This Autumn — Building a Business Trip Around Station-Front Hotels in Otsu and Kusatsu, 9 and 20 Minutes Away on the Biwako Line: Top 5 (October–November 2026)” (HotelPicks, in Japanese)
Compares five station-front hotels in Otsu and Kusatsu that run at roughly half the level of central Kyoto during the autumn foliage season. It covers Hotel Boston Plaza Kusatsu Biwako, a 30-second walk from the west exit of Kusatsu Station; Super Hotel Otsu Ekimae, nine minutes from Kyoto Station by special rapid service with free breakfast; and Urban Hotel Minami-Kusatsu, where breakfast starts at 6:00 a.m. — chosen on the practical merit of easy access.
Frequently Asked Questions
Q. Why did hotels get so expensive?
A. Three reasons overlap. First, lodging demand is strong — the Japan Tourism Agency’s Overnight Travel Statistics Survey shows a record 661.11 million person-nights for the confirmed 2025 annual figure, with international guests rising to 179.92 million person-nights (+9.4% year on year) and pulling up the total. Second, operating costs such as labor, utilities and food have risen. Third, variable pricing (dynamic pricing), where rates move with demand, has spread widely.
Q. How long will hotel price increases continue?
A. The pace of increase has already slowed. Looking at the year-on-year change for the “accommodation charges” item in the Ministry of Internal Affairs and Communications Consumer Price Index, the figure narrowed from an average of +6.8% in 2025 and +7.8% in December 2025 to +1.5% in June 2026 and +0.9% in July 2026. The phase of rapid increases has paused, and the market is moving into a period of flat movement at a high level.
Q. Will accommodation prices come down from here?
A. Waiting on the assumption that they will fall is not realistic. As long as the year-on-year figure stays positive, the level is holding near a record high, and given the cost structure a return to the prices of a few years ago is unlikely. Rather than “waiting for a drop,” you gain more by “buying cheaply within the same market level.”
Q. What does each property type cost right now?
A. Nationwide OTA listed prices (as of September 2026, average per room for two guests, tax included, N=20,334 properties) are ¥34,041 for ryokan, ¥26,696 for city hotels, ¥22,723 for hostels, ¥21,866 for guesthouses, ¥20,851 for minshuku, ¥19,753 for capsule hotels and ¥15,741 for business hotels. Actual booking prices vary by date and room type.
Q. What works best for staying cheaply?
A. Rethinking the property type has the largest effect. Comparing the averages in Table 2, switching from a city hotel to a business hotel saves ¥10,955 per night (−41.0%), and from a ryokan to a minshuku ¥13,190 (−38.7%). Shifting the dates comes next, followed by changing how you book.
Q. Which is cheaper, last-minute or advance booking?
A. In high-demand cities, advance booking is often the better deal. Advance-purchase plans such as “28 days ahead” or “60 days ahead” are typically set 10% to 20% below standard plans, and variable pricing tends to rise as the stay approaches. A study tracking actual price revisions across 12,821 properties also found that the phase where increases dominate is concentrated 30 to 15 days before the stay, confirming a structure in which prices get less likely to fall the longer you wait.
Related Reading
References and Sources
The official statistics cited in this article are published in the primary sources below (the official websites of the responsible government agencies).
- Ministry of Internal Affairs and Communications, “2025-Base Consumer Price Index, Japan, July 2026” — year-on-year change for the item “accommodation charges.” Published August 21, 2026. From the January 2026 figure onward the index has shifted to the 2025 base year
- Statistics Bureau of Japan, “Consumer Price Index (CPI)” — year-on-year change in accommodation charges for the 2025 average, December 2025 and June 2026 (2020 base / 2025 base)
- Japan Tourism Agency, “Overnight Travel Statistics Survey” — confirmed annual figures for 2025: 661.11 million person-nights in total, 481.18 million by Japanese guests and 179.92 million by international guests
■ Data sources
The prices by property type (Table 2 and the accompanying chart) are nationwide listed prices compiled by the HotelBank Editorial Team from publicly available OTA data. They are averages per room for two guests, tax included, as of September 2026, covering N=20,334 properties across seven property types. The year-on-year changes in accommodation charges (Table 1 and the accompanying chart) and the person-night figures are quoted directly from figures published by the Ministry of Internal Affairs and Communications and the Japan Tourism Agency.
■ Calculation assumptions
The reduction for “change the property type” in Table 4 is a reference figure calculated from the differences between the property-type averages in Table 2. “Shift the dates” is based on the month-by-month calendar referenced in the text (a 1.33x gap between Tokyo’s highest and lowest months) and the summer resort example; “change how you book” is an indicative range based on typical pricing levels for advance-purchase and prepaid plans. Neither is an aggregated measurement. The scenarios in Table 3 are assumptions placed by the editorial team starting from the movement of published figures, not forecasts of future prices.
■ Limitations and caveats
The Consumer Price Index shifted to the 2025 base year from the January 2026 figure, so comparisons with periods before 2025 (2020 base) should be read as an indication of the trend. Listed prices vary widely by date, room type and cancellation terms, so actual booking prices will not match the averages in this article. The three moves in Table 4 can be combined, but their reductions cannot simply be added together.