

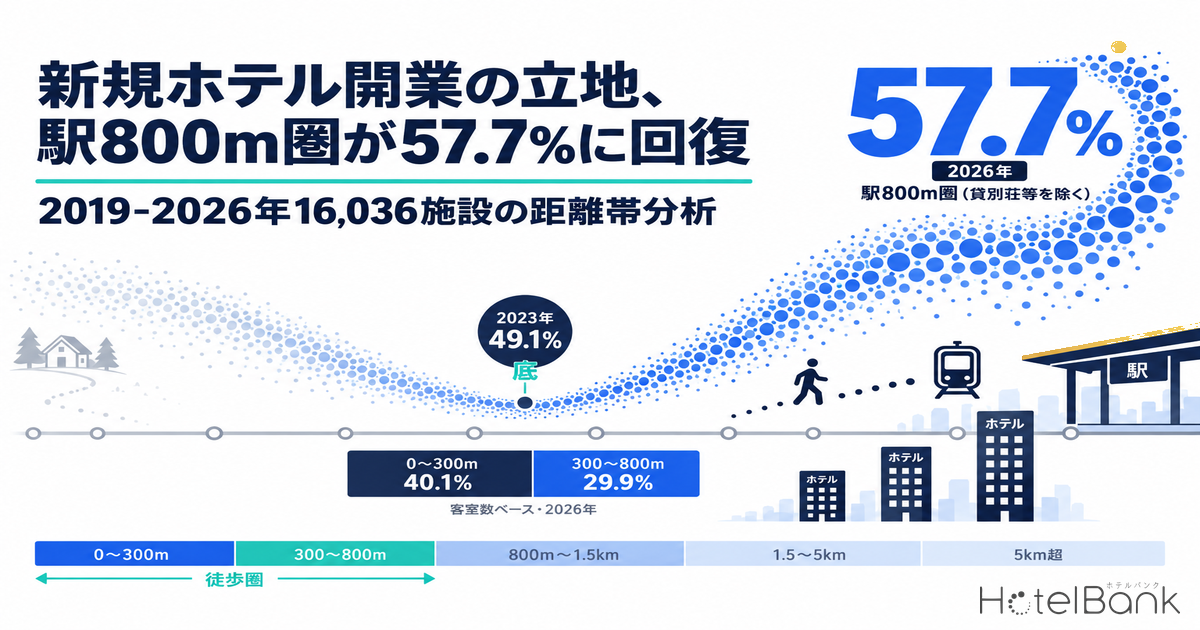
Are newly built lodging facilities moving closer to train stations, or further away? This is not a story about pricing — it asks whether the places where supply is physically put down have shifted. We matched the coordinates of 16,036 facilities that opened (or were confirmed as listed openings) between 2019 and 2026 against their nearest railway station, and tallied how the distribution across distance bands has changed.
Metric Definitions Used in This Article
- Distance to nearest station: The minimum great-circle distance from each facility’s coordinates to any of 10,502 station records nationwide (railway stations and tram/light-rail stops). This is straight-line distance, not a walking route.
- Distance bands: Five bands — 0–300m / 300–800m / 800m–1.5km / 1.5–5km / over 5km. Broadly, these correspond to “station-adjacent,” “walkable,” “edge of walkable,” “requires secondary transport,” and “not dependent on rail.”
- Population analysed: 16,036 facilities with an opening year (establishment date as listed) between 2019 and 2026. This is not a complete census — it is the range we can confirm from listings on major booking sites and from publicly announced plans.
- “Excluding villas and similar” series: A series that removes five categories — rental villas, cottages, glamping sites, lodges and campgrounds. Facility-count distributions are strongly pulled by this layer, so we show it alongside the all-category figures.
- Data sources: MetroEngines Research & Consulting (facility and room counts, based on confirmed OTA listings) / Ministry of Land, Infrastructure, Transport and Tourism (MLIT) Real Estate Information Library, “Station-level Passenger Volumes” (station locations and ridership).
- — 57.7% within 800m of a station — Excluding villas and similar, the walkable share of new openings bottomed out at 49.1% in 2023 and has since recovered, while the over-5km share shrank 12.7 points from 30.7% in 2019 to 18.0%.
- — The centre of gravity moved one step out from the station gate — On a room-count basis, 0–300m fell from 50.8% to 40.1% while 300–800m rose from 18.9% to 29.9%. The walkable envelope held; its internal mix swapped over.
- — Categories moved in opposite directions — Business hotels moved outward (0–300m share 46.0% to 36.6%), city hotels moved inward (41.3% to 59.8%), and resort hotels’ median distance shortened from 4,867m to 2,911m.
- — Counting facilities misleads — Villas, glamping sites and similar accounted for 54.0% of 2026 openings by facility count but only 5.3% by room count. Locational change has to be read from the “excluding villas and similar” series.
Count facilities alone, and villas drag the distribution
Start with the distribution of raw facility counts. Of the facilities that opened in 2019, 24.1% were within 300m of a station. That fell to 13.8% by 2023 and has recovered to 18.2% in 2026. At first glance it reads as “new supply moved away from stations, then came back.”
Almost all of that movement, however, comes from a change in the category mix. The share of new openings accounted for by rental villas, cottages and glamping sites jumped from 19.0% in 2019 to 53.3% in 2023, and still stands at 54.0% in 2026. Once small whole-property rentals make up more than half of all openings, the facility-count distribution automatically shifts toward the far-from-station side. That same layer accounts for just 5.3% of rooms. In other words, the leading category of supply changes depending on whether you count buildings or bedrooms.
All categories (share by facility count)
Excluding villas and similar (share by facility count)
Source: MetroEngines Research & Consulting (based on confirmed OTA listings) and MLIT Real Estate Information Library, “Station-level Passenger Volumes”; compiled by the HotelBank Editorial Team (N=16,036 facilities)
The right-hand chart, which excludes villas and similar, shows a completely different picture. The share of facilities opening within 800m of a station (0–300m plus 300–800m) fell from 54.0% in 2019 to 49.1% in 2023, then recovered to 53.7% in 2025 and 57.7% in 2026. The over-5km share, conversely, shrank 12.7 points from 30.7% in 2019 to 18.0% in 2026. Restricted to genuine lodging stock — hotels, ryokan and hostels — new supply is in fact moving back along the rail network.
The 2026 figure is an in-progress observation based on confirmed listings, so that 57.7% will move as further listings appear. Even if every unobserved facility were to arrive with the same distribution as 2025 (53.7% within 800m), however, the 2026 figure would land between 53.7% and 57.7% — above the 2023 trough of 49.1%. The conclusion that the walkable share bottomed out in 2023 and turned back up does not depend on where the observation window is cut.
The gap between these two charts is the single most important check in this article. When discussing where supply is located, the conclusion flips depending on whether you count facilities or rooms, and on whether whole-property rentals are included. From here on we use the “excluding villas and similar” series as the main axis.
The room-count centre of gravity moved from “at the station” to “300–800m out”
Next, instead of counting each facility once, we weight the distribution by room count. Hotel market supply is driven by bedrooms, so for investment and development purposes this view is closer to reality.
Source: MetroEngines Research & Consulting (based on confirmed OTA listings) and MLIT Real Estate Information Library, “Station-level Passenger Volumes”; compiled by the HotelBank Editorial Team (excluding villas and similar, N=8,459 facilities / 458,774 rooms)
Of the rooms that opened in 2019, 50.8% were within 300m of a station. By 2026 that share had fallen to 40.1%. The 300–800m band, meanwhile, expanded 11.0 points from 18.9% to 29.9%. The walkable total (within 800m) was essentially flat at 69.7% against 70.0% — so within the walkable envelope, the centre of gravity shifted one step out from the station gate.
The 800m–1.5km band also widened from 6.2% to 9.1%, and 1.5–5km from 4.2% to 10.9%. Taken together, the picture is one in which “large boxes built directly on top of a station” have thinned out in relative terms, with that volume dispersing into mid-sized properties a few minutes’ walk away or within bus range. Context helps: Japan’s 2026 published land prices rose 2.8% year on year on a nationwide all-use average and 4.3% for commercial land, with commercial land in Tokyo’s 23 wards up an average of 13.8%; construction costs have climbed to ¥1.95 million per tsubo (2024, average across all structure types). When the hurdle for acquiring prime station-front land and building at scale rises, supply is physically pushed outward.
| Opening year | Rooms | 0–300m | 300–800m | 800m–1.5km | 1.5–5km | Over 5km |
|---|---|---|---|---|---|---|
| 2019 | 100,227 | 50.8% | 18.9% | 6.2% | 4.2% | 20.0% |
| 2020 | 87,802 | 48.8% | 24.0% | 5.3% | 4.5% | 17.4% |
| 2021 | 66,553 | 43.9% | 25.1% | 6.0% | 4.7% | 20.4% |
| 2022 | 48,901 | 49.1% | 27.9% | 5.6% | 7.0% | 10.4% |
| 2023 | 42,238 | 51.9% | 27.4% | 4.9% | 8.2% | 7.6% |
| 2024 | 36,866 | 44.2% | 25.1% | 8.8% | 14.7% | 7.3% |
| 2025 | 39,632 | 45.5% | 25.0% | 9.8% | 12.3% | 7.4% |
| 2026 | 36,555 | 40.1% | 29.9% | 9.1% | 10.9% | 10.0% |
Distance-band mix by room count (excluding villas and similar). Source: MetroEngines Research & Consulting (based on confirmed OTA listings) and MLIT Real Estate Information Library; compiled by the HotelBank Editorial Team
Note that the absolute number of newly opened rooms shrank from 100,227 in 2019 to 36,555 in 2026. Any reading of the share changes has to start from the fact that the base has contracted to roughly a third. The 2026 figures in particular are compiled from confirmed listings, so some facilities opening from September onward are not yet reflected.
Median distances — the overall figure shrank, the components moved opposite ways
Source: MetroEngines Research & Consulting (based on confirmed OTA listings) and MLIT Real Estate Information Library; compiled by the HotelBank Editorial Team
Across all categories, the median distance to the nearest station stretched from 817m in 2019 to 2,098m in 2023, then contracted to 1,228m in 2026. Excluding villas and similar, the figures are 656m in 2019, 963m in 2024 and 572m in 2026 — the most recent reading is closer to a station than 2019 was. In periods when volumes swing sharply, the median is more stable than the mean, yet even so the range of movement is around 1.5x.
Distance-band mix by category (facility-count basis). Source: MetroEngines Research & Consulting (based on confirmed OTA listings) and MLIT Real Estate Information Library; compiled by the HotelBank Editorial Team
Splitting by category surfaces movements the overall average hides. The largest shift is in business hotels, where the 0–300m share fell 9.4 points from 46.0% in 2019–2021 (N=1,399) to 36.6% in 2024–2026 (N=680). In exchange, 300–800m widened from 25.4% to 30.7% and 1.5–5km from 3.6% to 14.3%. The median moved roughly 80m outward, from 336m to 414m. One reading is that room has opened up to take roadside sites and the fringes of urban centres.
City hotels did precisely the opposite. Their 0–300m share rose 18.5 points from 41.3% to 59.8%, and the median contracted from 436m to 266m. The over-5km share all but vanished, from 28.3% to 3.3%. With N=92 in both periods, the change in mix can be read directly as a change in strategy: large, high-rate properties are consistently pursuing station-adjacent sites even as land prices rise.
Resort hotels also moved closer to stations. Their median shortened by roughly 2km, from 4,867m to 2,911m, and the over-5km share fell from 49.4% to 35.7%. Candidate sites may be shifting toward hot-spring areas and the outskirts of regional hub cities that have rail access. Hostels became more station-oriented still, with 0–300m rising from 34.1% to 40.0%, reinforcing an already station-front bias. Ryokan were close to flat — median 1,850m to 2,159m, over-5km share 30.3% to 29.7% — making them the category whose locational character has changed least.
In short, the question “has the centre of gravity of new supply moved?” cannot be answered without splitting by category. The market as a whole is returning to walkable locations, while inside that trend business hotels are moving outward and city and resort hotels inward at the same time.
Where did the large 2026 projects land?
Facilities of 100 rooms or more confirmed as listed for 2026 number 128, totalling 25,068 rooms. Of these, 56 sit within 0–300m and 40 within 300–800m — three quarters fall inside the walkable envelope. By room count, 0–300m accounts for 11,219 rooms and 300–800m for 8,020. All ten of the largest properties by room count are within 800m of a station: seven in the station-adjacent 0–300m band and three in the 300–800m walkable band.
| Facility | Rooms | Category | Nearest station | Straight-line distance | Band |
|---|---|---|---|---|---|
| The Royal Park Hotel Maihama Resort Tokyo Bay (ザ ロイヤルパークホテル 舞浜リゾート東京ベイ) | 750 | Resort hotel | Tokyo DisneySea Station (東京ディズニーシー・ステーション) | approx. 643m | 300–800m |
| APA Hotel & Resort Okayama-eki Shinkansen-guchi (アパホテル&リゾート〈岡山駅新幹線口〉) | 600 | Business hotel | Okayama (岡山) | approx. 621m | 300–800m |
| APA Hotel Saitama-Shintoshin-eki Nishi (アパホテル〈さいたま新都心駅西〉) | 389 | Business hotel | Kita-Yono (北与野) | approx. 264m | 0–300m |
| APA Hotel Keisei Ueno-Ekimae Minami (アパホテル〈京成上野駅前南〉) | 342 | Business hotel | Ueno-Okachimachi (上野御徒町) | approx. 82m | 0–300m |
| The Grand Castle Naha Shurijo by Hewitt Resort (ザ グランドキャッスル 那覇 首里城 by ヒューイットリゾート) | 333 | Resort hotel | Shiritsu-Byoin-mae (市立病院前) | approx. 733m | 300–800m |
| Travelodge Osaka Shinsaibashi (トラベロッジ大阪心斎橋) | 302 | Business hotel | Nagahoribashi (長堀橋) | approx. 81m | 0–300m |
| KOKO HOTEL Premier Tokyo Bay Makuhari (KOKO HOTEL Premier 東京ベイ幕張) | 301 | Business hotel | Kaihimmakuhari (海浜幕張) | approx. 180m | 0–300m |
| Hotel Metropolitan Oimachi TRAX (ホテルメトロポリタン大井町トラックス) | 285 | City hotel | Oimachi (大井町) | approx. 61m | 0–300m |
| Courtyard by Marriott Kyoto Station (コートヤード・バイ・マリオット京都駅) | 270 | City hotel | Kyoto (京都) | approx. 298m | 0–300m |
| The Royal Park Hotel Iconic Naha (ザ ロイヤルパークホテル アイコニック 那覇) | 257 | City hotel | Kenchomae (県庁前) | approx. 63m | 0–300m |
Top 10 by room count among 100+ room facilities opening in 2026 (based on confirmed listings). Source: MetroEngines Research & Consulting (based on confirmed OTA listings) and MLIT Real Estate Information Library; compiled by the HotelBank Editorial Team
While several projects sit within tens of metres of a station, on remote islands and in mountain resorts with no rail network the nearest station can be tens of kilometres away. Note that this article’s “over 5km” band lumps all such rail-independent locations together.
Stations with thin walkable room stock relative to their ridership
Finally, we screened for thinly supplied distance bands at the station level. We extracted 230 stations with daily passenger volumes of 80,000 or more and tallied the existing room stock within 800m and within 1.5km of each. Across those 230 stations, the median number of rooms within 800m per 10,000 passengers was 92.8, and the bottom quartile sat at 20.4 or below.
The table below lists stations with 150,000 or more passengers and at least 150 rooms within 1.5km (evidence of some lodging demand) where rooms within 800m still fall below 25 per 10,000 passengers.
| Station (operators) | Passengers | Rooms within 800m | Rooms within 1.5km | Rooms per 10,000 passengers |
|---|---|---|---|---|
| Ayase (綾瀬) Tokyo Metro, JR East | 1,151,195 | 610 | 724 | 5.3 |
| Kita-Senju (北千住) Tokyo Metro, JR East, Tobu Railway, Metropolitan Intercity Railway | 1,097,021 | 330 | 399 | 3.0 |
| Takadanobaba (高田馬場) Tokyo Metro, JR East, Seibu Railway | 404,792 | 818 | 2,725 | 20.2 |
| Nishi-Funabashi (西船橋) Tokyo Metro, JR East, Toyo Rapid Railway | 295,943 | 526 | 1,072 | 17.8 |
| Kichijoji (吉祥寺) Keio Corporation, JR East | 276,840 | 549 | 549 | 19.8 |
| Shimokitazawa (下北沢) Keio Corporation, Odakyu Electric Railway | 257,918 | 194 | 303 | 7.5 |
| Nakano (中野) Tokyo Metro, JR East | 247,936 | 171 | 400 | 6.9 |
| Kotake-Mukaihara (小竹向原) Tokyo Metro, Seibu Railway | 228,023 | 0 | 258 | 0.0 |
| Yoyogi-Uehara (代々木上原) Odakyu Electric Railway, Tokyo Metro | 222,249 | 50 | 1,927 | 2.2 |
| Kokubunji (国分寺) JR East, Seibu Railway | 211,766 | 234 | 234 | 11.0 |
| Totsuka (戸塚) JR East, City of Yokohama | 211,324 | 259 | 513 | 12.3 |
| Tsudanuma (津田沼) JR East | 202,494 | 346 | 492 | 17.1 |
| Mizonokuchi (溝の口) Tokyu Corporation | 186,811 | 297 | 519 | 15.9 |
| Naka-Meguro (中目黒) Tokyu Corporation, Tokyo Metro | 182,860 | 230 | 3,485 | 12.6 |
| Mitaka (三鷹) JR East | 180,428 | 265 | 360 | 14.7 |
| Ogikubo (荻窪) JR East, Tokyo Metro | 170,186 | 221 | 710 | 13.0 |
| Toyosu (豊洲) Tokyo Metro, Yurikamome | 154,214 | 290 | 2,018 | 18.8 |
| Wakoshi (和光市) Tobu Railway, Tokyo Metro | 151,804 | 357 | 452 | 23.5 |
Passenger volumes are the latest annual figures from the MLIT Real Estate Information Library, “Station-level Passenger Volumes.” Where a station serves multiple lines, the maximum value is used rather than a simple sum across lines. Room counts exclude villas and similar. Source: MetroEngines Research & Consulting and MLIT Real Estate Information Library; compiled by the HotelBank Editorial Team
Circle size = passenger volume; colour depth = how thin the room stock is within 800m. Source: MetroEngines Research & Consulting and MLIT Real Estate Information Library; compiled by the HotelBank Editorial Team
What matters here is the fact that almost every station on the list is a commuter terminal in the Greater Tokyo area. Stations such as Ayase, Kita-Senju, Kotake-Mukaihara and Yoyogi-Uehara carry more than 200,000 passengers yet hold only a few hundred rooms or fewer within 800m, because the bulk of that traffic is commuting and interchange — demand that passes through. Passenger volume does not, in itself, translate into lodging demand.
This table is therefore best read not as a list of stations to build at, but as a map of where thinly supplied bands remain. Anyone examining a site in practice would need to separate through traffic from staying demand and check the surrounding business concentration, stay-generating anchors such as event venues and hospitals, and the availability of secondary transport. That said, there are also cases — Takadanobaba (818 rooms within 800m against 2,725 within 1.5km) and Naka-Meguro (230 against 3,485) — where the wider area holds substantial room stock and only the immediate station surroundings are thin; those are bands where headroom may remain, depending on how pedestrian flows are designed. How far room rates hold up as distance from the station increases is measured in Station Premium Ends at an 8-Minute Walk: 8 Stations, 1,012 Hotels.
Summary
Viewing new supply from 2019 to 2026 through distance bands confirms four points. First, the facility-count distribution is dragged by the surge in villas and similar, so a simple tally of facilities misreads the locational change. Second, excluding villas and similar, the walkable share (within 800m) bottomed at 49.1% in 2023 and recovered to 57.7% in 2026, while the over-5km share shrank 12.7 points. Third, on a room-count basis, 0–300m fell from 50.8% to 40.1% while 300–800m expanded from 18.9% to 29.9% — the walkable envelope held, but the centre of gravity moved one step out from the station gate. Fourth, the components moved in opposite directions by category, with business hotels heading outward and city and resort hotels heading inward.
In a period of continued land price and construction cost inflation, the economics of large-scale development on prime station-front land differ from those of mid-sized development a few minutes’ walk away. The change in distribution can be understood as the result of those feasibility calculations showing up on the map. We intend to keep tracking the same distance bands each quarter, and to watch which bands the projects now at the planning stage land in from 2027 onward.
About the data coverage: The facility data in this article is compiled from confirmed OTA listings (the range identifiable from listings on major booking sites and from publicly announced plans) and is not a complete census. Because listings appear several months before opening, facility and room counts for recent and future opening years will increase as further listings are reflected; the 2026 tallies in particular are an in-progress observation. Distance to the nearest station is a straight-line measure and differs from actual walking routes and travel times.
Related reading
References and sources
■ Data sources
Locations, room counts and categories for the newly opened facilities (16,036 facilities confirmed as listed with openings, or planned openings, between 2019 and 2026) come from facility data collected by MetroEngines Research & Consulting on the basis of confirmed OTA listings. Nearest stations and passenger volumes come from the MLIT Real Estate Information Library, “Station-level Passenger Volumes” (National Land Numerical Information S12; 10,502 station locations). Room-count tallies cover 8,459 facilities and 458,774 rooms excluding villas and similar, and the station-level screening population is the 230 stations with 80,000 or more passengers.
■ Calculation assumptions
Distance to the nearest station is the minimum great-circle distance from a facility’s coordinates to every station, not a walking route or travel time. The distance bands are 0–300m / 300–800m / 800m–1.5km / 1.5–5km / over 5km. Where a station serves multiple lines, the maximum passenger volume is used rather than a simple sum across lines. The “excluding villas and similar” series removes five categories: rental villas, cottages, glamping sites, lodges and campgrounds.
■ Limitations and caveats
This is not a complete census but a tally of the range identifiable from listings on major booking sites and publicly announced plans. Because listings appear several months before opening, facility and room counts for recent and future opening years will rise as further listings are reflected; the 2026 figures in particular are an in-progress observation. Note also that passenger volume is not lodging demand itself and includes a large share of through traffic.
- MetroEngines Research & Consulting — Locations, room counts and categories of newly opened facilities (based on confirmed OTA listings, N=16,036 facilities)
- MLIT Real Estate Information Library, “Station-level Passenger Volumes” (National Land Numerical Information S12) — 10,502 station locations and passenger volumes
- MLIT, “Published Land Prices 2026” (press release, 18 March 2026) — 2026 published land price change rates
- MLIT, “Statistical Survey on Building Construction Starts” — Per-tsubo construction cost levels for hotels
- HotelBank, “Frozen Pipeline & the Supply Gap: Cancelled Hotel Projects and Investor Implications”