

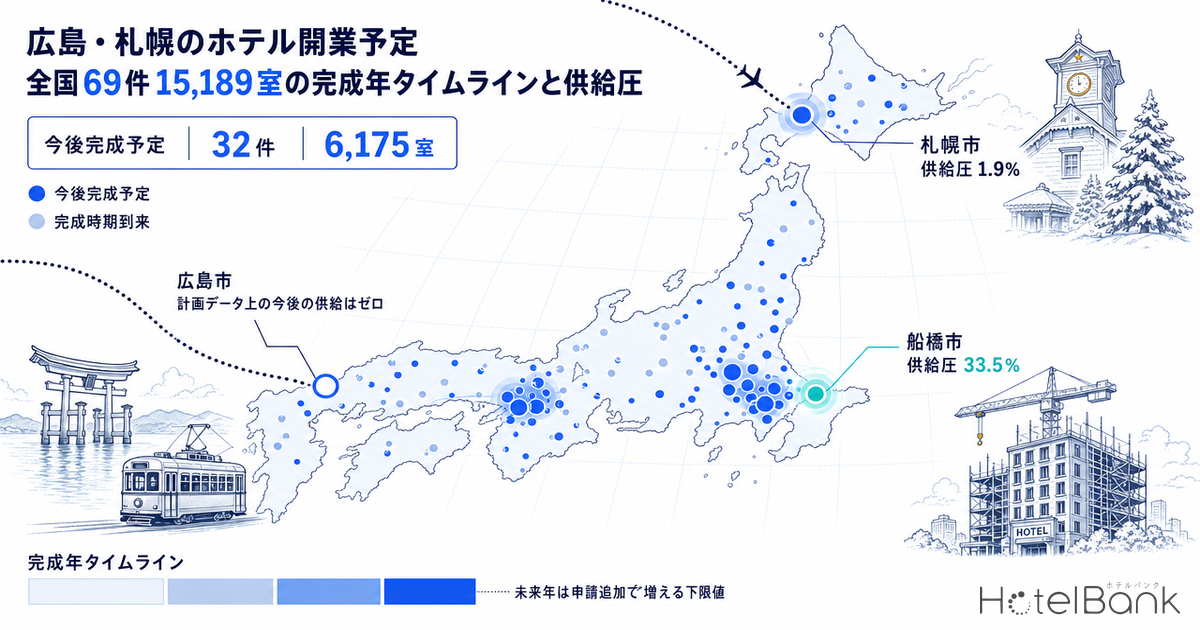
Search queries such as “Hiroshima hotel openings” and “Sapporo hotel openings” show where the lodging market’s attention has shifted: less toward prices and more toward how many rooms are still to come. When the building-plan data captured by MetroEngines Research is re-sorted by scheduled completion year, hotel projects with 50 or more rooms total 69 projects and 15,189 rooms nationwide. Of these, only 32 projects and 6,175 rooms had not yet reached their scheduled completion date as of the survey date (September 18, 2026) and therefore represent “future supply.”
This article reads the 69 projects in three steps: (1) a timeline by completion year, (2) the distribution by prefecture and municipality, and (3) the ratio of upcoming rooms to each area’s existing room stock, which we call supply pressure. We then take a closer look at Sapporo and Hiroshima, the two cities with the strongest search interest, and finally plot every project on a map.
Metric Definitions Used in This Article
- Planning pipeline: Building projects that include hotel use and have 50 or more guest rooms, as identified by MetroEngines Research from building-plan filings and similar sources. This is not a complete census; it covers the projects we were able to identify.
- Scheduled completion year: The year of the planned building completion date (construction completion basis). This is not the opening date itself; there may be a pre-opening period after completion, and completion dates can change due to construction delays.
- Upcoming completion: Projects whose scheduled completion date falls after the survey date (September 18, 2026). Projects whose scheduled completion date is on or before the survey date are labeled “past completion date.”
- Existing room stock: Total guest rooms of lodging properties that were open (and not yet closed) at the end of each year within a 3 km radius of the reference point. Based on properties confirmed as operating among the approximately 168,000 properties tracked by MetroEngines Research.
- Supply pressure: Upcoming rooms ÷ existing room stock in the same area (as of 2026). It shows how much, in percentage terms, will be added on top of the existing room inventory.
- Data sources: Planning data = compiled by MetroEngines Research & Consulting from the Ministry of Land, Infrastructure, Transport and Tourism (MLIT) “Statistics on Building Construction Starts”; existing stock = MetroEngines Research & Consulting (based on confirmed OTA listings)
- — Of 69 projects / 15,189 rooms, 32 projects / 6,175 rooms are still to be completed (40.7% by room count). The supply-expansion phase has run its course; the market is now in a stage of selective additions.
- — The top three prefectures (Tokyo 18 projects / 3,497 rooms, Hokkaido 9 / 2,345, Chiba 5 / 2,164) hold 52.7% of all rooms, while some prefectures show no new projects of 50+ rooms at all.
- — Supply pressure relative to existing stock is 33.5% in Funabashi and 22.7% in Chiba City, versus around 1% in big-city cores (Sapporo 1.9%, Osaka 0.4%, Chuo Ward 0.3%). The larger the absolute pipeline, the smaller the relative pressure.
- — Hiroshima Prefecture shows zero upcoming supply in the planning data, yet announced projects concentrate 418 rooms in 2027. Hotels housed inside redevelopment towers rarely surface in building-plan data, so supply must be read on two layers.
- — This tally is not a complete census but covers what we could identify. Figures for 2028 onward count only projects already filed and are therefore a floor that will rise as new filings are added.
Completion-Year Timeline — Of 69 Projects / 15,189 Rooms, 32 Projects / 6,175 Rooms Are Still to Come
Start with the big picture. Grouping the 69 identified projects by scheduled completion year, 2025 is the largest with 22 projects and 5,304 rooms, followed by 2026 (19 projects / 4,442 rooms), 2027 (18 / 3,815) and 2028 (8 / 1,428). The average project has 220 rooms, so the pipeline is weighted toward mid-to-large projects somewhat bigger than typical limited-service hotels.
It would be a mistake, however, to read this chart as “supply dries up after 2028.” Building-plan filings are usually made one to three years before completion. The columns for 2028 and later therefore count only projects already filed as of today and are a floor that will inevitably rise as new filings come in. The chart below separates dark bars (past completion date) from light bars (upcoming completion) precisely to avoid that misreading. All 22 projects for 2025 have already passed their completion dates, as have 15 of the 19 projects for 2026.
This data is based on building-confirmation applications as of the survey date (MLIT “Statistics on Building Construction Starts”). Because confirmation applications are typically filed one to two years before opening, project and room counts for future years are expected to increase as further applications are filed. Please treat these figures as the lower bound of the confirmed pipeline at this point in time.
Source: Compiled by MetroEngines Research & Consulting from MLIT “Statistics on Building Construction Starts” (N=69 projects, 50+ rooms)
| Completion year | Projects | Rooms | Avg. size | Of which upcoming |
|---|---|---|---|---|
| 2025 | 22 | 5,304 | 241 | 0 / 0 rooms |
| 2026 | 19 | 4,442 | 234 | 4 / 732 rooms |
| 2027 | 18 | 3,815 | 212 | 18 / 3,815 rooms |
| 2028 | 8 | 1,428 | 178 | 8 / 1,428 rooms |
| 2029 | 1 | 100 | 100 | 1 / 100 rooms |
| 2031 | 1 | 100 | 100 | 1 / 100 rooms |
| Total | 69 | 15,189 | 220 | 32 / 6,175 rooms |
Source: Compiled by MetroEngines Research & Consulting from MLIT “Statistics on Building Construction Starts”
About the data population: The planning data in this article covers what MetroEngines Research could identify from building-plan filings and similar sources; it is not a complete census. Plans not yet filed, hotels that move into a building as tenants, and conversions of existing buildings may fall outside its scope. Scheduled completion dates can also slip due to construction delays or plan changes, and they are not confirmed opening dates.
Distribution by Prefecture and Municipality — Tokyo 18 Projects / 3,497 Rooms, Hokkaido 9 / 2,345, Chiba 5 / 2,164
The geographic skew is clear. Tokyo leads with 18 projects and 3,497 rooms, followed by Hokkaido (9 / 2,345) and Chiba (5 / 2,164). These top three prefectures alone account for 52.7% of all rooms (8,006 of 15,189). Many prefectures have only a single project, and some show no new projects of 50 or more rooms at all.
The picture changes, though, when we look only at upcoming completions. In Saitama (767 rooms), Hiroshima (380 rooms) and Shizuoka (277 rooms), every identified project has already passed its completion date, so upcoming supply in our data is zero. Conversely, all 490 rooms in Okayama are still to come, making it one of the few prefectures where supply is “yet to increase.”
Source: Compiled by MetroEngines Research & Consulting from MLIT “Statistics on Building Construction Starts” (top 12 prefectures)
At the municipal level, the concentration of rooms is even sharper. Sapporo (6 projects / 1,487 rooms), Osaka City (4 / 1,042), Chiba City (1 / 1,000), Yokohama (3 / 890) and Urayasu (2 / 876) top the list. The table below lists the largest individual projects.
| Location | Rooms | Completion | Main uses | Status |
|---|---|---|---|---|
| Chiba City, Chiba | 1,000 | Dec 2027 | Hotel, cinema, restaurants, bathhouse | Upcoming |
| Urayasu, Chiba | 750 | Feb 2026 | Hotel | Completion date passed |
| Sapporo, Hokkaido | 605 | Mar 2025 | Hotel, restaurants, public bath, parking | Completion date passed |
| Kutchan, Abuta District, Hokkaido | 500 | Dec 2025 | Hotel, hotel condominiums, detached villas | Completion date passed |
| Osaka City, Osaka | 482 | Mar 2025 | Offices, hotel, retail | Completion date passed |
| Saitama City, Saitama | 389 | Jun 2026 | Hotel | Completion date passed |
| Hiroshima City, Hiroshima | 380 | Mar 2025 | Retail, hotel, parking | Completion date passed |
| Yokohama, Kanagawa | 338 | Mar 2026 | Hotel, pool, spa, aquarium, restaurants, condominiums | Completion date passed |
| Toshima Ward, Tokyo | 328 | Sep 2026 | Hotel, parking | Completion date passed |
| Okayama City, Okayama | 300 | Dec 2028 | Housing, hotel, retail | Upcoming |
| Utsunomiya, Tochigi | 300 | Oct 2028 | Hotel | Upcoming |
| Shinagawa Ward, Tokyo | 285 | Mar 2026 | Offices, hotel, retail, apartments, parking | Completion date passed |
| Koto Ward, Tokyo | 285 | Mar 2025 | Hotel | Completion date passed |
| Yokohama, Kanagawa | 280 | Apr 2026 | Offices, university, hotel | Completion date passed |
Source: Compiled by MetroEngines Research & Consulting from MLIT “Statistics on Building Construction Starts” (top 14 projects by room count)
The “main uses” column shows that mixed-use redevelopments — “offices, retail, hotel” or “housing, hotel, retail” — outnumber standalone hotel plans near the top of the list. The 1,000-room project in Hibino, Mihama Ward, Chiba City is a mixed-use complex with a cinema, restaurants and a bathhouse, developed on prefectural land transferred in the Makuhari New City Town Center district. The 750-room project in Chidori, Urayasu is The Royal Park Hotel Maihama Resort Tokyo Bay (ザ ロイヤルパークホテル 舞浜リゾート 東京ベイ), a large hotel within walking distance of Tokyo Disney Resort. When the plan was announced in May 2024 it was slated to open in January 2026; in July 2025 the opening date was fixed at February 13, 2026, and the hotel opened as scheduled. The scheduled completion date we held was February 2026 — an example that matched the actual opening month rather than the originally announced one.
Supply Pressure Ranking — Funabashi 33.5% and Chiba City 22.7%, Versus Under 1% in Big-City Cores
Absolute project and room counts alone cannot measure the impact on a given area. A new 300-room hotel means something entirely different in central Osaka, with some 80,000 existing rooms, than around Funabashi Station, with only about 700. We therefore took the existing room stock within a 3 km radius of each project site as the denominator and calculated what percentage of existing inventory the upcoming rooms represent.
Source: MLIT “Statistics on Building Construction Starts” / MetroEngines Research & Consulting (existing stock based on confirmed OTA listings, 3 km radius, as of 2026)
| Area (3 km radius) | Upcoming | Existing rooms | Supply pressure | Existing vs. 2019 |
|---|---|---|---|---|
| Funabashi, Chiba | 1 / 238 rooms | 711 | 33.5% | -6.8% |
| Minokamo, Gifu | 1 / 120 rooms | 517 | 23.2% | +51.6% |
| Chiba City, Chiba | 1 / 1,000 rooms | 4,408 | 22.7% | +9.4% |
| Otari, Kitaazumi District, Nagano | 1 / 159 rooms | 966 | 16.5% | +0.0% |
| Furano, Hokkaido | 1 / 200 rooms | 2,782 | 7.2% | +12.8% |
| Okayama City, Okayama | 2 / 490 rooms | 8,217 | 6.0% | +6.4% |
| Hakone, Ashigarashimo District, Kanagawa | 1 / 126 rooms | 2,320 | 5.4% | +2.2% |
| Utsunomiya, Tochigi | 1 / 300 rooms | 5,716 | 5.2% | +21.7% |
| Shibuya Ward, Tokyo | 3 / 461 rooms | 11,916 | 3.9% | +13.1% |
| Kobe, Hyogo | 2 / 293 rooms | 11,550 | 2.5% | +12.3% |
| Sapporo, Hokkaido | 4 / 710 rooms | 37,588 | 1.9% | +23.3% |
| Yokohama, Kanagawa | 1 / 272 rooms | 22,828 | 1.2% | +24.6% |
| Chiyoda Ward, Tokyo | 4 / 561 rooms | 77,720 | 0.7% | +8.3% |
| Arakawa Ward, Tokyo | 1 / 179 rooms | 29,609 | 0.6% | +26.6% |
| Kyoto City, Kyoto | 2 / 188 rooms | 36,750 | 0.5% | +32.4% |
| Osaka City, Osaka | 2 / 337 rooms | 87,011 | 0.4% | +19.9% |
| Chuo Ward, Tokyo | 1 / 197 rooms | 68,117 | 0.3% | +14.8% |
Source: Compiled by MetroEngines Research & Consulting from MLIT “Statistics on Building Construction Starts”
Funabashi tops the ranking at 33.5%. A 238-room project in Maebara-nishi, south of and away from JR Funabashi Station, accounts for a large share relative to the 711 existing rooms within 3 km. Note, however, that existing stock in this area has itself fallen 6.8% since 2019, and with such a small base the ratio swings easily. Chiba City’s 22.7% reflects the sheer size of a single 1,000-room project, making it high-impact in both scale and ratio. For a comparison of supply relative to existing stock across prefectures and municipalities from a different angle, see our Hotel Supply Pressure Ranking 2026-2027.
By contrast, big-city cores all stay within a few percent: Shibuya Ward 3.9%, Kobe 2.5%, Sapporo 1.9%, Yokohama 1.2%, Chiyoda Ward 0.7%, Kyoto 0.5%, Osaka 0.4% and Chuo Ward 0.3%. Existing stock in Kyoto and Osaka has grown sharply since 2019 — by 32.4% and 19.9% respectively — so a few hundred additional rooms are absorbed at the ratio level. The larger a city’s absolute pipeline, the smaller its supply pressure relative to existing stock: that is the pattern this tally reveals.
Treatment of areas with a small base: The ranking above is limited to areas with 500 or more existing rooms within a 3 km radius. Below that threshold the ratios become extreme, so they are shown separately for reference: Fukushima City (60 upcoming / 22 existing), Rikuzentakata (134 / 128) and Midori, Gunma (150 / 165). All are locations with almost no lodging nearby, and the fact that “a meaningful block of rooms is appearing in the area for the first time” is probably closer to reality than the ratio itself.
Sapporo — 4 Upcoming Projects / 710 Rooms, 1.9% Supply Pressure Against 38,000 Existing Rooms
To the question behind searches for “Sapporo hotel openings,” the answer within our data is 4 upcoming projects with 710 rooms: 216 rooms at Kita 1-jo Nishi 5-chome, Chuo Ward (scheduled completion October 2026); 126 rooms at Minami 7-jo Nishi 4-chome, Chuo Ward (February 2027); 168 rooms at Kita 6-jo Nishi 6-chome, Kita Ward (April 2027); and 200 rooms at Minami 7-jo Nishi 5-chome, Chuo Ward (May 2028). Two are on the Susukino side (Minami 7-jo Nishi) and two on the Sapporo Station/Odori side, spread evenly across the city center.
The 216-room project at Kita 1-jo Nishi 5-chome is Hyatt Centric Sapporo (ハイアット セントリック 札幌), located in Urbannet Sapporo Link Tower developed by NTT Urban Development. It also appears with 216 rooms under the Hokkaido area in the list of upcoming openings in Hyatt Hotels Japan’s “Press Materials, April 2026,” and the actual opening date of Saturday, October 3, 2026 was published in the operator’s announcement. The scheduled completion date in our building-plan data (October 3, 2026) matches the announced opening date exactly, showing that completion and opening can be set for the same day. The same press materials also list Park Hyatt Sapporo (157 rooms) for 2029, but that project is not included in this article’s planning data.
Existing room stock in central Sapporo (a 3 km radius centered on Sapporo Station) grew 58.3% over 14 years, from 23,865 rooms in 2012 to 37,790 rooms in 2026 — up 23.0% even against 30,713 rooms in 2019. Because the supply pressure ranking above is calculated within a 3 km radius of each project site, the same city shows existing stock of 37,588 rooms and +23.3% vs. 2019 there. The difference comes only from the choice of center point; definitions and reference dates are identical. Against this base, the 710 upcoming rooms amount to 1.9% — not enough to move the market as a whole. It reads as a stage of selective additions on top of a market that has already finished growing. For Sapporo’s 2026–2029 opening plans and movements in the high-rate segment, see our detailed analysis Sapporo Hotel Supply 2026-2029: Hyatt Opens a New High-ADR Tier.
Source: MetroEngines Research & Consulting (based on confirmed OTA listings; properties open and not yet closed at each year-end; 3 km radius centered on the main station)
Hiroshima — Zero Upcoming Supply in the Planning Data, Yet Announced Large Projects Cluster in 2027
For Hiroshima Prefecture, we have identified only one project with 50 or more rooms: 380 rooms in Matsubara-cho, Minami Ward, Hiroshima City, with a scheduled completion date of March 24, 2025 that has already passed. This is Hotel Granvia Hiroshima South Gate (380 rooms) inside minamoa, the new station building developed by the JR West Group, which also opened on March 24, 2025. In other words, in our planning data, upcoming supply in Hiroshima Prefecture is zero.
This is a real-world example of the limits of “what we can capture.” Several large hotel projects are publicly under way in Hiroshima City. Andaz Hiroshima, operated by Hyatt, was announced on October 28, 2025 to open in 2027 with 235 rooms in the high-rise tower of the Motomachi Aioi-dori District Type 1 Urban Redevelopment Project. Courtyard by Marriott Hiroshima has also been announced with 183 rooms for an early-2027 opening. Both occupy the upper floors of redevelopment towers and are therefore unlikely to appear in planning data as standalone hotel buildings. The list of upcoming openings in Hyatt Hotels Japan’s “Press Materials, April 2026” compiles announcements as of September 2025, so Andaz Hiroshima, announced in October of that year, is not included in that document.
These two projects alone add up to 418 rooms. Existing room stock within a 3 km radius of Hiroshima Station was 19,594 rooms (247 properties) as of 2026, so 418 rooms equals 2.1%. Upper-grade rooms will be concentrated in 2027 on top of a market that has already grown 23.1% from 15,913 rooms in 2019.
There are two implications for readers. First, zero in a building-plan-based pipeline does not mean “no openings planned.” Hotels that move into redevelopment towers as tenants, and conversions of existing buildings, are hard to capture as standalone hotel building plans. Second, this gap is more likely to occur in large cities. Upper-grade brands tend to occupy the upper floors of mixed-use redevelopments, so looking at planning data alone makes it easy to overlook new entrants in the high-price segment. When reading supply, building-plan data must always be checked against announced opening information. For the pipelines around Hatchobori and Hiroshima Station, see Hiroshima Hotel Supply Split — Hatchobori vs Station 2027-2029 Pipeline Analysis.
Project Map — The Distribution of All 69 Projects
Finally, we plotted the 69 identified project sites on a map. Circle size represents room count; blue marks upcoming completions and gray marks projects past their completion date. The map makes it visually clear that projects concentrate in the Tokyo metropolitan area, Hokkaido and Kansai, while Tohoku, Chugoku, Shikoku and Kyushu are very sparse.
Source: Compiled by MetroEngines Research & Consulting from MLIT “Statistics on Building Construction Starts” / Sites are plotted approximately at the town-block (chome) level (map credits shown at the bottom right of the map)
Conclusion — Read the Pipeline as “Already Grown” Rather Than “Still Growing”
Of the 69 projects and 15,189 rooms identified, only 32 projects and 6,175 rooms are not yet complete — just 40.7% of the total by room count. What this shows is that the supply-expansion phase that built up around 2020 has run its course, and the market has entered a stage of selective additions.
By area, big-city cores with large absolute pipelines also have thick existing stock, keeping supply pressure at around 1%. Conversely, in regional cities and suburbs with thin existing stock, a single mid-size hotel can reach a ratio that changes the market structure. Figures such as Funabashi 33.5%, Chiba City 22.7%, Okayama 6.0% and Utsunomiya 5.2% give operators in those areas a concrete gauge of how their competitive environment will change.
To repeat, however, this data is not a complete census. As the Hiroshima case shows, projects housed inside redevelopment towers are hard to capture, and scheduled completion dates shift with construction delays. When reading a pipeline, use building-plan data to pin down “physical supply tied to land,” then supplement it with announced opening information to capture “brand and grade entry” — reading on these two layers is what delivers practical accuracy.
Related Reading
- Kaihin-Makuhari 1,000-Room ¥30bn Mixed-Use: Breakeven ADR ¥13,200
- Hyatt Centric Sapporo Opens: Foreign Brands Reshape Hokkaido ADR
- Frozen Pipeline & the Supply Gap: Cancelled Hotel Projects and Investor Implications
- 582 Hotels Opening 2026: 30-Room Luxury vs 200+ Scale Polarization
- Sapporo Hotel Supply 2026-2029: Hyatt Opens a New High-ADR Tier
- Hiroshima Hotel Supply Split — Hatchobori vs Station 2027-2029 Pipeline Analysis
- Hotel Supply Pressure Ranking 2026-2027: Ozu Kumamoto Tops at 30.8%
References and Sources
■ Data sources
Planning data was collected and de-duplicated by MetroEngines Research & Consulting from building-plan filings including MLIT’s “Statistics on Building Construction Starts” (50+ rooms; N=69 projects / 15,189 rooms after de-duplication). Existing room stock was calculated from opening and closing records of the approximately 168,000 properties tracked by the company, summing the rooms of properties open and not yet closed at each year-end within a 3 km radius of the reference point (based on confirmed OTA listings). Brands and opening dates were individually cross-checked against materials published by each operator and developer.
■ Calculation assumptions
Supply pressure = upcoming rooms ÷ existing room stock in the same area (as of 2026). “Upcoming completion” refers to projects whose scheduled completion date falls after the survey date (September 18, 2026); earlier projects are labeled “past completion date.” The supply pressure ranking is limited to areas with 500 or more existing rooms within a 3 km radius; areas below this threshold are shown separately for reference because their ratios swing to extremes. Area center points are each project site for the supply pressure ranking and the main station for city-level trends, so the two values do not match even for the same city.
■ Limitations and caveats
This data is not a complete census but a tally of what could be identified. Plans not yet filed, hotels that move into redevelopment towers as tenants, and conversions of existing buildings are hard to capture; the Hiroshima case (zero in the planning data, but 418 rooms announced for 2027) is a real example. Scheduled completion dates can slip due to construction delays or plan changes and are not confirmed opening dates. In addition, because building-plan filings are usually made one to three years before completion, project and room counts for 2028 and later count only projects already filed and are a floor that will rise as new filings are added.
■ Planning and supply data
- Compiled by MetroEngines Research & Consulting from MLIT “Statistics on Building Construction Starts” — building plans including hotel use (50+ rooms, N=69 projects)
- MetroEngines Research & Consulting — existing room stock trends (based on confirmed OTA listings, 3 km radius, at each year-end)
■ Primary sources on brands and openings
- Hyatt Hotels Japan (日本ハイアット株式会社), “Press Materials, April 2026” — list of hotels operated in Japan and upcoming openings (announcements as of September 2025) (Japanese)
- NTT Urban Development, “General Manager Appointed for Hyatt Centric Sapporo” (Japanese)
- TRAVEL VOICE, “Luxury hotel Andaz Hiroshima to open in central Hiroshima in 2027 with 235 rooms” (October 28, 2025) (Japanese)
- AND BUILD HIROSHIMA, “Courtyard by Marriott Hiroshima to open in 2027” (Japanese)
- JR West, “Hiroshima Station Building Project” (Japanese)
- NTT Urban Development Hotel Management, “Hyatt Centric Sapporo to open on Saturday, October 3, 2026” (Japanese)
- Mitsubishi Estate, “(Tentative) Maihama Hotel Project scheduled to open in January 2026” (Japanese)
- Mitsubishi Estate Hotels & Resorts, “Opening date set and reservations open for The Royal Park Hotel Maihama Resort Tokyo Bay” (opened February 13, 2026) (Japanese)
- Nikkei, “Royal Lease to build mixed-use complex in front of Kaihin-Makuhari Station, targeting 2027” (Japanese)