

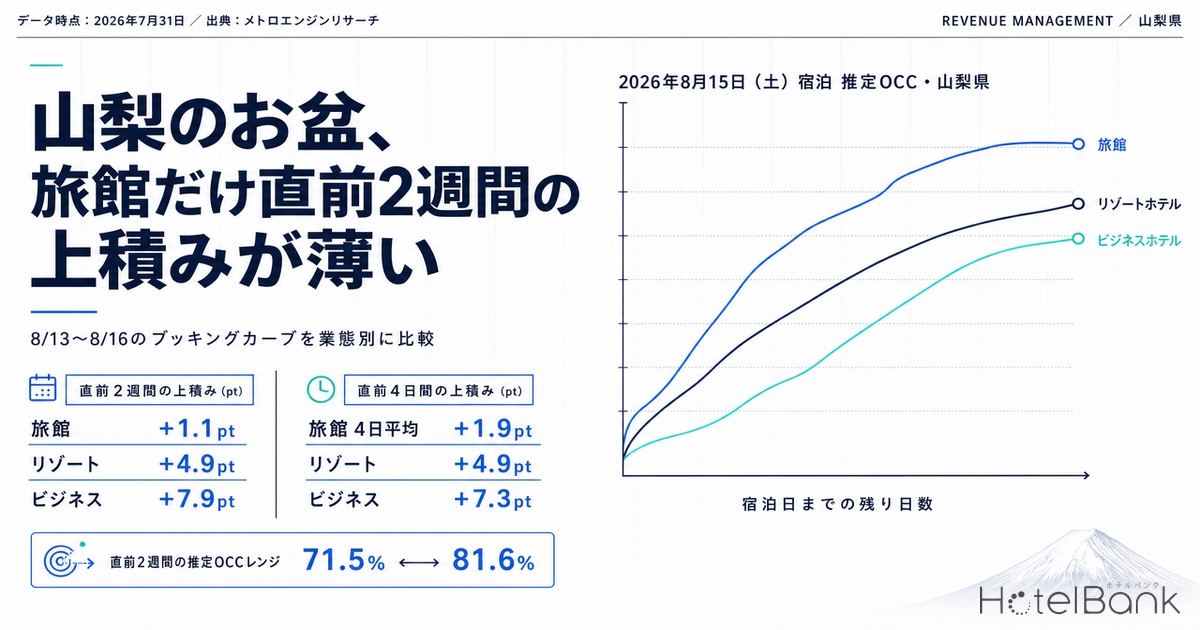
Looking at Obon in Yamanashi (August 13–16, 2026) alongside the Saturday after Obon (August 22), and lining up booking curves by property type from 45 days before the stay date through the most recent observation, ryokan, resort hotels, and business hotels diverge clearly in how they move in the final stretch. For Saturday, August 15 — the middle day of Obon — estimated OCC (target: August 2026 stays, observed as of July 31, 2026) was essentially flat for ryokan at 70.4% at T-45 → 71.7% at T-30 → 71.5% at the latest reading (T-16), while resort hotels climbed 76.7% → 80.5% → 81.6% and business hotels 72.8% → 75.2% → 80.7%. Over the 13 days from T-30 to T-17 in particular, ryokan added an average of just +1.9pt across the four days, while business hotels reached +7.3pt on August 13. This article works through, in numbers, how each property type should redesign its handling of remaining inventory over the final two weeks.
Scope: Yamanashi ryokan N=139 properties (4,255 rooms), resort hotels N=50 properties (3,026 rooms), business hotels N=67 properties (5,489 rooms). Price metrics in this article are estimated settled ADR (the settled price level estimated from OTA and other sales data, tax-exclusive equivalent); occupancy is an estimate based on OTA-listed inventory. Definitions for both appear at the end of the article. Data as of: July 31, 2026.
- — Only ryokan are standing still on Saturday, August 15 — estimated OCC went from 70.4% at T-45 to 71.5% at the latest reading (T-16), a gain of just +1.1pt. On the same date, resorts added +4.9pt and business hotels +7.9pt.
- — Pickup over the 13 days from T-30 to T-17 averaged +1.9pt for ryokan, +1.4 to +4.9pt for resorts, and +5.5 to +7.3pt for business hotels. Ryokan are capturing the least last-minute inflow.
- — Peak dates are determined by the snapshot, not the calendar — at the same lead time (T-23), ryokan show 71.6% for August 15 versus 81.8% for August 22, a 10.2pt reversal.
- — Sunday, August 16 is a trough shared across all types — at T-17, business hotels sit at 71.4% and ryokan at 72.5%, or −12.9pt and −6.8pt respectively versus August 13.
- — Hold your price yardstick monthly — for the confirmed months (January–June 2026), estimated settled ADR was +0.0% YoY for ryokan, +0.7% for resorts, and +7.8% for business hotels.
Fixed snapshots across the four Obon days — only the ryokan curve is flat
First, for each stay date we took four snapshots — T-45, T-30, T-17, and the most recent reading — and lined them up by property type. The observation window runs from 45 days before the stay date to the latest reading. We show the number of properties observed (N) at each snapshot because the observed property count varies by date even at the same lead time, and reading a snapshot with an extremely thin sample at face value can manufacture peaks and troughs that do not exist. In fact, the T-45 snapshot for August 16 captured only N=7 ryokan, N=2 resorts, and N=7 business hotels, so for that date alone we substituted the T-44 snapshot (ryokan N=113, resorts N=46, business N=60) as the baseline. For August 22, the latest reading is T-23, so the T-17 column is left blank.
| Stay date | Property type | T-45 | T-30 | T-17 | Latest | Period gain |
|---|---|---|---|---|---|---|
| Aug 13 (Thu) | Ryokan | 75.3% (N=109) | 77.0% (N=114) | 79.3% (N=122) | 80.4% (T-14, N=134) | +5.1pt |
| Resort | 79.1% (N=45) | 83.2% (N=46) | 88.1% (N=46) | 88.3% (T-14, N=47) | +9.2pt | |
| Business | 74.1% (N=60) | 77.0% (N=61) | 84.3% (N=64) | 86.0% (T-14, N=67) | +11.9pt | |
| Aug 14 (Fri) | Ryokan | 74.4% (N=111) | 74.5% (N=118) | 76.8% (N=136) | 76.7% (T-15, N=134) | +2.3pt |
| Resort | 76.1% (N=45) | 81.6% (N=47) | 84.8% (N=49) | 84.5% (T-15, N=47) | +8.4pt | |
| Business | 75.2% (N=61) | 77.2% (N=61) | 82.7% (N=67) | 84.3% (T-15, N=67) | +9.1pt | |
| Aug 15 (Sat) | Ryokan | 70.4% (N=110) | 71.7% (N=120) | 73.0% (N=137) | 71.5% (T-16, N=134) | +1.1pt |
| Resort | 76.7% (N=45) | 80.5% (N=45) | 81.9% (N=48) | 81.6% (T-16, N=47) | +4.9pt | |
| Business | 72.8% (N=60) | 75.2% (N=61) | 80.7% (N=67) | 80.7% (T-16, N=67) | +7.9pt | |
| Aug 16 (Sun) | Ryokan | 68.1% (T-44, N=113) | 70.9% (N=114) | 72.5% (N=134) | 72.5% (T-17, N=134) | +4.4pt |
| Resort | 75.4% (T-44, N=46) | 78.2% (N=46) | 80.3% (N=47) | 80.3% (T-17, N=47) | +4.9pt | |
| Business | 64.4% (T-44, N=60) | 65.9% (N=61) | 71.4% (N=67) | 71.4% (T-17, N=67) | +7.0pt | |
| Aug 22 (Sat) | Ryokan | 79.1% (N=107) | 80.0% (N=113) | — | 81.8% (T-23, N=134) | +2.7pt |
| Resort | 79.8% (N=46) | 84.3% (N=45) | — | 86.3% (T-23, N=47) | +6.5pt | |
| Business | 74.7% (N=62) | 80.5% (N=62) | — | 83.0% (T-23, N=67) | +8.3pt |
Source: MetroEngines Research, compiled by the HotelBank Editorial Team
Comparing period gain (the difference in estimated OCC between the baseline snapshot and the latest reading) across property types, ryokan came in under +5pt on four of the five days, and on August 15 they moved only +1.1pt. On that same August 15, resort hotels gained +4.9pt and business hotels +7.9pt — meaning ryokan alone have tracked at roughly the same level for the past month and a half. The ryokan figure for August 15 started at 70.4% at T-45, the second-lowest starting point among the five days after August 16 (68.1%), and that low starting point has carried straight through to the latest reading.
Source: MetroEngines Research, compiled by the HotelBank Editorial Team
The shape of the curves makes the difference even clearer. For August 15, resort hotels and business hotels hold a consistently upward slope from T-45 onward, whereas ryokan simply oscillate within a narrow band from the high 69% range to the low 72% range, with no meaningful slope emerging. They read 71.8% around T-20, 71.7% at T-19, 72.2% at T-18, and 73.0% at T-17 — briefly reaching the 73% range at T-17 — before slipping back to 71.5% at the latest reading of T-16. Because listed inventory may have been added or withdrawn, this single day of give-back should not be read as weakening demand on its own; at minimum, though, the pattern is not one of “filling up all at once at the last minute.”
Where in the 13 days did the pickup land? Isolating T-30 to T-17
Because the lead time of the latest snapshot differs by stay date (T-14 for August 13, T-17 for August 16), the snapshots must be aligned to compare pickup speed side by side. So for the four Obon days we isolated only the 13 days from T-30 to T-17 and measured, by property type, how many points of estimated OCC (target: August 2026 stays, observed as of July 31, 2026) accumulated over that window. This is a thick section: every date in the range has N=45 or more observations (ryokan N=114–137, resorts N=45–49, business N=61–67).
Source: MetroEngines Research, compiled by the HotelBank Editorial Team
Ryokan added +2.3pt on August 13, +2.3pt on August 14, +1.3pt on August 15, and +1.6pt on August 16, for a four-day average of +1.9pt. Resort hotels posted +4.9pt / +3.2pt / +1.4pt / +2.1pt, and business hotels +7.3pt / +5.5pt / +5.5pt / +5.5pt. Business hotels accumulated at more than twice the ryokan pace on all four days, and with little variation by date. In other words, the property type capturing this 13-day booking inflow most consistently is business hotels, and the type capturing it least is ryokan. The same question — how a high level at T-45 corresponds to the remaining runway in the final stretch — is examined within an identical framework in Tochigi Booking Curves by Type: Resort 81.1% at T-45, Only +2.6pt Left.
One more pattern is common to every property type: the weakness of Sunday, August 16. At the T-17 snapshot, ryokan sit at 72.5% and resorts at 80.3%, while business hotels are at 71.4%. That is 12.9pt below the business-hotel figure for August 13 (84.3%), confirming that the depth of demand differs entirely between the start and the end of Obon. Since the final day of Obon is the travel-home day, the motivation to add a night within the prefecture is thin — a premise that applies across all property types.
Conversely, the date worth watching is Saturday, August 22, after Obon. Because its latest snapshot sits at a longer lead time (T-23) than the other dates, aligning it with the T-23 snapshot for August 15 gives: ryokan 71.6% for August 15 versus 81.8% for August 22, a gap of +10.2pt; resort hotels 82.6% versus 86.3%, or +3.7pt; and business hotels 78.3% versus 83.0%, or +4.7pt. At the same lead time, the Saturday after Obon sits at a higher level than the middle day of Obon. The ryokan gap in particular exceeds 10pt, showing that the weakness of August 15 is not a reflection of “August being weak across Yamanashi” but a pinpoint phenomenon specific to the middle day of Obon.
Where does August estimated settled ADR stand?
In thinking through moves for the remaining two weeks, the price yardstick is worth checking as well. Because estimated settled ADR is based on monthly figures, we do not handle daily or day-of-week price levels here. First, we organize the YoY comparison by property type for January–June 2026, where confirmed values can be compared against confirmed values.
| Month (confirmed) | Ryokan 2026 | YoY | Resort 2026 | YoY | Business 2026 | YoY |
|---|---|---|---|---|---|---|
| January | ¥14,572 | +19.3% | ¥19,050 | +11.4% | ¥7,988 | +12.9% |
| February | ¥12,440 | -0.0% | ¥16,254 | -2.5% | ¥7,594 | +8.4% |
| March | ¥12,272 | -2.0% | ¥19,398 | +8.4% | ¥7,858 | +5.0% |
| April | ¥12,728 | -1.6% | ¥20,181 | -2.1% | ¥7,874 | +5.9% |
| May | ¥12,747 | -4.3% | ¥20,802 | +2.0% | ¥8,163 | +7.6% |
| June | ¥10,683 | -11.0% | ¥16,396 | -11.9% | ¥7,650 | +7.4% |
| Jan–Jun average | ¥12,574 | +0.0% | ¥18,680 | +0.7% | ¥7,854 | +7.8% |
Source: MetroEngines Research, compiled by the HotelBank Editorial Team / Properties covered: ryokan N=154–172, resorts N=55–59, business N=72–75 (varies by month)
Looking only at confirmed months, the first-half average YoY change was essentially flat for ryokan (+0.0%), +0.7% for resort hotels, and +7.8% for business hotels. Business hotels exceeded the prior-year month in all six months, so rate lift has been working steadily. Ryokan and resort hotels, by contrast, posted double-digit growth in January and then ran flat or below the prior year from February onward, with a sharp drop in June (ryokan -11.0%, resorts -11.9%). In terms of lifting rates through the first half, the gap between property types is clear.
Source: MetroEngines Research, compiled by the HotelBank Editorial Team
Overlaying the years, both ryokan and resort hotels in Yamanashi form their annual peak in August. Confirmed values for August 2025 were ¥14,835 for ryokan (N=148) and ¥25,790 for resort hotels (N=58) — a level for ryokan on par with November and December, and the annual high for resort hotels. Current estimates for August 2026 are ¥14,734 for ryokan (N=158), ¥23,714 for resort hotels (N=57), and ¥12,337 for business hotels (N=73). These are estimates based on current sales conditions, however, and rest on a different basis from confirmed values; a straightforward comparison against confirmed figures requires waiting for month-end confirmation. Note also that within Yamanashi itself, the Fuji Five Lakes, Yatsugatake, and the Kofu Basin have considerably different supply and demand structures.
It is also worth noting that the current August 2026 estimates differ in character by property type. Set against the confirmed values for August 2025, ryokan move from ¥14,835 to ¥14,734 (−0.7%) and resort hotels from ¥25,790 to ¥23,714 (−8.0%), while business hotels jump from ¥8,618 to ¥12,337 (+43.2%) — a conspicuous divergence. Given that the YoY change for business hotels in the confirmed months (January–June 2026) was +7.8%, this +43.2% is likely an estimate pulled by the mix of inventory currently on sale rather than a reflection of underlying demand. If you use the August level for business hotels as a benchmark for your own property, it is safer to treat it as provisional until confirmed values are published.
For revenue managers running ryokan, resorts, and business hotels in Yamanashi — implications and an action plan
1. Confirm which market curve you are benchmarking your own pace against. Even within the same Obon period in Yamanashi, the 13-day pickup from T-30 to T-17 averages +1.9pt for ryokan versus +5.5 to +7.3pt for business hotels — a gap of more than 2x. If a ryokan builds its remaining-inventory plan on the assumption that it will “fill up at the last minute like a business hotel,” that premise does not match the market curve to begin with. Start by re-checking your own pickup performance over the same window against the market curve for your property type.
2. Do not treat August 15 and August 22 as equally strong dates. Aligned at the same lead time (T-23), ryokan show 71.6% for August 15 versus 81.8% for August 22 — a 10.2pt gap. The conventional assumption that the middle day of Obon must be the strongest is reversed by the actual ordering. If you are already holding generous inventory and pricing for the Saturday after Obon, that allocation is likely in step with current progress. If instead you have locked in conditions treating August 15 as your strongest date, there is room to revisit.
3. Assume Sunday, August 16 is a trough regardless of property type. At the T-17 snapshot, business hotels are at 71.4%, ryokan 72.5%, and resort hotels 80.3% — the lowest of the four Obon days. For business hotels, the gap to August 13 (84.3%) is 12.9pt. This is not a date to hold out on in the belief that “it should still fill up”; it is more likely a candidate for switching to a design that picks it up as the final night of a stay.
4. Hold your price yardstick monthly. YoY change for the confirmed months is +0.0% for ryokan, +0.7% for resorts, and +7.8% for business hotels (all January–June 2026 averages). Business hotels are the type securing rate lift, while ryokan and resorts sit in flat territory. When you move inventory over the remaining two weeks, holding the monthly estimated settled ADR level as a baseline (current August 2026 estimates: ryokan in the ¥14,700s, resorts in the ¥23,700s, business hotels in the ¥12,300s — the business figure is provisional, diverging +43.2% from the confirmed ¥8,618 for August last year) makes it easier to distinguish loosening conditions from discounting.
Building on the above, here is a set of proposed actions organized around the final two weeks. None of these guarantee results; judge whether to adopt them against your own booking position.
| Time horizon | Action | Decision trigger (check against the figures in this article) | Objective |
|---|---|---|---|
| Today–this week (T-14 to T-10) | Audit consecutive-night restrictions and minimum-stay conditions across the Obon period on a date-by-date basis, and loosen any multi-night requirements remaining on 8/15 and 8/16 so that single nights can be accepted | When your own progress for 8/15 falls below the market T-16 snapshot — 71.5% for ryokan, 81.6% for resorts, 80.7% for business hotels | Create a landing point for single-night demand and capture the segment previously screened out by conditions |
| Prepare a two-night product with 8/15 check-in that builds 8/16 (Sun) in as the final night of a consecutive stay | When the T-17 snapshot for 8/16 stays clearly below 8/13 — 72.5% for ryokan and 71.4% for business hotels versus 79.3% and 84.3% respectively | Absorb the closing day, which is hard to move on its own, by pairing it with the preceding night | |
| Within two weeks (T-10 to T-3) | Increase exposure of last-minute allocations. Open up suspended room types and allocations with different meal conditions, such as room-only, limited to dates where inventory remains | When ryokan pickup from T-30 to T-17 stays around the market average of +1.9pt and your own property is tracking below that | Expand the exposure surface and secure a route to guests who move at the last minute |
| Before moving price, confirm where your property sits relative to the monthly estimated settled ADR level (current August estimates: ryokan in the ¥14,700s, resorts in the ¥23,700s, business hotels in the ¥12,300s, the last being provisional), then decide | When your August settings remain well above the market levels above while progress alone is running below the market | Separate whether loosening conditions is enough or a price adjustment is required | |
| Toward next month (late August–September) | Treat the post-Obon weekend including 8/22 (Sat) as a selling target on par with Obon itself, and revisit the allocation of inventory and conditions | When the T-23 snapshot shows 8/22 at 81.8% for ryokan, 86.3% for resorts, and 83.0% for business hotels, exceeding the same snapshot for 8/15 (71.6% / 82.6% / 78.3%) | Shift the allocation so that demand remaining after Obon is not left on the table |
| Record your own pickup for this Obon at the three snapshots of T-45, T-30, and T-17, and keep it as the baseline for next season’s Obon rate-revision calendar | How far this season’s three snapshots deviated from the market curve (for ryokan, the shape of 70.4% at T-45 → 71.7% at T-30 → 73.0% at T-17) | Make “when to move” a decision based on snapshots rather than instinct next season |
Source: MetroEngines Research, compiled by the HotelBank Editorial Team
Conclusion — three yardsticks
Yardstick 1: the slope of the curve differs by property type. Across the four Obon days in Yamanashi, estimated OCC accumulated over the 13 days from T-30 to T-17 (target: August 2026 stays, observed as of July 31, 2026) averaged +1.9pt for ryokan, +1.4 to +4.9pt for resort hotels, and +5.5 to +7.3pt for business hotels. When you evaluate your own last-minute pickup, the comparison is only meaningful against “the curve for the same property type in the same prefecture.”
Yardstick 2: peak dates are set by the snapshot, not the calendar. Compared at the same lead time (T-23), ryokan show 71.6% for August 15 against 81.8% for August 22. The premise that the middle day of Obon is the strongest does not hold, at least in Yamanashi this season. The relative strength of dates is worth re-verifying every season using snapshots at the same lead time.
Yardstick 3: hold price monthly and occupancy daily. YoY change in estimated settled ADR for the confirmed months is +0.0% for ryokan, +0.7% for resorts, and +7.8% for business hotels (January–June 2026 average). Between property types that have secured rate lift and those that have not, the order of operations for handling last-minute inventory — whether to loosen conditions or move price — also changes. Establish the monthly level first, then work on daily progress, and keep that sequence intact.
About the data
| Definition of estimated OCC | Occupancy based on OTA-listed inventory = 100 − 100 × rooms remaining on OTA listings ÷ total rooms. It is an estimate based on how inventory sold via OTAs is being consumed, and is defined differently from actual room occupancy (it reads higher). This article labels it “estimated OCC (OTA-listed inventory basis).” The target month is August 2026. |
| Booking curve | Based on observations from 45 days before the stay date through the most recent reading. Fixed points are the T-45, T-30, T-17, and latest snapshots. For August 16 alone, the number of properties observed at the T-45 snapshot was small, so the T-44 snapshot was used as the baseline. |
| Definition of estimated settled ADR | The settled price level (tax-exclusive equivalent) estimated from OTA and other sales data (lowest-plan levels × property-type coefficients, an ensemble across multiple channels). Past months are confirmed values; the current and future months are estimates based on current sales conditions. Median error of 6.6% when matched against published operating results. |
| Breakdown of properties covered (N) | Booking curve: Yamanashi ryokan N=139 properties / 4,255 rooms (for August 22, N=138 properties / 4,241 rooms), resort hotels N=50 properties / 3,026 rooms, business hotels N=67 properties / 5,489 rooms. The number of properties actually observed at each snapshot is noted in the body text and tables. Estimated settled ADR: ryokan N=146–172, resort hotels N=54–60, business hotels N=69–75 (varies by month). |
| Data as of | Data as of: July 31, 2026. Sales conditions and inventory change daily, so the figures in this article are a snapshot at the time of retrieval. |
Source: MetroEngines Research, compiled by the HotelBank Editorial Team