

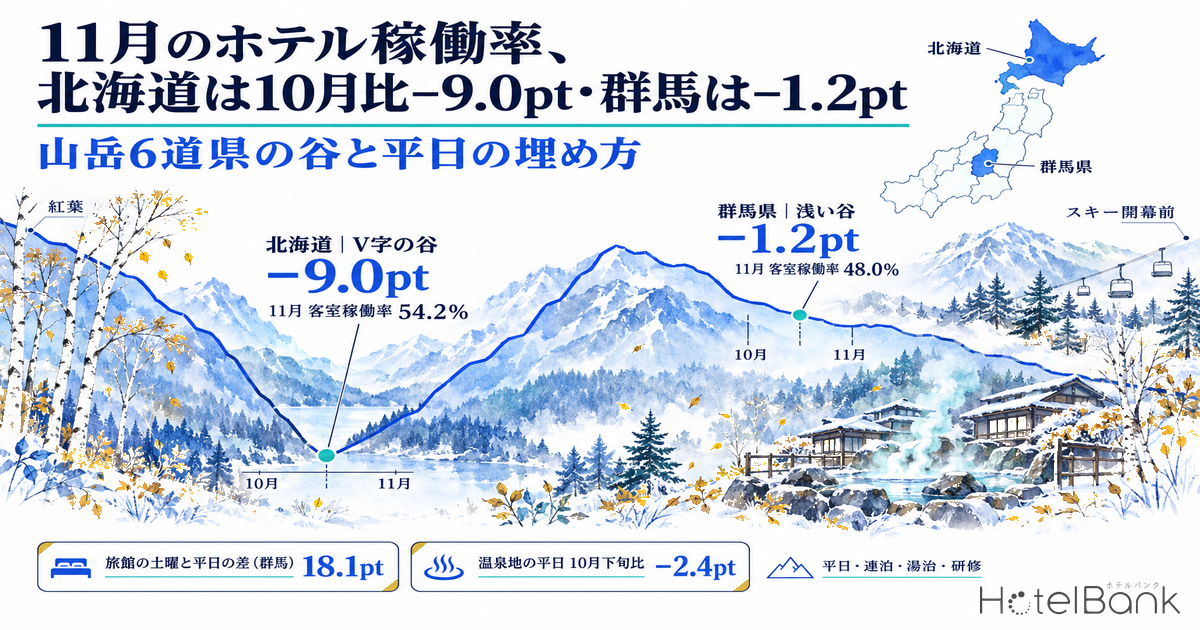
Comparing 2025 room occupancy for October and November in the Japan Tourism Agency’s Overnight Travel Statistics Survey, Hokkaido fell 9.0pt from 63.2% to 54.2%, while Gunma slipped only 1.2pt, from 49.2% to 48.0%. November, which falls between the autumn-foliage and ski seasons, does not produce a trough of the same timing or depth even among prefectures with mountain and highland resorts. For six prefectures — Hokkaido, Yamagata, Gunma, Niigata, Nagano and Gifu — this article overlays public statistics from the past two seasons with booking status at 45 days before arrival for early-to-mid November 2026, to identify what the places that fill rooms without cutting rates have in common, and which November demand is there to be captured.
Metric Definitions Used in This Article
Room occupancy (Japan Tourism Agency): Final annual figures (Table 8) from the Japan Tourism Agency’s Overnight Travel Statistics Survey. Month-by-month comparisons of the past two seasons use these public statistics.
OCC (occupancy rate): The share of rooms sold against total rooms in the area (an estimate based on OTA sales inventory), used for this season’s interim readings. It reflects how inventory offered on OTAs is being absorbed and differs from a property’s actual overall occupancy. Coverage is properties listing at least 30% of their total rooms on major booking sites; because both the population and the definition differ from the Japan Tourism Agency’s room occupancy, levels are not compared across the two — we read differences between dates within the same population.
LT (lead time): Days remaining until check-in. All of this season’s data in this article are snapshots taken 45 days before arrival (LT45), observed between mid-July and October 3, 2026.
ADR (average daily rate): An estimated settled rate (tax-exclusive equivalent), calculated by applying a segment-specific adjustment factor to the lowest-priced plan each property publishes on OTAs (per room, two guests per room, tax-inclusive). Checked against property-level results disclosed by listed hotel REITs (91 properties, most recent 3 months), the median error is about 7%. It is an estimate and differs from each property’s actual transaction prices and accounting figures. Area-level ADR is the median of the properties covered. Where listed prices are mentioned, they are per-room rates for two guests (tax-inclusive, average across all plans).
Data sources: Japan Tourism Agency, Overnight Travel Statistics Survey; MetroEngines Research
- — Only Hokkaido has a V-shaped trough: In the Japan Tourism Agency’s final 2025 figures, Hokkaido’s room occupancy fell 9.0pt from 63.2% in October to 54.2% in November, then recovered to 59.5% in December. The five Honshu prefectures step down into December instead.
- — Gunma and Gifu dip only slightly: From October to November 2025, Gunma fell 1.2pt and Gifu 3.0pt — in line with or close to the national figure (−1.2pt).
- — Ryokan rates rose in November: In 2025, the estimated settled ADR for November exceeded October in all six prefectures, with an index of 102.4–117.2 (Gunma: about ¥15,300 → ¥18,000).
- — The trough sits on weekdays: For ryokan in early November 2026, the gap between Saturday and weekday estimated OCC at 45 days out is 18.1pt in Gunma, 11.7pt in Nagano and 10.0pt in Gifu.
- — Onsen towns −2.4pt, city tourism −7.2pt: Difference in weekday estimated OCC across 24 municipalities (Nov 3–17 vs late October, at 45 days out). Adding 2pt on weekdays equals about 9,100 room-nights across ryokan in the six prefectures.
November in the Past Two Seasons — Hokkaido Has a V-Shaped Trough; the Five Honshu Prefectures Step Down into December
First, we locate the trough in the 2024 and 2025 monthly figures, for which final data are complete. The Japan Tourism Agency publishes by month and does not break out the early, middle and late parts of a month. So we placed October (peak foliage) and December (the start of the ski season) at either end and looked at where November sits between them.
| Prefecture | Oct 2024 | Nov | Dec | Nov − Oct (pt) | Oct 2025 | Nov | Dec | Nov − Oct (pt) |
|---|---|---|---|---|---|---|---|---|
| Hokkaido | 65.9 | 55.7 | 58.7 | −10.2 | 63.2 | 54.2 | 59.5 | −9.0 |
| Yamagata | 58.7 | 52.0 | 44.9 | −6.7 | 57.5 | 52.6 | 43.2 | −4.9 |
| Gunma | 48.2 | 47.2 | 43.4 | −1.0 | 49.2 | 48.0 | 43.4 | −1.2 |
| Niigata | 49.4 | 44.1 | 37.6 | −5.3 | 50.7 | 48.0 | 42.3 | −2.7 |
| Nagano | 44.6 | 39.7 | 34.0 | −4.9 | 42.4 | 37.4 | 33.3 | −5.0 |
| Gifu | 59.4 | 55.2 | 46.0 | −4.2 | 63.6 | 60.6 | 50.0 | −3.0 |
| Japan (national) | 64.6 | 64.7 | 58.7 | +0.1 | 66.6 | 65.4 | 59.5 | −1.2 |
Source: Compiled by the HotelBank Editorial Team from the Japan Tourism Agency’s Overnight Travel Statistics Survey, final annual figures for 2024 and 2025 (Table 8). Unit: %
Of the six prefectures, only Hokkaido shows a clear trough in November. It fell 10.2pt from 65.9% to 55.7% in 2024 and 9.0pt from 63.2% to 54.2% in 2025, recovering to 58.7% and 59.5% respectively in December. The five Honshu prefectures, by contrast, keep the November decline within 1.0–6.7pt, but their December monthly average drops further, giving a staircase rather than a trough. Because ski demand concentrates toward year-end, the first half of December appears to pull the monthly average down.
Gunma recorded the smallest declines, −1.0pt in 2024 and −1.2pt in 2025, moving almost exactly with the national figures (+0.1pt and −1.2pt). Gifu (−4.2pt and −3.0pt) came next. Even among “mountain prefectures,” then, some treat November as an empty spell after the foliage, while others manage to use it as an extension of autumn.
Figure 1. Room occupancy in Hokkaido (monthly). Source: Compiled by the HotelBank Editorial Team from the Japan Tourism Agency’s Overnight Travel Statistics Survey
Figure 2. Room occupancy in Gunma (monthly). Source: Compiled by the HotelBank Editorial Team from the Japan Tourism Agency’s Overnight Travel Statistics Survey
Splitting by property type narrows down who owns the trough. Hokkaido’s resort hotels fell 20.5pt from 50.4% to 29.9% in 2025 before returning to 57.8% in December — a deep V. Resort hotels in Niigata (32.5% → 24.8% → 31.9%) and Nagano (37.5% → 29.4% → 31.1%) moved the same way. In Gunma, by contrast, ryokan held flat at 47.5% and resort hotels actually rose from 49.5% to 50.7%, while Yamagata’s ryokan barely moved, from 48.6% to 48.7%. Business hotels in all six prefectures held 69.9–80.2% in November.
| Prefecture | Property type | Oct 2025 | Nov | Dec | Nov − Oct (pt) | Dec − Nov (pt) |
|---|---|---|---|---|---|---|
| Hokkaido | Ryokan | 48.7 | 36.5 | 37.0 | −12.2 | +0.5 |
| Hokkaido | Resort hotel | 50.4 | 29.9 | 57.8 | −20.5 | +27.9 |
| Hokkaido | Business hotel | 78.6 | 72.4 | 74.7 | −6.2 | +2.3 |
| Yamagata | Ryokan | 48.6 | 48.7 | 35.3 | +0.1 | −13.4 |
| Yamagata | Resort hotel | 39.9 | 31.0 | 24.7 | −8.9 | −6.3 |
| Yamagata | Business hotel | 80.3 | 72.5 | 60.3 | −7.8 | −12.2 |
| Gunma | Ryokan | 47.5 | 47.5 | 37.5 | ±0.0 | −10.0 |
| Gunma | Resort hotel | 49.5 | 50.7 | 35.2 | +1.2 | −15.5 |
| Gunma | Business hotel | 75.7 | 77.6 | 76.4 | +1.9 | −1.2 |
| Niigata | Ryokan | 32.7 | 29.3 | 25.9 | −3.4 | −3.4 |
| Niigata | Resort hotel | 32.5 | 24.8 | 31.9 | −7.7 | +7.1 |
| Niigata | Business hotel | 77.9 | 69.9 | 56.9 | −8.0 | −13.0 |
| Nagano | Ryokan | 27.2 | 22.8 | 22.9 | −4.4 | +0.1 |
| Nagano | Resort hotel | 37.5 | 29.4 | 31.1 | −8.1 | +1.7 |
| Nagano | Business hotel | 86.2 | 80.2 | 68.3 | −6.0 | −11.9 |
| Gifu | Ryokan | 48.2 | 43.5 | 35.1 | −4.7 | −8.4 |
| Gifu | Resort hotel | 55.1 | 51.5 | 39.9 | −3.6 | −11.6 |
| Gifu | Business hotel | 80.4 | 79.0 | 66.6 | −1.4 | −12.4 |
Source: Compiled by the HotelBank Editorial Team from the Japan Tourism Agency’s Overnight Travel Statistics Survey, final annual figures for 2025 (Table 8). Unit: %
Rates Did Not Fall in November — Ryokan ADR Exceeded October in All Six Prefectures in 2025
Against that dip in volume, how did rates move? Indexing ryokan’s November estimated settled ADR from MetroEngines Research to October = 100 gives 96.4–104.0 for 2024 and 102.4–117.2 for 2025. In 2025, November exceeded October in all six prefectures, with Gunma rising from ¥15,300 to ¥18,000 and Niigata from ¥13,300 to ¥15,200. At least for ryokan, the November trough shows up in volume, not in price. In Nagano, ryokan and resort hotels saw only their off-peak-month rates fall below the previous year in 2026, with settled ADR moving from +21.9% year on year in January to −0.1% in June.
| Prefecture | Ryokan 2024 | Ryokan 2025 | Ryokan 2026 (estimate at survey date) | Ryokan ADR, Nov 2025 | Ryokan properties covered (Nov of each year) | Business 2025 |
|---|---|---|---|---|---|---|
| Hokkaido | 96.4 | 102.4 | 92.8 | ¥9,419 | 275 / 245 / 247 | 91.4 |
| Yamagata | 98.2 | 110.8 | 96.2 | ¥13,778 | 190 / 175 / 166 | 95.2 |
| Gunma | 104.0 | 117.2 | 104.3 | ¥17,972 | 294 / 265 / 261 | 103.8 |
| Niigata | 96.6 | 114.7 | 103.9 | ¥15,213 | 246 / 231 / 224 | 101.5 |
| Nagano | 98.8 | 111.2 | 99.1 | ¥14,256 | 534 / 485 / 465 | 100.6 |
| Gifu | 103.7 | 109.1 | 99.7 | ¥16,432 | 254 / 208 / 219 | 96.6 |
Source: Compiled by MetroEngines Research and the HotelBank Editorial Team. Index = November estimated settled ADR ÷ October of the same year × 100. The 2026 figure is an estimate based on listed rate levels at the survey date (early October 2026); because its basis differs from that of finalized months, it is shown only relative to October of the same year.
Figure 3. Ryokan estimated settled ADR, November index (October of each year = 100). Source: Compiled by MetroEngines Research and the HotelBank Editorial Team
Hokkaido, however, looks different. Its ryokan index was 96.4 in 2024 and 92.8 in the 2026 survey-date estimate, and business hotels also fell to 91.4 in 2025. Where volume and rate retreat together, as in Hokkaido, the levers to pull in November differ from those in Honshu’s onsen prefectures, where only volume retreats and rates hold. At the 2026 survey date, ryokan in Gunma (104.3) and Niigata (103.9) are heading into November priced slightly above October.
Interim Readings for Early-to-Mid November 2026 — At 45 Days Out, the Trough Sits on Weekdays
We now turn to this season’s bookings. Because our inventory-based estimated OCC began in March 2026, it cannot be set against the same lead time a year or two earlier. Instead, we aligned each stay date on “how full it was 45 days before arrival” and compared stays from September through November 17 on the same yardstick. Stays from November 18 onward are more than 45 days away and are not covered here. Stays from November 4 onward are more than 30 days from today, so all figures below are interim readings while bookings are still building.
| Prefecture | Segment | Coverage | Weekday, late Oct | Weekday, early Nov | Weekday, mid-Nov | Early Nov − late Oct (pt) | Saturday, late Oct | Saturday, Nov 7 | Saturday, Nov 14 | Weekday listed price, late Oct | Same, early Nov |
|---|---|---|---|---|---|---|---|---|---|---|---|
| Hokkaido | All properties | 752 properties / 55,231 rooms | 65.5 | 57.4 | 58.8 | −8.1 | 80.2 | 66.8 | 66.6 | ¥22,676 | ¥20,535 |
| Hokkaido | Ryokan | 154 properties / 6,879 rooms | 64.0 | 57.8 | 61.0 | −6.2 | 72.4 | 71.1 | 67.1 | ¥25,552 | ¥25,471 |
| Hokkaido | Resort | 92 properties / 9,879 rooms | 65.6 | 64.5 | 65.1 | −1.1 | 74.9 | 75.3 | 72.6 | ¥31,638 | ¥30,427 |
| Hokkaido | Business | 219 properties / 26,786 rooms | 64.6 | 53.8 | 55.4 | −10.8 | 82.6 | 62.7 | 63.5 | ¥13,834 | ¥11,514 |
| Yamagata | All properties | 177 properties / 6,334 rooms | 59.8 | 55.4 | 53.8 | −4.4 | 74.0 | 72.2 | 63.9 | ¥21,653 | ¥20,937 |
| Yamagata | Ryokan | 106 properties / 2,830 rooms | 64.8 | 60.0 | 56.9 | −4.8 | 71.1 | 69.8 | 73.3 | ¥26,917 | ¥26,195 |
| Yamagata | Resort | 15 properties / 651 rooms | 61.9 | 57.0 | 58.2 | −4.9 | 77.6 | 74.3 | 65.7 | ¥25,610 | ¥22,735 |
| Yamagata | Business | 23 properties / 1,989 rooms | 54.0 | 47.8 | 48.5 | −6.2 | 73.6 | 73.0 | 48.3 | ¥11,654 | ¥11,416 |
| Gunma | All properties | 352 properties / 14,419 rooms | 58.6 | 56.5 | 55.6 | −2.1 | 74.2 | 71.9 | 68.9 | ¥24,890 | ¥25,439 |
| Gunma | Ryokan | 176 properties / 5,660 rooms | 66.2 | 63.9 | 65.5 | −2.3 | 80.3 | 82.0 | 83.1 | ¥31,138 | ¥31,264 |
| Gunma | Resort | 23 properties / 2,198 rooms | 49.6 | 40.8 | 42.6 | −8.8 | 64.0 | 56.3 | 54.2 | ¥23,958 | ¥24,201 |
| Gunma | Business | 51 properties / 4,804 rooms | 56.0 | 56.9 | 51.6 | +0.9 | 73.8 | 70.3 | 63.1 | ¥11,144 | ¥11,519 |
| Niigata | All properties | 281 properties / 13,442 rooms | 60.6 | 55.6 | 59.9 | −5.0 | 71.4 | 63.2 | 66.0 | ¥21,246 | ¥21,059 |
| Niigata | Ryokan | 136 properties / 3,283 rooms | 66.3 | 62.9 | 62.1 | −3.4 | 78.4 | 76.2 | 77.3 | ¥28,850 | ¥29,419 |
| Niigata | Resort | 15 properties / 2,835 rooms | 77.0 | 72.4 | 82.7 | −4.6 | 75.2 | 69.2 | 82.2 | ¥23,396 | ¥23,526 |
| Niigata | Business | 51 properties / 6,164 rooms | 50.9 | 45.8 | 50.5 | −5.1 | 66.3 | 54.8 | 54.7 | ¥10,823 | ¥10,627 |
| Nagano | All properties | 696 properties / 22,172 rooms | 68.6 | 64.9 | 64.0 | −3.7 | 80.3 | 80.2 | 77.4 | ¥27,658 | ¥27,763 |
| Nagano | Ryokan | 264 properties / 6,282 rooms | 67.4 | 64.0 | 65.9 | −3.4 | 78.1 | 75.7 | 78.2 | ¥29,750 | ¥29,899 |
| Nagano | Resort | 63 properties / 4,176 rooms | 74.0 | 72.9 | 68.0 | −1.1 | 80.2 | 87.0 | 79.2 | ¥41,545 | ¥43,944 |
| Nagano | Business | 82 properties / 7,619 rooms | 70.8 | 64.6 | 63.8 | −6.2 | 86.8 | 85.8 | 79.9 | ¥15,117 | ¥14,288 |
| Gifu | All properties | 284 properties / 10,938 rooms | 70.4 | 67.2 | 65.2 | −3.2 | 82.8 | 78.7 | 79.2 | ¥25,494 | ¥26,266 |
| Gifu | Ryokan | 131 properties / 3,438 rooms | 80.4 | 78.8 | 77.4 | −1.6 | 88.2 | 88.8 | 88.6 | ¥30,208 | ¥31,621 |
| Gifu | Business | 60 properties / 5,667 rooms | 64.0 | 60.4 | 58.1 | −3.6 | 79.6 | 73.9 | 74.2 | ¥16,619 | ¥16,799 |
Source: Compiled by MetroEngines Research and the HotelBank Editorial Team. Estimated OCC (%) is at 45 days before arrival and covers properties listing at least 30% of total rooms on major booking sites (major booking site basis). Weekdays are Monday–Thursday nights (excluding Nov 2, the eve of a holiday); averages cover 6 nights for late October, 5 nights for early November and 4 nights for mid-November (Nov 11–17). Saturday for late October is the average of Oct 24 and Oct 31. Gifu resorts (6 properties) are excluded because no values were obtained.
Across all properties on weekdays, the decline from late October to early November was largest in Hokkaido at −8.1pt, while Gunma was −2.1pt. The same ordering seen in public statistics over the past two seasons is already visible at 45 days out. Weekday listed prices also fell in Hokkaido, from ¥22,700 to ¥20,500, whereas in Gunma they rose from ¥24,900 to ¥25,400 and in Gifu from ¥25,500 to ¥26,300.
Split by segment, ryokan Saturdays have not weakened in November. Gunma ryokan stood at 80.3% for late-October Saturdays, 82.0% for Saturday, November 7 and 83.1% for Saturday, November 14, and Gifu was almost flat at 88.2% → 88.8% → 88.6%. In other words, what remains as a trough is the weekday side. Comparing Saturday with weekdays for ryokan in early November, the gap was 18.1pt in Gunma (82.0% vs 63.9%), 11.7pt in Nagano (75.7% vs 64.0%) and 10.0pt in Gifu (88.8% vs 78.8%). How the trough day differs by segment in Gunma is covered in Gunma Day-of-Week OCC: Ryokan Trough Wed 78.9%, Business Sun 81.3%.
Figure 4. Ryokan weekday estimated OCC (at 45 days out, by ten-day period). Source: Compiled by MetroEngines Research and the HotelBank Editorial Team. Coverage: Hokkaido 154 properties / 6,879 rooms, Yamagata 106 / 2,830, Gunma 176 / 5,660, Niigata 136 / 3,283, Nagano 264 / 6,282, Gifu 131 / 3,438 (major booking site basis)
Tracing Figure 4 from early September, ryokan in the five Honshu prefectures build toward late October and then give back 2–5pt in November. Hokkaido alone hovered around 66% from September, falling from 64.0% in late October to 57.8% in early November. With foliage arriving earlier in Hokkaido, its autumn peak itself comes before Honshu’s, and November is a long wait for snow. Shiga Kogen has announced that its 2026-27 season opens on Saturday, December 5, so Honshu’s main ski areas get moving only after the November window covered here.
What Shallow-Trough Municipalities Have in Common — Onsen Towns Average −2.4pt, City Tourism −7.2pt
Taking the prefectural averages down to municipalities shows where the gap comes from. We took the 24 municipalities in the six prefectures with at least 20 properties covered, grouped them by main character into onsen towns, highland/ski and city tourism, and compared late-October weekdays with weekdays from November 3 to 17 (9 Monday–Thursday nights).
Figure 5. Difference in weekday estimated OCC (Nov 3–17 weekdays − late-October weekdays, at 45 days out, pt). Source: Compiled by MetroEngines Research and the HotelBank Editorial Team
| Prefecture | Municipality | Main character | Coverage | Weekday, late Oct | Weekday, Nov 3–17 | Diff (pt) | 2025 ADR index (Oct = 100) | ADR sample N | November listing retention |
|---|---|---|---|---|---|---|---|---|---|
| Hokkaido | Furano | Highland / ski | 25 properties / 623 rooms | 53.5 | 60.1 | +6.6 | 95.1 | 12 | 103% |
| Nagano | Yamanouchi | Onsen town | 50 properties / 1,474 rooms | 67.5 | 69.9 | +2.4 | 113.4 | 90 | 90% |
| Gunma | Shibukawa | Onsen town | 45 properties / 2,079 rooms | 58.3 | 60.5 | +2.2 | 128.1 | 46 | 98% |
| Niigata | Yuzawa | Highland / ski | 30 properties / 2,758 rooms | 73.0 | 73.9 | +0.9 | 118.4 | 39 | 90% |
| Niigata | Minamiuonuma | Highland / ski | 23 properties / 467 rooms | 55.3 | 55.4 | +0.1 | 100.1 | 24 | 84% |
| Yamagata | Yonezawa | City tourism | 20 properties / 502 rooms | 53.1 | 52.6 | −0.5 | 106.6 | 31 | 108% |
| Gunma | Nakanojo | Onsen town | 26 properties / 544 rooms | 64.4 | 63.9 | −0.5 | 106.0 | 33 | 100% |
| Nagano | Chino | Highland / ski | 62 properties / 1,409 rooms | 57.5 | 55.0 | −2.5 | 95.8 | 39 | 92% |
| Gifu | Gero | Onsen town | 36 properties / 1,512 rooms | 73.4 | 70.8 | −2.6 | 119.7 | 43 | 95% |
| Nagano | Karuizawa | Highland / ski | 84 properties / 2,636 rooms | 70.5 | 67.2 | −3.3 | 103.6 | 52 | 105% |
| Nagano | Nagano City | City tourism | 43 properties / 2,396 rooms | 73.2 | 69.4 | −3.8 | 108.1 | 72 | 99% |
| Gunma | Kusatsu | Onsen town | 72 properties / 2,120 rooms | 65.8 | 61.8 | −4.0 | 115.1 | 77 | 101% |
| Nagano | Hakuba | Highland / ski | 37 properties / 670 rooms | 72.2 | 67.7 | −4.5 | 115.1 | 35 | 104% |
| Gunma | Minakami | Onsen town | 49 properties / 1,603 rooms | 67.2 | 62.4 | −4.8 | 109.8 | 46 | 95% |
| Gifu | Gujo | Highland / ski | 24 properties / 332 rooms | 58.2 | 53.1 | −5.1 | 120.6 | 25 | 103% |
| Niigata | Myoko | Highland / ski | 25 properties / 694 rooms | 64.7 | 59.5 | −5.2 | 117.6 | 40 | 89% |
| Hokkaido | Sapporo Minami Ward | Onsen town | 21 properties / 2,492 rooms | 62.1 | 56.2 | −5.9 | 97.6 | 22 | 97% |
| Yamagata | Kaminoyama | Onsen town | 20 properties / 573 rooms | 61.5 | 55.3 | −6.2 | 115.3 | 18 | 93% |
| Gifu | Takayama | City tourism | 124 properties / 3,681 rooms | 89.2 | 82.8 | −6.4 | 88.4 | 119 | 94% |
| Yamagata | Yamagata City | City tourism | 41 properties / 2,190 rooms | 62.2 | 55.1 | −7.1 | 103.1 | 58 | 99% |
| Gunma | Tsumagoi | Highland / ski | 36 properties / 1,261 rooms | 41.2 | 30.8 | −10.4 | 103.4 | 24 | 90% |
| Hokkaido | Hakodate | City tourism | 94 properties / 6,809 rooms | 64.1 | 53.3 | −10.8 | 93.5 | 80 | 100% |
| Nagano | Matsumoto | City tourism | 80 properties / 3,429 rooms | 82.5 | 71.6 | −10.9 | 97.3 | 98 | 97% |
| Hokkaido | Otaru | City tourism | 38 properties / 2,158 rooms | 58.5 | 47.3 | −11.2 | 92.3 | 25 | 95% |
Source: Compiled by MetroEngines Research and the HotelBank Editorial Team. Estimated OCC (%) covers all segments at 45 days before arrival, for properties listing at least 30% of total rooms on major booking sites (major booking site basis). ADR index = November 2025 estimated settled ADR ÷ October of the same year × 100. Listing retention = properties with listed prices observed in November 2025 ÷ properties in August of the same year. “Main character” is an editorial classification.
Simple averages of the difference were −2.4pt for the 8 onsen-town municipalities (319 properties / 12,397 rooms), −2.6pt for the 9 highland/ski municipalities (346 properties / 10,850 rooms) and −7.2pt for the 7 city-tourism cities (440 properties / 21,165 rooms). Shibukawa (Ikaho) was +2.2pt, Nakanojo (Shima) −0.5pt and Yamanouchi (Yudanaka-Shibu and Shiga Kogen) +2.4pt — towns built around hot springs are heading into November at almost the same pace as late October. City-tourism destinations such as Matsumoto (−10.9pt), Hakodate (−10.8pt) and Otaru (−11.2pt), by contrast, fall further because their October levels are higher.
Rates pointed the same way. The 2025 ADR index (October = 100) averaged 113.1 for onsen towns, 107.7 for highland/ski and 98.5 for city tourism. With Shibukawa at 128.1, Gero at 119.7 and Kusatsu at 115.1, onsen towns raised rates in November while holding volume. Likely factors are that the season overlaps with foliage descending from high elevations to the onsen towns, and that the hot springs themselves are the purpose of the trip and depend less on weather or scenery. Within Gifu, the autumn rate peak also falls in different months by municipality — October in Takayama, November in Gero.
Year-round operation, on the other hand, was not decisive. The share of properties listed in August that remained listed in November ranged from 84% to 108% across the 24 municipalities, with no visible link to trough depth. Within highland/ski, towns improving toward mid-November, such as Furano (+6.6pt) and Yuzawa (+0.9pt), sit alongside villages with large declines, such as Tsumagoi (−10.4pt), leaving a spread that location type alone cannot explain.
The other common factor is whether non-leisure stays are in the mix. Splitting the Japan Tourism Agency’s statistics by purpose of stay, in November 2025 Nagano properties where “leisure guests are 50% or more” had room occupancy of 24.0%, versus 68.6% for those “under 50%.” In Gunma, occupancy at under-50% properties rose from 69.0% in October to 71.7% in November, suggesting that weekday demand — business trips, training and construction-related stays — props up the November floor.
November Demand to Capture and Where It Lands — Weekdays, Extended Stays, Toji Bathing Retreats and Training
Putting this together, November in mountain-resort prefectures looks like “Saturdays and onsen towns fill; weekdays, city tourism and highland areas leave room.” Converting that room into rooms, 1pt of weekday estimated OCC equals about 57 rooms per night in Gunma’s 5,660-room ryokan cohort and about 63 in Nagano’s 6,282 rooms. Given the 10–18pt gap to Saturday, the scope for adding weekday business is not small. The table below lists where that demand can land, by type of demand.
| Demand to capture | Property types best placed to absorb it | Clues in this article’s data |
|---|---|---|
| Individual and senior travelers on weekdays (Mon–Thu nights) | Ryokan in onsen towns | Ryokan Saturdays stay at late-October levels through mid-November. The gap to weekdays is 18.1pt in Gunma, 11.7pt in Nagano and 10.0pt in Gifu (at 45 days out) |
| Extended stays and toji (therapeutic bathing) retreats | Ryokan in onsen towns; highland lodgings with kitchens and laundry | In Nagano ryokan extended-stay plan names (N=286), “multi-night discount” appears in 44%, “selected days only” in 43% and “open-air hot spring” in 30% |
| Corporate training, group camps and business trips | Resort hotels with meeting rooms; ryokan closer to cities | Properties with under 50% leisure guests had November 2025 room occupancy of 71.7% in Gunma, 72.0% in Gifu and 68.6% in Nagano (Japan Tourism Agency) |
| Early demand ahead of ski-season opening | Lodgings in highland and ski locations | In Furano, Yuzawa and Yamanouchi, mid-November weekdays are running above late October in interim readings (Furano +7.6pt, Yuzawa +6.3pt, Yamanouchi +6.2pt) |
Source: Compiled by the HotelBank Editorial Team from the Japan Tourism Agency’s Overnight Travel Statistics Survey and MetroEngines Research
For individual guests on weekdays, the easier design is to change conditions on weekdays only without disturbing Saturday levels. Ryokan Saturdays are already around 80% at 45 days out, so there is little need to move weekend prices. Weekday-only perks and multi-night conditions limited to certain days can be layered on to extend stays into the first half of the week. The record of onsen towns pricing November above October shows that discounting is not the only way to fill weekdays.
Extended stays and toji retreats are levers that simply stretch an onsen town’s strengths. Combinations such as simplified housekeeping from the second night in exchange for a perk, or optional dinner to give guests more freedom, already appear among published plans. For corporate training and group camps, the statistic that properties with a lower leisure share run higher November occupancy is the clue. For resort hotels and ryokan with meeting rooms or large banquet halls, post-foliage weekdays are likely a good time to widen capacity for training groups.
In regions where volume and rate both retreat, as in Hokkaido, it helps to change the order of priorities. Early-November weekdays stand at 57.4% at 45 days out with a listed price of ¥20,500 — a step down from late October. Here, rather than chasing rate, the realistic approach is to capture urban business demand in Sapporo, Hakodate and elsewhere early (weekday depth by day of week is covered in Hokkaido Business Hotels Aren’t Weekend-Led: Thu 95.4% Ties Sat 95.4%), along with early stays ahead of ski-season opening, and carry that into the December ramp-up. The interim reading showing Furano improving toward mid-November suggests that movement may already be under way.
For hotels: plan-name hints for this theme
Most common selling points in published plan names for Nagano × ryokan × extended stays (N=286) —
Multi-night discount 44%Selected days only 43%Two meals included 34%Open-air hot spring 30%Room only 19%Business 12%
Actual name examples (anonymized):
• [Multi-night eco plan / breakfast included] ¥550 off with no room cleaning! Free outdoor sauna (for business & solo travelers)
• [Multi-night eco plan / room only] ¥550 off with no room cleaning! Free outdoor sauna (for business & solo travelers)
* Trends based on aggregated published plan names; they do not show that naming causes sales. Source: Compiled by MetroEngines Research and the HotelBank Editorial Team
Converting Weekday Upside into Room-Nights — Sensitivity Across Ryokan Cohorts in Six Prefectures
To put the “scope for adding weekday business” from the previous section into units with a sense of scale, we multiplied the room count of each ryokan cohort in Table 4 by the number of points weekday estimated OCC could be raised, and summed across the 16 weekday nights of November 2026 (Monday–Thursday nights, excluding November 2, the eve of a holiday). The uplift columns can be read as +2pt conservative, +6pt moderate and +10pt aggressive.
| Prefecture | Ryokan cohort | Gap to Saturday (pt) | +2pt | +4pt | +6pt | +8pt | +10pt |
|---|---|---|---|---|---|---|---|
| Hokkaido | 6,879 rooms | 13.3 | 2,201 | 4,403 | 6,604 | 8,805 | 11,006 |
| Yamagata | 2,830 rooms | 9.8 | 906 | 1,811 | 2,717 | 3,622 | 4,528* |
| Gunma | 5,660 rooms | 18.1 | 1,811 | 3,622 | 5,434 | 7,245 | 9,056 |
| Niigata | 3,283 rooms | 13.3 | 1,051 | 2,101 | 3,152 | 4,202 | 5,253 |
| Nagano | 6,282 rooms | 11.7 | 2,010 | 4,020 | 6,031 | 8,041 | 10,051 |
| Gifu | 3,438 rooms | 10.0 | 1,100 | 2,200 | 3,300 | 4,401 | 5,501 |
| Six-prefecture total | 28,372 rooms | — | 9,079 | 18,158 | 27,237 | 36,316 | 45,395 |
Source: Estimates by MetroEngines Research and the HotelBank Editorial Team. Room counts are the ryokan cohorts from Table 4 (major booking site basis). “Gap to Saturday” is the difference in estimated OCC between ryokan Saturday (Nov 7) and weekdays in early November (at 45 days out). Additional room-nights = rooms × uplift (pt) × 16 nights. * marks cells where the uplift exceeds the gap to Saturday — an assumption above weekend levels, shown for reference.
Gunma has an 18.1pt gap to Saturday, so even +10pt would not reach weekend levels. At about 906 room-nights per point, it is one of the combinations where uplift pays off most among the six prefectures. Nagano, with more rooms, has the largest scale per point at about 1,005 room-nights, reaching about 6,000 room-nights at +6pt. Yamagata, by contrast, has only a 9.8pt gap to Saturday, so +10pt would mean exceeding weekend levels. Across ryokan in all six prefectures, lifting weekdays by just 2pt amounts to about 9,100 room-nights, and 6pt to about 27,200. These figures convert the size of the opportunity; they do not show that the demand already exists.
FAQ
Q. Which mountain resort areas see the steepest drop in November occupancy?
A. In the Japan Tourism Agency’s final 2025 figures, Hokkaido had the largest decline of the six prefectures, with room occupancy falling from 63.2% in October to 54.2% in November. For resort hotels alone it dropped from 50.4% to 29.9%, before returning to 57.8% in December.
Q. Do room rates also fall in November?
A. For ryokan, the estimated settled ADR in November exceeded October in all six prefectures in 2025 (102.4–117.2 with October = 100). The occupancy trough and rate movements do not necessarily coincide.
Q. How far along are bookings for November 2026?
A. In interim readings at 45 days before arrival, ryokan Saturdays are at almost the same level as late October, while weekdays in early November (Nov 3–10) are 1.6–6.2pt below late October. Stays from November 18 onward are not covered because the observation period is too short.
Q. Is there demand supporting November weekdays?
A. Splitting the Japan Tourism Agency’s statistics by purpose of stay, properties where leisure guests are under 50% had November 2025 room occupancy of 71.7% in Gunma, 72.0% in Gifu and 68.6% in Nagano. Non-leisure stays — business trips, training and construction-related work — support the post-foliage weekday floor.
Q. How many room-nights would a few points of weekday uplift add?
A. As shown in Table 7, converting over the 16 weekday nights of November 2026 (Monday–Thursday nights, excluding Nov 2), each point equals about 906 room-nights for Gunma’s 5,660-room ryokan cohort and about 1,005 room-nights for Nagano’s 6,282 rooms. A guide to the upper limit of uplift is the gap to early-November Saturdays (Gunma 18.1pt, Nagano 11.7pt).
Summary
November in the six prefectures with mountain and highland resorts was not a single, uniform off-season. In public statistics, only Hokkaido forms a V-shaped trough; the five Honshu prefectures step down into December with November as a shoulder, and Gunma and Gifu decline only slightly from October. Ryokan rates in November exceeded October in all six prefectures in 2025, so the trough lies in volume — and specifically on weekdays.
In this season’s 45-day-out snapshot, too, the eight onsen-town municipalities averaged −2.4pt, tracking close to late October. The 10–18pt gap to Saturday can be read as room to fill with weekday, extended-stay, toji and training demand. We plan a follow-up on the late-November three-day weekend (November 21–23) and early December, using the same yardstick, as observations accumulate.
⚠ Note on ADR for future dates: The ADR and listed prices for October–November 2026 in this article are estimates based on selling prices published on OTAs at the survey date (early October 2026) and will change as check-in approaches. Estimated OCC is likewise an interim reading at 45 days before arrival and does not indicate final occupancy.
References & Sources
■ Data sources
Japan Tourism Agency, Overnight Travel Statistics Survey, final annual figures for 2024 and 2025 (Table 8: room occupancy by prefecture × property type × share of leisure guests). MetroEngines Research estimated settled ADR (monthly by prefecture and municipality, October 2024–November 2026, ryokan and business hotels), estimated OCC and listed prices at 45 days before arrival (stays from September 1 to November 17, 2026; six prefectures and 24 municipalities; observed mid-July to October 3, 2026), and aggregated published plan names for Nagano × ryokan × extended stays (N=286).
■ Estimation assumptions
Weekdays are Monday–Thursday nights (excluding Nov 2, the eve of a holiday). Estimated OCC by ten-day period is the simple average of each stay date’s value at 45 days out; differences by municipality type are simple averages of each municipality’s difference. ADR index = November estimated settled ADR ÷ October of the same year × 100, with 2026 an estimate based on listed rate levels at the survey date. Additional room-nights in Table 7 = ryokan cohort rooms from Table 4 × uplift (pt) × 16 weekday nights in November 2026.
■ Limitations
Because the Japan Tourism Agency’s room occupancy and estimated OCC differ in population and definition, their levels are not compared. Estimated OCC has been observed since March 2026 and cannot be compared with the same lead time in prior years. November 2026 figures are interim readings more than 30 days before arrival and do not indicate final occupancy. Stay dates from November 18 onward have no 45-day-out snapshot yet and are excluded. The “main character” classification is editorial. Table 7 converts the size of the opportunity and does not guarantee that the demand exists.
■ References
- Japan Tourism Agency, Overnight Travel Statistics Survey (宿泊旅行統計調査) — Final annual results for 2024 and 2025 (Table 8: room occupancy by prefecture, property type and share of leisure guests)
- Cabinet Office, “About National Holidays” (国民の祝日について) — 2026 holidays (Culture Day, November 3; Labor Thanksgiving Day, November 23)
- Shiga Kogen Resort Development Council, “2026-2027 Lift Ticket and Season Pass Prices” (志賀高原リゾート開発協議会) — 2026-27 season operating period
- MetroEngines Research — estimated settled ADR (by prefecture and municipality, October 2024–November 2026); estimated OCC and listed prices at 45 days before arrival (stays from September 1 to November 17, 2026; six prefectures and 24 municipalities); aggregated published plan names (N=286)