

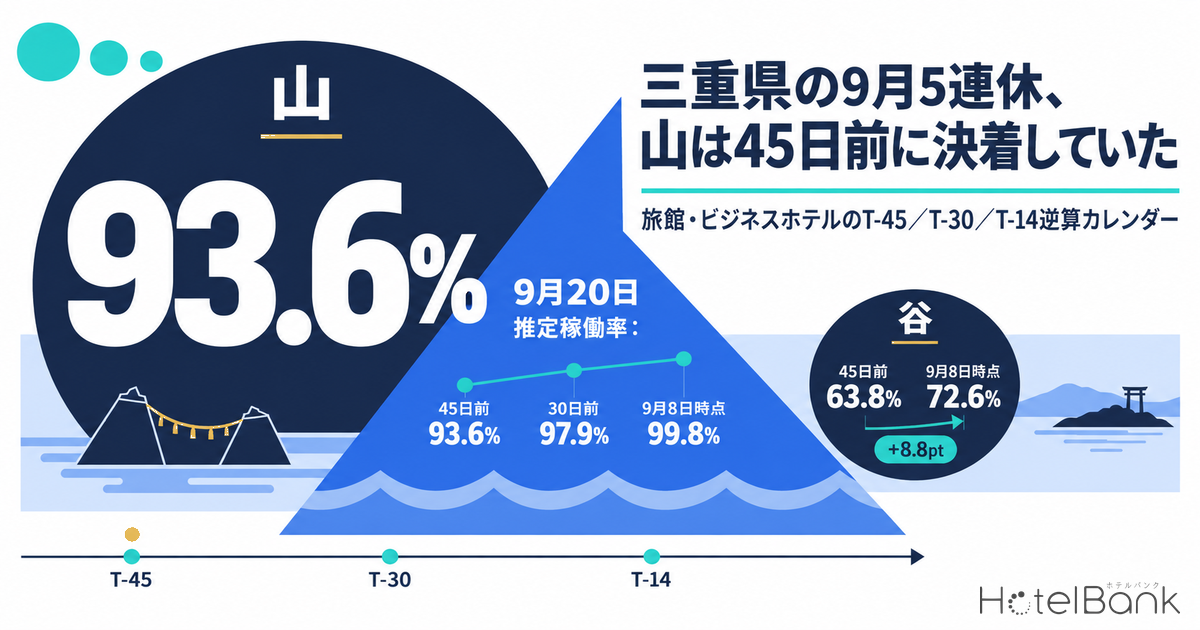
From Saturday, 19 September to Wednesday, 23 September 2026 (Autumnal Equinox Day), Japan gets its first five-day holiday in 11 years. At ryokan in Mie Prefecture, estimated occupancy (OTA-listed inventory basis) for Sunday, 20 September — the centre of the holiday — had already reached 93.6% (182 properties observed) 45 days before the stay date. It was 97.9% at 30 days out and 99.8% as of 8 September. In other words, demand on the peak side was settled before revenue managers had a chance to act. By contrast, Wednesday, 23 September — the back end of the same holiday — moved from 63.8% at 45 days out to 72.6% as of 8 September, a gain of just +8.8pt over more than 30 days. Even within one “holiday,” the right move differs completely by date. This article breaks down the peaks and troughs of the holiday for ryokan and business hotels in Mie at three checkpoints — T-45, T-30 and T-14 — and turns them into a backward-planned working calendar.
About the data in this article
Coverage: ryokan in Mie Prefecture, N≈190 properties (about 5,000 rooms) / business hotels, N≈88 properties (about 9,900 rooms), both based on listings on major booking sites. Estimated settled ADR covers ryokan N=205 properties and business hotels N=93 properties (August 2026, final month). Price metrics in this article are estimated settled ADR (the settled price level estimated from OTA and other sales data, tax-exclusive equivalent); occupancy is an estimate based on OTA-listed inventory. Both are defined at the end of the article. Data as of: 9 September 2026.
- — Estimated occupancy at Mie ryokan for Sep 20 (Sun) was 93.6% at 45 days before the stay. The gain from there to Sep 8 was only +6.2pt: the peak day was settled at T-45.
- — The timing of the squeeze differs by 15 days between property types. For the same Sep 20, the T-45→T-30 gain was +4.3pt for ryokan versus +10.5pt for business hotels.
- — Within the same 65–79% band at T-45, dates that gained +6.0pt or more by T-30 added +19.6 to +21.0pt by Sep 8, while those that gained less than +3.0pt added only +1.8 to +3.8pt. For trough-leaning dates, the checkpoint that decides is T-30, not T-45.
- — Troughs do not fill on their own. The ryokan sold-out property rate for Oct 2 (Fri) fell from 18.1% at T-45 to 16.5% as of Sep 8: additions to listed inventory are outpacing demand.
- — In a comparison of six neighbouring prefectures, Mie’s Sep 20 settled earliest at 93.6% at T-45, and its Sep 23 gain of +8.8pt was the smallest of the six. Weakness on the last day of the holiday is especially pronounced in Mie.
The holiday’s peak was essentially settled 45 days out
In Silver Week 2026, Monday 21 September is Respect for the Aged Day and Wednesday 23 September is Autumnal Equinox Day. Under the National Holidays Act, Tuesday 22 September, sandwiched between the two, becomes a Citizens’ Holiday, creating a five-day run from Saturday 19 to Wednesday 23 September (Source: Cabinet Office, “About National Holidays”). What Mie’s actual data show is that the five days are not uniformly strong.
The booking curve below plots estimated occupancy for Mie ryokan from 45 days before the stay date to the latest observation, for four representative dates. The Sep 20 (Sun) line already starts high at 93.6% at 45 days out, and the gain over those 45 days up to 99.8% as of Sep 8 is only +6.2pt. Rather than “rising,” the curve “hugs the ceiling and runs flat.” This does not signal weak demand — on the contrary, it means rooms sold so early that there was no headroom left by 45 days out. Even when the same holiday was measured at the T-31 checkpoint, estimated ryokan OCC had already reached 97.5%; that interim picture is tracked in Mie Silver Week: Sep 20 Ryokan 97.5% at T-31, Sep 23 Just 66.1%.
Source: compiled by the HotelBank Editorial Team from MetroEngines Research
In contrast, the Sep 22 (Tue, Citizens’ Holiday) line starts at 72.4% at 45 days out, reaches 78.3% at 30 days and 92.8% as of Sep 8 — a clear upward climb. Its gain of +20.4pt is the largest of the four dates. This is a date that fills with late demand. Sep 23 (Wed, Autumnal Equinox Day) gained +8.8pt from 63.8% at 45 days out, and Oct 2 (Fri) moved just +3.8pt, from 66.0% at 45 days out to 69.8% as of Sep 8. That curve is almost flat: left alone, the date will reach the stay date at the same level.
Business hotels show the same peak-and-trough structure, but their rise comes later than at ryokan. Sep 20 (Sun) was 83.2% at 45 days out, 93.7% at 30 days and 99.8% as of Sep 8, adding +10.5pt in the 15 days from T-45 to T-30 alone. Given that ryokan gained +4.3pt over the same window, business hotels read as a segment that “looks as if it still has room at T-45, then tightens sharply around T-30.” Sep 21 (Mon, Respect for the Aged Day) followed the same shape: 80.1% at 45 days out → 90.2% at 30 days → 99.7% as of Sep 8. Put the other way, a business hotel that turns cautious based on its remaining inventory at T-45 will miss the rapid pickup that follows.
| Stay date | Ryokan T-45 | Ryokan T-30 | Ryokan as of 9/8 | Business T-45 | Business T-30 | Business as of 9/8 |
|---|---|---|---|---|---|---|
| Sep 19 (Sat) | 83.4% | 89.2% | 97.6% | 78.3% | 84.8% | 97.9% |
| Sep 20 (Sun) | 93.6% | 97.9% | 99.8% | 83.2% | 93.7% | 99.8% |
| Sep 21 (Mon, Respect for the Aged Day) | 90.1% | 97.0% | 99.6% | 80.1% | 90.2% | 99.7% |
| Sep 22 (Tue, Citizens’ Holiday) | 72.4% | 78.3% | 92.8% | 67.8% | 74.6% | 88.8% |
| Sep 23 (Wed, Autumnal Equinox Day) | 63.8% | 66.8% | 72.6% | 62.0% | 65.2% | 70.2% |
| Sep 24 (Thu) | 68.3% | 72.0% | 77.5% | 65.5% | 69.7% | 76.8% |
| Sep 26 (Sat) | 72.1% | 77.4% | 81.5% | 81.9% | 86.0% | 90.1% |
| Oct 2 (Fri) | 66.0% | 68.8% | 69.8% | 67.1% | 71.0% | 75.0% |
| Oct 6 (Tue) | 69.0% | 71.2% | 70.8% | 56.9% | 63.4% | 65.4% |
Estimated occupancy in Mie (OTA-listed inventory basis). T-45 / T-30 are observations 45 and 30 days before the stay date; “as of 9/8” is the observation on 8 September 2026 (11–28 days remaining to the stay date). Properties observed: ryokan 172–187, business hotels 81–89.
Source: compiled by the HotelBank Editorial Team from MetroEngines Research
The back end of the holiday and the weekdays after it barely move from their T-45 levels
Looking only at estimated occupancy, one might read it as “Sep 22 has reached 92.8%, and Sep 23 has built up to 72.6%.” But lining up the sold-out property rate (the estimated share of properties with no listed inventory visible on OTAs and similar channels) reveals a sharp break between peaks and troughs.
Source: compiled by the HotelBank Editorial Team from MetroEngines Research
For ryokan, the sold-out property rate for Sep 20 (Sun) climbed from 65.8% at 45 days out → 88.1% at 30 days → 97.9% as of Sep 8, leaving the prefecture’s ryokan market with almost no open inventory. Sep 21 (Mon, Respect for the Aged Day) went 55.0% → 82.2% → 95.8%. By contrast, Sep 23 (Wed, Autumnal Equinox Day) went 21.9% → 23.4% → 24.0%, moving just +2.1pt in the 30 days after T-45. Occupancy rising 8.8pt while the sold-out rate stays almost flat indicates that “bookings trickled thinly into some properties, but no more properties sold out.” This weakness on Sep 23 is not unique to Mie: Silver Week 2026 Back Half at T-47: Sep 23 Matches a Normal Wednesday confirms at the T-47 checkpoint that, nationwide, the same date is pacing no differently from an ordinary Wednesday.
In October the pattern grows stronger. The ryokan sold-out property rate for Oct 2 (Fri) actually fell: 18.1% at 45 days out → 17.0% at 30 days → 16.5% as of Sep 8. That reflects newly added inventory outweighing new bookings — a sign that demand is not moving. Oct 6 (Tue) was flat too, at 27.4% → 27.9% → 26.8%. Business hotels are even more extreme: Sep 23 (Wed) went 5.6% → 4.4% → 5.6%, and Oct 6 (Tue) stayed at 3.4% across all three checkpoints. The heat of the holiday does not spill over into the following weeks at all.
The one exception is business hotels on Sep 26 (Sat). Their sold-out property rate rose from 24.4% at 45 days out → 26.7% at 30 days → 36.7% as of Sep 8, and estimated occupancy from 81.9% → 86.0% → 90.1% (as of 8 September 2026). That is strong even against ryokan on the same date, at 81.5% estimated occupancy (as of 8 September 2026) and a 23.8% sold-out property rate. On the Saturday after the holiday, the remaining demand sits with business hotels rather than ryokan.
September is one of Mie’s lowest months of the year for estimated settled ADR
It is worth checking the price axis here. Plotting estimated settled ADR for Mie ryokan year over year, September is the month every year when the level drops sharply from August. The final figure for September 2025 was ¥15,576 (N=202 properties), well below ¥19,218 (N=205 properties) in August of that year. September 2024 was ¥15,837 (N=227 properties), the same shape of decline from ¥18,229 in August.
Source: compiled by the HotelBank Editorial Team from MetroEngines Research
Comparing final months year over year, the latest final month, August 2026, came in at ¥17,869 for ryokan (N=205 properties), -7.0% from ¥19,218 a year earlier (N=205 properties). Business hotels were at ¥7,696 (N=93 properties), -1.6% from ¥7,825 a year earlier (N=95 properties). Comparing last year’s September with the one before, ryokan in September 2025 at ¥15,576 (N=202 properties) were -1.6% against ¥15,837 in September 2024 (N=227 properties), and business hotels in September 2025 at ¥6,365 (N=95 properties) were +4.9% against ¥6,068 in September 2024 (N=97 properties).
| Segment / month | Estimated settled ADR | N (properties) | Basis |
|---|---|---|---|
| Ryokan, Aug 2025 | ¥19,218 | 205 | Final |
| Ryokan, Aug 2026 | ¥17,869 | 205 | Final (YoY -7.0%) |
| Ryokan, Sep 2025 | ¥15,576 | 202 | Final (YoY -1.6%) |
| Ryokan, Sep 2026 | ¥14,570 | 205 | Current estimate |
| Ryokan, Oct 2026 | ¥14,644 | 196 | Current estimate |
| Business hotels, Aug 2025 | ¥7,825 | 95 | Final |
| Business hotels, Aug 2026 | ¥7,696 | 93 | Final (YoY -1.6%) |
| Business hotels, Sep 2026 | ¥9,652 | 90 | Current estimate |
| Business hotels, Oct 2026 | ¥10,114 | 89 | Current estimate |
September and October 2026 are estimates based on current sales and may change. A like-for-like comparison with final figures has to wait until the month is finalised.
Source: compiled by the HotelBank Editorial Team from MetroEngines Research
Note that the business hotel figures for September and October 2026 in Table 2 (¥9,652 and ¥10,114) are current estimates and cannot be compared directly with the final figure for the same month a year earlier (¥6,365 in September 2025). A current estimate is the level inferred from inventory now on sale. For business hotels, the three core holiday days had tightened to 99.7–99.8% estimated occupancy as of Sep 8, so lower-priced inventory has already been absorbed and the estimate is drawn from what remains listed; it therefore tends to come out above the level the full month will show once finalised. Calculating a year-over-year change for these two months is meaningless. Only final months can be compared (ryokan, August 2026: -7.0%; business hotels, August 2026: -1.6%).
In sum, September in Mie is “a price trough for the month as a whole, yet a month in which only the three holiday days tighten to the extreme.” Of the five-day holiday, Sep 19–21 entered high occupancy market-wide by the T-45 stage, Sep 22 caught up with late demand, and Sep 23 onward is heading toward the stay date flat at its T-45 level. With monthly estimated settled ADR in a trough, any rate not captured on these three peak days is hard to win back over the month as a whole.
The gain from T-45 to T-30, more than the T-45 level, decided where dates landed
So far we have looked at the curves date by date, but regrouping all 18 observations — 9 dates × 2 property types — reveals another structure. Even at the same T-45 level, how much a date gained by T-30 sharply splits how it builds afterwards. Below, the 18 observations are sorted on two axes: the T-45 level (horizontal axis) and the T-45→T-30 gain (vertical axis).
| T-45 at 80% or higher (peak) | T-45 at 65–79% (middle) | T-45 below 65% (trough) | |
|---|---|---|---|
| +6.0pt or more by T-30 (fast) | Ryokan 9/21 (90.1→99.6) Business 9/20 (83.2→99.8) Business 9/21 (80.1→99.7) As of 9/8: 99.6–99.8% | Business 9/19 (78.3→97.9) Business 9/22 (67.8→88.8) Gain +19.6 to +21.0pt | Business 10/6 (56.9→65.4) Gain +8.5pt (stalled at +2.0pt after T-30) |
| +3.0 to +5.9pt by T-30 (medium) | Ryokan 9/19 (83.4→97.6) Ryokan 9/20 (93.6→99.8) Business 9/26 (81.9→90.1) As of 9/8: 90.1–99.8% | Ryokan 9/22 (72.4→92.8) Ryokan 9/24 (68.3→77.5) Ryokan 9/26 (72.1→81.5) Business 9/24 (65.5→76.8) Business 10/2 (67.1→75.0) Gain +7.9 to +20.4pt | Ryokan 9/23 (63.8→72.6) Business 9/23 (62.0→70.2) Gain +8.2 to +8.8pt |
| Less than +3.0pt by T-30 (slow) | None | Ryokan 10/2 (66.0→69.8) Ryokan 10/6 (69.0→70.8) Gain +1.8 to +3.8pt | None |
Source: compiled by the HotelBank Editorial Team from MetroEngines Research
The middle column is where the story is. Nine observations that sat in the same 65–79% band at T-45 ended up in very different places depending on their gain by T-30. The two that gained +6.0pt or more (business 9/19 and 9/22) added +19.6 to +21.0pt by Sep 8, while the two that gained less than +3.0pt (ryokan 10/2 and 10/6) stopped at +1.8 to +3.8pt. Looking only at remaining inventory at T-45, the two groups are indistinguishable. The checkpoint that reveals the character of a trough-leaning date is T-30, not T-45.
The “None” cell in the bottom left is information too. All six observations at 80% or higher at T-45 gained +3.0pt or more by T-30; not one stalled at a high level. In that sense, this article’s view that a peak day’s T-45 level is close to its final shape can be restated as “dates that reach a high level keep going.” Conversely, business 10/6 in the top right is the only case that rose quickly (+6.5pt) by T-30 and then stalled, adding just +2.0pt through Sep 8 — showing that a fast start does not persist at low levels.
Against neighbouring prefectures, Mie’s peak settles earliest and its trough moves least
To separate whether Mie’s pattern is specific to the prefecture or part of a wider trend this autumn, we compared its ryokan with those in five neighbouring prefectures.
| Prefecture | 9/20 (Sun, peak) | 9/23 (Wed, Autumnal Equinox Day) | 10/2 (Fri) | ||||||
|---|---|---|---|---|---|---|---|---|---|
| T-45 | As of 9/8 | Diff. | T-45 | As of 9/8 | Diff. | T-45 | As of 9/8 | Diff. | |
| Mie | 93.6% | 99.8% | +6.2pt | 63.8% | 72.6% | +8.8pt | 66.0% | 69.8% | +3.8pt |
| Gifu | 93.7% | 99.7% | +6.0pt | 70.5% | 81.3% | +10.8pt | 76.1% | 80.9% | +4.8pt |
| Shiga | 92.8% | 99.9% | +7.1pt | 69.2% | 81.7% | +12.5pt | 72.2% | 76.3% | +4.1pt |
| Nara | 88.2% | 97.8% | +9.6pt | 57.9% | 72.0% | +14.1pt | 63.2% | 66.3% | +3.1pt |
| Wakayama | 85.7% | 99.7% | +14.0pt | 55.2% | 65.8% | +10.6pt | 61.1% | 67.0% | +5.9pt |
| Shizuoka | 82.5% | 99.5% | +17.0pt | 52.6% | 65.5% | +12.9pt | 59.1% | 67.2% | +8.1pt |
Source: compiled by the HotelBank Editorial Team from MetroEngines Research
On the peak day (9/20), Mie’s T-45 of 93.6% sits alongside Gifu’s 93.7% as the highest of the six prefectures. Its gain of +6.2pt is also the second smallest, after Gifu’s +6.0pt, meaning Mie’s peak settled earliest among the six. By contrast, Shizuoka added +17.0pt from 82.5% at T-45 and Wakayama +14.0pt from 85.7%: even among dates that ultimately fill almost completely, the point at which they settle differs by more than a month between prefectures.
On the last day of the holiday (9/23), Mie stands out in the opposite sense. Its +8.8pt gain is the smallest of the six. The sold-out property rate makes this even clearer: Mie moved only +2.1pt, from 21.9% at 45 days out to 24.0% as of Sep 8, whereas Shiga gained +15.2pt (28.3%→43.5%), Nara +9.6pt (28.8%→38.4%) and Gifu +8.2pt (34.6%→42.8%). The stall on Sep 23 is not a region-wide trend; it is especially pronounced in Mie.
For Oct 2 (Fri), however, the decline in Mie’s sold-out property rate (18.1%→16.5%) is not unique to Mie. Nara fell from 27.1% to 24.3% and Wakayama from 16.3% to 10.9%: adding listed inventory for the weekdays after the holiday is common across neighbouring prefectures. Reading this date as “only Mie is weak” would be a mistake; it should be seen as a period when demand is not moving across the region.
Differences in sold-out rate levels are explained by rooms per property
This article has set estimated occupancy alongside the sold-out property rate, but because the levels of the two differ markedly between property types, the supply-side structure needs to be taken into account. Mie Prefecture has 464 accommodation properties with 20,673 rooms in total. Of these, this article covers about 192 ryokan with about 5,000 rooms and about 90 business hotels with about 10,000 rooms. Rooms per property average about 26 for ryokan and about 110 for business hotels — a gap of more than four times.
This gap is why business hotels show a lower sold-out property rate. On Oct 6 (Tue), business hotels had estimated occupancy of 65.4% (as of 8 September 2026) but a sold-out property rate of just 3.4%: to count as “sold out,” a property averaging 110 rooms must sell every room, which is structurally harder to reach than for a ryokan averaging 26. The sold-out property rate is therefore not a metric for comparing levels across property types; it should be used to track changes over time within a single property type. Every discussion of the sold-out property rate in this article concerns the change from T-45 within the same property type.
For revenue managers running ryokan and business hotels in Mie — implications and action plan
(1) Treat T-45 as the deadline for the three peak days. For ryokan, Sep 20 was at 93.6% at 45 days out and Sep 21 at 90.1%. The remaining gains to the stay date were only +6.2pt and +9.5pt respectively. If your property did not capture its target rate on these three days, the cause most likely lay in settings made before T-45. For the next major holiday, put the decision point at T-45: check whether your booking pace has reached the market’s 90%-plus range; if it has, raise rates on the remaining inventory, and if it has not, revisit the product mix.
(2) For business hotels, the 15 days from T-45 to T-30 are decisive. Sep 20 went from 83.2% at 45 days out to 93.7% at 30 days, +10.5pt — tightening at more than twice the pace of ryokan over the same window (+4.3pt). Turn cautious on the basis of remaining inventory at T-45, and you pass through this acceleration phase at low rates. Make a habit of overlaying your own pickup pace for this window on the market’s movement.
(3) On trough dates, the data show that waiting will not fill them. For ryokan, the sold-out property rate for Oct 2 (Fri) fell from 18.1% at 45 days out to 16.5% as of Sep 8, and Oct 6 (Tue) was flat at 26.8%. Business hotels on Oct 6 (Tue) held at 3.4% across all three checkpoints. Left alone, trough dates will reach the stay date in the same shape, so rather than cutting rates and waiting, there is room to redirect effort towards measures that give guests a reason to stay (meal content, multi-night conditions, weekday-only packages with experiences, and so on).
(4) Design so that the holiday peak offsets the monthly price trough. Estimated settled ADR for Mie ryokan in September 2025 was ¥15,576 (final, N=202 properties), among the lowest levels of the year, and September 2026 sits in the same position at ¥14,570 on a current-estimate basis (N=205 properties). The market tightens to a sold-out property rate above 95% on the three peak days of the holiday, while the monthly average sits in a trough. This asymmetry suggests that treating the three peak days as the main battleground of the monthly budget is an effective design.
Mapping this onto a three-stage T-45 / T-30 / T-14 working calendar gives the table below. It is designed to be reused as-is for the next holidays (the year-end and New Year period, and next year’s major holidays). The same approach — judging the character of each stay date from these three checkpoints alone — can be applied to any holiday period.
| Timing | Action | Decision trigger (check against the figures in this article) | Aim |
|---|---|---|---|
| T-45 (Decide) | Classify each holiday date as peak / middle / trough, and freeze inventory release and product mix for peak dates | Whether your property’s pace for the same date is below or above the market’s T-45 of 93.6% for ryokan and 83.2% for business hotels (central holiday day) | Lock in irreversible settings first on dates with little upside left |
| T-45 | Prepare and launch demand-generating products for trough dates (back end of the holiday, following weekdays) | When the T-45 sold-out property rate for the date remains around 20% for ryokan and below 5% for business hotels | Use the product to add momentum before the flat curve locks in |
| T-30 (Tighten) | Shift remaining inventory on peak dates to higher room categories and multi-night conditions, and close lower-tier inventory | When the market’s T-30 has reached 97.9% for ryokan and 93.7% for business hotels (central holiday day) while your property still has single-digit-percent inventory left | Convert the last remaining inventory into a form that protects rate |
| T-30 | Business hotels: compare your own T-45→T-30 gain with the market and revisit settings for the acceleration phase | When the market moved +10.5pt over the same window but your gain falls well short of it | Avoid passing through the phase just before sell-out at low rates |
| T-14 (Open) | Open inventory to capture late demand on the holiday’s trough-leaning dates (sandwiched holidays, the last day of the holiday) | Once you can tell whether the date’s market follows the 9/22 pattern (building +20.4pt from T-45) or the 9/23 pattern (plateauing at +8.8pt) | Open inventory only on dates that are rising, and do not divert it to dates that will not grow |
| T-14 | For the Saturday after the holiday, shift the focus of sales based on demand gaps between property types | When estimated occupancy diverges between property types on the same date, as on 9/26 (Sat) with business hotels at 90.1% and ryokan at 81.5% | Capture the demand remaining right after the holiday on the side that is actually strong |
Source: compiled by the HotelBank Editorial Team from MetroEngines Research
Summary — three yardsticks for measuring a holiday
Yardstick 1: On peak days, the T-45 level is almost the final shape. For Mie ryokan, Sep 20 (Sun) was at 93.6% at 45 days out, and the gain from there was +6.2pt. The central days of the holiday were decided 45 days out. Treat T-45 not as a “preparation deadline” but as a “decision deadline.”
Yardstick 2: The timing of the rise differs by 15 days between property types. For the same Sep 20, T-45→T-30 was +4.3pt for ryokan and +10.5pt for business hotels. Ryokan tighten early; business hotels tighten around T-30. Weight the checkpoints you monitor according to your property type.
Yardstick 3: Troughs do not fill on their own. For ryokan, the sold-out property rate for Oct 2 (Fri) fell from 18.1% at 45 days out to 16.5% as of Sep 8, and business hotels on Oct 6 (Tue) stayed at 3.4% across all three checkpoints. If the curve on a trough date is flat, the state is not “not booked yet” but “no reason to book.” The decision needed is to allocate resources not to pricing but to measures that create a reason to stay.
About the data
■ Data sources
Breakdown of N: Booking curves = Mie ryokan, 172–187 properties observed (about 4,960–5,060 listed rooms); business hotels, 81–89 properties observed (about 9,700–10,080 listed rooms). Estimated settled ADR = Mie ryokan, N=196–227 properties; business hotels, N=89–97 properties (varies by month and is stated alongside each figure). All based on listings on major booking sites.
Data as of: 9 September 2026. Sales and inventory change daily, so the figures in this article are a snapshot at the time of retrieval.
■ Estimation assumptions
Definition of estimated occupancy: OTA-listed-inventory occupancy = 100 − 100 × OTA-listed rooms remaining ÷ total rooms. It is an estimate based on how inventory sold on OTAs is being absorbed, and its definition differs from actual room occupancy (it tends to run higher). This article treats it as “estimated OCC (OTA-listed inventory basis),” stating the target month and observation window.
Booking curves: Based on observations from 45 days before the stay date to the latest. The checkpoints are 45 days out (T-45), 30 days out (T-30) and the latest (observed 8 September 2026, 11–28 days before the stay date). For the Sep 22 T-30, the number of observed properties was thin, so the adjacent 31-days-out value (ryokan 78.3% / business hotels 74.6%; 183 / 88 properties observed) was used.
Sold-out property rate: The estimated share of properties with no listed inventory visible on OTAs and similar channels. It does not guarantee actual full occupancy.
Definition of estimated settled ADR: The settled price level (tax-exclusive equivalent) estimated from OTA and other sales data (lowest-plan level × segment-specific factor, ensembled across multiple channels). Past months are final values; current and future months are estimates based on current sales. Median error against published operating results: 6.6%.
■ Limitations and caveats
Estimated occupancy and the sold-out property rate are both estimates calculated from OTA-listed inventory and do not guarantee actual room occupancy or full occupancy. Because the sold-out property rate is affected by rooms per property (about 26 for ryokan and about 110 for business hotels in this article’s coverage), it is not used to compare levels across property types but is treated as a change within the same property type. The neighbouring-prefecture comparison covers ryokan only, and the number of observed properties (41–395) and the property mix differ by prefecture. For the Sep 22 T-30, the adjacent 31-days-out observation was used because the observed property count was thin, so its checkpoint conditions are not perfectly aligned with the other dates. Estimated settled ADR for September and October 2026 are current estimates and are therefore not used for year-over-year comparison with final months.
References and sources
| Source | Content |
|---|---|
| Cabinet Office, “About National Holidays” (内閣府「国民の祝日について」, Japanese) | Provisions for Respect for the Aged Day, Autumnal Equinox Day and the “Citizens’ Holiday” |
| Shukujitsu Calendar, “Silver Week 2026” (祝日カレンダー「2026年のシルバーウィーク」, Japanese) | Confirmation of the dates of the five-day holiday, 19–23 September 2026 |
| Impress Watch, “Silver Week ends; September 2026 brings the first major holiday in 11 years” (シルバーウィーク終了 26年9月は11年ぶり大型連休に, Japanese) | Confirmation that this is the first five-day holiday in 11 years |