

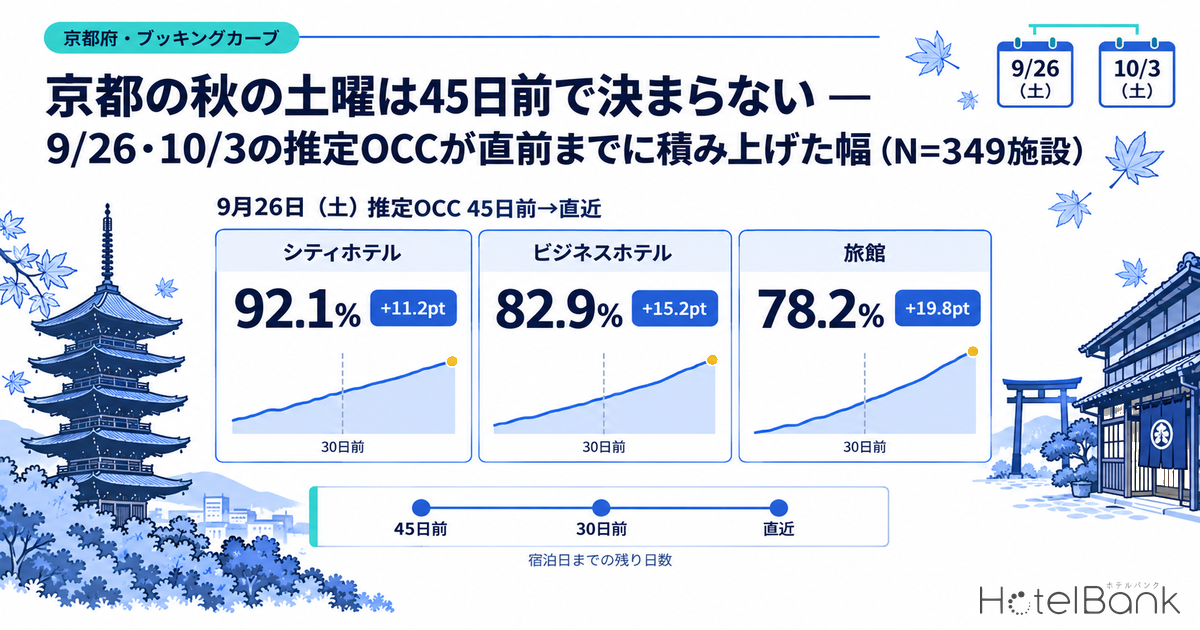
We tracked the booking curves for two autumn Saturdays in Kyoto (26 September and 3 October 2026) by property type, from 45 days before the stay date through to the most recent observation. For Saturday 26 September, city hotels climbed from an estimated OCC of 80.9% at 45 days out to 92.1% at the latest reading (14 days to go), a gain of +11.2pt; business hotels went from 67.7% to 82.9%, +15.2pt; and ryokan from 58.4% to 78.2%, +19.8pt. The starting point for this article is that if you assume the date is “largely settled by 45 days out” and skip the levers available in the final stretch, on a Kyoto Saturday you risk leaving a double-digit-point build-up on the table (for the national distribution of these gains, see Reading booking curves from actual data across all 47 prefectures).
Scope: city hotels, business hotels and ryokan in Kyoto, N=349 properties (cohort as of stay date 2026-09-26; 27,233 rooms). Occupancy in this article is an estimate based on inventory listed on OTAs and is defined differently from actual room occupancy. Price metrics are not covered here. Definitions appear at the end of the article. Data as of 13 September 2026.
• OCC (occupancy) = rooms sold as a share of total rooms in the area (an estimate based on inventory sold on OTAs).
• Estimated sold-out property rate = the share of the cohort for which no listed inventory can be confirmed.
• Price metrics (ADR and the like) are not covered in this article.
• Source: MetroEngines Research (continuous tracking of publicly listed OTA rates for roughly 168,000 properties in Japan, of which about 27,000 have confirmed occupancy data)
- — +11.2 to +19.8pt: for Saturday 26 September in Kyoto, all three property types — city, business and ryokan — added a double-digit-point gain in estimated OCC between 45 days out and 14 days to go (N=349 properties).
- — The stretch inside 30 days is the heavier one: ryokan gained +8.5pt from 45 to 30 days out and +11.3pt from 30 days out to the latest reading. Business hotels also gained more in the second half — once fewer than 30 days remain is when the real work happens.
- — Line dates up by days remaining: compared at 21 days to go, Saturday 3 October sits −6.3pt below 26 September for ryokan and −3.1pt for city hotels, but +0.8pt above for business hotels — the week-to-week gap shows up differently by property type.
- — The final stretch is when inventory disappears: for 26 September the estimated sold-out property rate stepped up from 8.3% at 30 days out to 22.2% at the latest reading for city hotels, and from 20.0% to 29.3% for ryokan.
- — The same band as Osaka and Tokyo: even in city and business hotels, where Kyoto starts from the highest level at 45 days out, the gain (+11.2pt / +15.2pt) sat in the same double-digit-point band as Osaka and Tokyo.
Saturday 26 September — all three property types kept climbing from 45 days out to the latest reading
Start with the nearer Saturday, 26 September 2026. The curves below track cohorts by property type within Kyoto from 45 days before the stay date (observed 12 August) to the latest observation (14 days to go, 12 September). The horizontal axis is days remaining until the stay date: 45 days out is on the left, and the stay date approaches as you move right.
Source: MetroEngines Research; compiled by the HotelBank Editorial Team
All three lines rise steadily, with no flat stretch along the way. Ryokan in particular (N=116 properties, 2,182 rooms) start from the lowest of the three at 58.4% at 45 days out and add 19.8pt to reach 78.2% at the latest reading. City hotels (N=36 properties, 5,050 rooms) were already high at 80.9% at 45 days out, yet still added a further 11.2pt to reach 92.1%. Business hotels (N=197 properties, 20,001 rooms) went from 67.7% to 82.9%, +15.2pt. The higher the starting point, the smaller the gain — but a double-digit-point build-up still lands in the final stretch regardless.
Splitting the curve at the 30-days-out mark reveals differences in character. City hotels added +6.5pt from 45 to 30 days out and +4.7pt from 30 days out to the latest reading — slightly front-loaded. Ryokan, by contrast, added +8.5pt then +11.3pt, weighted to the back half, and business hotels likewise gained more late (+7.1pt then +8.1pt). On a Kyoto Saturday, the stretch after fewer than 30 days remain is still where the real work happens. A three-checkpoint routine — 45 days out, 30 days out and the final stretch — is a practical way to classify what kind of date you are looking at.
Saturday 3 October — a week later, the same Saturday looks different once you compare at equal days remaining
The following Saturday, 3 October, gets the same treatment. Here the latest observation is at 21 days to go (12 September), so the curve runs from 45 days out to 21 days out.
Source: MetroEngines Research; compiled by the HotelBank Editorial Team
When two dates sit at different points in the calendar, the basic rule is to compare them at the same number of days remaining rather than by observation date. Lined up at 21 days to go, city hotels stand at 91.0% for 26 September against 87.9% for 3 October (−3.1pt), and ryokan at 74.4% against 68.1% (−6.3pt) — 3 October is behind on both. Business hotels, on the other hand, are effectively level at 79.9% against 80.7% (+0.8pt). Even between two “autumn Saturdays in Kyoto,” the week-to-week gap looks completely different depending on property type.
Rooms still available for 3 October at the latest observation: 612 in city hotels, 3,871 in business hotels and 670 in ryokan. For 26 September at its latest reading (14 days to go), the equivalent figures were 397, 3,423 and 476.
| Stay date / property type | 45 days out | 30 days out | Latest observation | 45 days out → latest | N (properties) |
|---|---|---|---|---|---|
| Sat 26 Sep — City hotels | 80.9% | 87.4% | 92.1% | +11.2pt | 36 |
| Sat 26 Sep — Business hotels | 67.7% | 74.8% | 82.9% | +15.2pt | 197 |
| Sat 26 Sep — Ryokan | 58.4% | 66.9% | 78.2% | +19.8pt | 116 |
| Sat 3 Oct — City hotels | 79.9% | 85.5% | 87.9% | +8.0pt | 36 |
| Sat 3 Oct — Business hotels | 70.3% | 76.3% | 80.7% | +10.4pt | 198 |
| Sat 3 Oct — Ryokan | 56.2% | 63.1% | 68.1% | +11.9pt | 115 |
The latest observation is 14 days to go for Sat 26 Sep and 21 days to go for Sat 3 Oct (both observed 12 September 2026). Source: MetroEngines Research; compiled by the HotelBank Editorial Team
What moves in the final stretch is the rising count of properties with no confirmable listed inventory
It is worth looking at what sits behind that climb in estimated OCC from another angle. The chart below plots, for Saturday 26 September, the share of the cohort for which no listed inventory can be confirmed (the estimated sold-out property rate) against days remaining.
Source: MetroEngines Research; compiled by the HotelBank Editorial Team
City hotels were essentially flat at 8.3% at 45 days out and still 8.3% at 30 days out, then stepped up from around 25 days to go, reaching 22.2% at the latest reading. Business hotels ran 8.1% → 8.2% → 14.2% and ryokan 18.1% → 20.0% → 29.3%; in every case the level shifts once fewer than 30 days remain. Comparing the two dates at 21 days to go, 26 September stands at 22.2% for city, 11.2% for business and 25.0% for ryokan, against 13.9%, 19.7% and 19.1% for 3 October. For city hotels and ryokan, more properties still hold inventory for 3 October; business hotels alone run the other way, clearing out earlier for 3 October.
What this suggests is that the final stretch on a Kyoto Saturday is not a period in which the remaining properties keep selling thinly, but one in which properties sell out and drop out of the pool one after another. As inventory disappears from the cohort, demand concentrates on whatever is left. Against that structure, how your own property presents its inventory in the final stretch carries real weight. Estimated OCC and the sold-out property rate answer different questions and are worth reading separately.
Set against Osaka and Tokyo — Kyoto adds the same gain from a higher starting point
To check whether Kyoto’s gain is specific to Kyoto, we lined up the equivalent property-type cohorts in Osaka and Tokyo for the same Saturday, 26 September, on the same observation dates (45 days out = 12 August; 14 days to go = 12 September).
| Property type / prefecture | 45 days out | 14 days to go | Gain | N (properties) |
|---|---|---|---|---|
| City hotels — Kyoto | 80.9% | 92.1% | +11.2pt | 36 |
| City hotels — Osaka | 71.1% | 83.5% | +12.4pt | 35 |
| City hotels — Tokyo | 75.5% | 90.1% | +14.6pt | 54 |
| Business hotels — Kyoto | 67.7% | 82.9% | +15.2pt | 197 |
| Business hotels — Osaka | 54.5% | 70.0% | +15.5pt | 297 |
| Business hotels — Tokyo | 55.6% | 74.5% | +18.9pt | 549 |
| Ryokan — Kyoto | 58.4% | 78.2% | +19.8pt | 116 |
| Ryokan — Osaka | 61.3% | 71.0% | +9.7pt | 22 |
| Ryokan — Tokyo | 76.4% | 89.9% | +13.5pt | 27 |
The ryokan cohorts in Osaka and Tokyo are small (N=22 and N=27 properties), so those figures are indicative only. Source: MetroEngines Research; compiled by the HotelBank Editorial Team
For city hotels, Kyoto’s +11.2pt compares with +12.4pt in Osaka and +14.6pt in Tokyo; for business hotels, Kyoto’s +15.2pt compares with +15.5pt and +18.9pt. Kyoto starts from the highest level of the three in both of these types at 45 days out (80.9% for city, 67.7% for business), yet its gain still falls within the same double-digit-point band as Osaka and Tokyo. For 26 September across these three prefectures, you cannot say that a date starting high at 45 days out has less room left to run. Kyoto is also highest at 14 days to go, at 92.1% for city and 82.9% for business — the gap in starting points carries straight through to where the date lands.
Among ryokan, Kyoto’s +19.8pt is the largest, but the comparison cohorts are too small to read a property-type difference from. If you are going to benchmark your own property against figures from another city, align on the same stay date and the same days remaining, and compare the size of the gain rather than the level — that is less distorted by differences in property type and location.
Kyoto’s day-of-week shape, seen through a completed month
For context, it helps to establish where Saturday sits among the days of the week in Kyoto, using daily figures from the most recent completed month (August 2026). Estimated OCC averaged by day of week is shown below (monthly averages: 82.7% for city, 81.6% for business, 82.5% for ryokan).
| Property type | Mon | Tue | Wed | Thu | Fri | Sat | Sun |
|---|---|---|---|---|---|---|---|
| City hotels | 80.3% | 82.3% | 82.7% | 84.8% | 82.7% | 84.8% | 81.3% |
| Business hotels | 77.5% | 81.5% | 82.7% | 85.3% | 82.9% | 85.2% | 77.3% |
| Ryokan | 80.7% | 81.8% | 81.0% | 81.5% | 83.2% | 86.0% | 82.8% |
Month covered: August 2026, Kyoto (city N=32–36 properties; business N=185–194; ryokan N=88–111). Source: MetroEngines Research; compiled by the HotelBank Editorial Team
In all three property types, Saturday is either the highest day or level with it. For ryokan the gap between Saturday at 86.0% and Monday at 80.7% is 5.3pt; for business hotels the gap between Saturday at 85.2% and Sunday at 77.3% is 7.9pt — the distance between the weekly peak and trough varies by roughly 1.5x across property types. Note that Thursday also ran high in August (84.8% for city, 85.3% for business), so holiday-period demand specific to that month is sitting in the day-of-week averages and should be discounted accordingly.
For revenue managers running hotels and ryokan in Kyoto — implications and an action plan
1. On autumn Saturdays in Kyoto, the assumption that the date is “largely settled at 45 days out” is worth revisiting. Between 45 days out and the latest reading, Saturday 26 September added +11.2pt for city, +15.2pt for business and +19.8pt for ryokan. When overlaying your own booking pace on the market curve, estimating where the date will land from the 45-day figure alone tends to write off the portion the market adds later. Set your pace out at three points — 45 days out, 30 days out and the latest reading — and compare how many points were added in each interval between your property and the market.
2. How heavy the back half is depends on property type. City hotels added +6.5pt from 45 to 30 days out and +4.7pt from 30 days out to the latest reading — front-loaded. Ryokan added +8.5pt then +11.3pt — back-loaded. If you run a ryokan or Japanese-style inn, a low pace at the point where fewer than 30 days remain may well be within the normal shape of the market. Conversely, if a city hotel has not reached market pace by 30 days out, that is grounds to review how the first half is being sold.
3. Even among “autumn Saturdays,” each week has its own face. Aligned at 21 days to go, ryokan stand at 74.4% for 26 September against 68.1% for 3 October (−6.3pt), city hotels at 91.0% against 87.9% (−3.1pt), and business hotels at 79.9% against 80.7% (+0.8pt). Simply switching from bundling dates by whether they are a weekend to comparing them one date at a time at equal days remaining changes how you set priorities.
4. The main event in the final stretch is inventory dropping out. For 26 September the estimated sold-out property rate stepped up from 8.3% at 30 days out to 22.2% for city hotels, and from 20.0% to 29.3% for ryokan. Whether you alone are holding thick inventory while everyone around you sells out — or conversely have closed out too early — is a question worth checking once, without fail, at the point where fewer than 30 days remain.
| Time frame | Action | Decision trigger (tied to the figures in this article) | Purpose |
|---|---|---|---|
| Today to this week | Check your own pace for Sat 3 Oct on a 21-days-to-go basis | If your figure for the relevant property type sits well below the market at 21 days to go (city 87.9%, business 80.7%, ryokan 68.1%) | Establish early whether there is room to add over the final three weeks |
| Today to this week | Review how inventory is opened up (length-of-stay conditions, which room types are exposed) for single-night Saturday stays | If the latest sold-out property rate is climbing beyond the property-type average (city 22.2%, business 14.2%, ryokan 29.3%) | Avoid closing out room nights you could still pick up in a market where inventory has drained |
| Within two weeks | Log the 45-day and 30-day checkpoints in advance for Saturdays from mid-October onward | If your property keeps no record of its pace at 45 and 30 days out | Get to a state where you can run the same comparison immediately for the next set of Saturdays |
| Within two weeks | Check whether your day-of-week targets are set flat from Monday through Sunday | If the completed month shows a 5.3–7.9pt gap between Saturday and the weakest day depending on property type, yet your targets are uniform across days | Shift inventory allocation toward the weekly peaks and troughs |
| Looking to next month | Adopt “45 days out, 30 days out, final stretch” as the standing frame for internal reviews | If your reviews currently run on the monthly landing forecast alone | Separate out how well each action worked by looking at the gain in each interval |
| Looking to next month | Drop nearby properties of a different type from your benchmark set, or view them separately | Given that the gap between property types at the same days remaining exceeds 20pt at its widest (at 45 days out for 26 Sep: city 80.9%, ryokan 58.4%) | Avoid an overstated or understated sense of alarm caused by a mismatched comparison set |
Source: MetroEngines Research; compiled by the HotelBank Editorial Team
In summary — three yardsticks to take away
1. Line the date up at three points: 45 days out, 30 days out and the latest reading. Look at how many points were added in each interval rather than at the absolute pace. On Kyoto’s autumn Saturdays, the gain from 45 days out to the latest reading ran +8.0 to +11.2pt for city, +10.4 to +15.2pt for business and +11.9 to +19.8pt for ryokan.
2. Compare dates at equal days remaining. Line them up by observation date and the difference in calendar position simply becomes the ranking. Compared at 21 days to go, the gap between 26 September and 3 October for ryokan was 6.3pt.
3. Treat the final stretch as the period when inventory drains away. The share of properties with no confirmable listed inventory stepped up inside 30 days across every property type. Judge how you open up your own inventory against that structure.
About the data
• Definition of estimated OCC (based on OTA-listed inventory): OTA-listed-inventory occupancy = 100 − 100 × rooms still listed on OTAs ÷ total rooms. The scope is a fixed cohort of properties that list at least 30% of their total rooms on OTAs (the same set of properties for each stay date; property counts are given as N= throughout this article). It is an estimate based on how listed inventory is being sold down on OTAs, and is defined differently from actual room occupancy (it reads high because rooms never listed are counted on the sold side).
• Booking curves: based on observations from 45 days before the stay date through to the latest reading.
• The sold-out property rate refers to the estimated share of properties for which no listed inventory can be confirmed on OTAs or elsewhere.
• Scope and breakdown: Kyoto, stay date Saturday 26 September 2026 = city hotels N=36 properties / 5,050 rooms; business hotels N=197 / 20,001 rooms; ryokan N=116 / 2,182 rooms. Stay date Saturday 3 October 2026 = city hotels N=36 / 5,050 rooms; business hotels N=198 / 20,011 rooms; ryokan N=115 / 2,102 rooms (all based on listings on major booking sites). The resort hotel segment in Kyoto was excluded because no valid cohort formed for these stay dates. Day-of-week aggregates cover August 2026 (city N=32–36 properties; business N=185–194; ryokan N=88–111). Observation coverage ran between 99.1% and 100% at each point.
• Prefecture comparison (Table 2): equivalent property-type cohorts for the stay date of Saturday 26 September 2026. Osaka = city hotels N=35 properties / 8,016 rooms; business hotels N=297 / 48,805 rooms; ryokan N=22 / 435 rooms. Tokyo = city hotels N=54 / 17,294 rooms; business hotels N=549 / 79,178 rooms; ryokan N=27 / 681 rooms. Definitions and observation dates are identical to Kyoto, with observation coverage between 95.5% and 100%.
• Price metrics are not covered in this article, nor is any year-on-year comparison of occupancy.
• Data as of 13 September 2026. Sales and inventory shift daily, so the figures here are a snapshot as at the time of retrieval.
Related reading
- Reading booking curves from actual data across all 47 prefectures — the median gain from 45 days out is +4.1pt, and negatives turn out to be added inventory
- Are Saturdays in Tottori decided in the final two weeks? — a checkpoint analysis of booking curves from after Obon through early September (N=190 properties)
- How many nights does an autumn festival fill? — one night in Kawagoe, one in Kyoto, seven in Saga: an inventory comparison for October 2026