

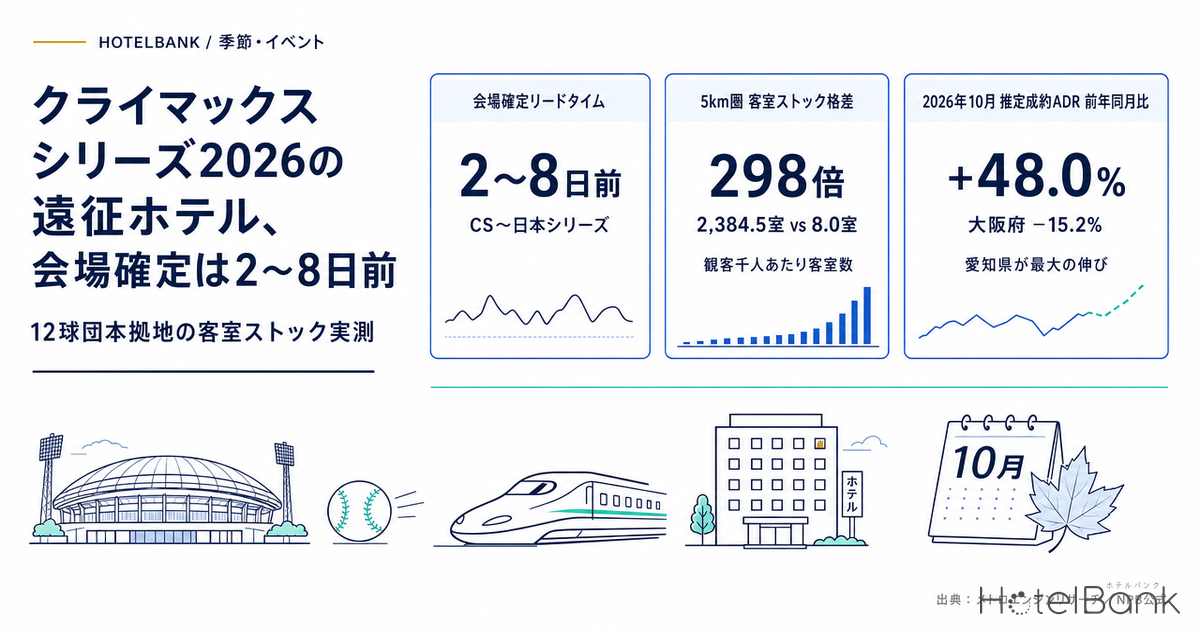
Professional baseball’s postseason is a somewhat unusual kind of demand for hotels. NPB publishes the schedule the previous autumn, and the dates are fixed: the 2026 Climax Series (CS) opens on October 10 and the SMBC Japan Series 2026 opens on October 24. Yet which city hosts the games is not settled until just days before first pitch, because home-field rights are tied to final regular-season standings. The dates are known but the venues are not. We measured what this asymmetry means for inventory and pricing design across the 12 home-ballpark markets on three layers: room stock, booking pace, and forward pricing.
Metric Definitions Used in This Article
- ADR (Average Daily Rate) = an estimated settled rate (tax-excluded equivalent), calculated by applying category-specific adjustment factors to the lowest-plan level each property publishes on OTAs and other channels (per room, 2 guests, tax included). Checked against property-level actuals disclosed by listed hotel REITs (91 properties, most recent 3 months), the median error is about 7%. These are estimates and differ from each property’s actual transaction prices and accounting figures. Area-level ADR is the median of the covered properties (the level of a typical property in the area).
- OCC (Occupancy) = rooms sold as a share of total rooms in the area (an estimate based on OTA sales inventory). Because it is based on how inventory sold on OTAs is absorbed, it differs from the actual occupancy of a property as a whole. Used only at the prefecture level; occupancy is not calculated for individual properties.
- LT (Lead Time) = days until check-in. LT0 = same day.
- Where listed prices are mentioned, they refer to the per-room rate for 2 guests (tax included), averaged across all plans.
- Data sources: MetroEngines Research / Nippon Professional Baseball (NPB) official announcements
- — Venues become known only 2–8 days out. About 2 days ahead for the CS First Stage, about 6 days for the Final Stage, and 5–8 days for Japan Series Game 1. The dates themselves have already been published by NPB and are fixed.
- — A 298x gap in rooms within 5km. Rooms per 1,000 spectators range from 2,384.5 at Meiji Jingu Stadium to 8.0 at Belluna Dome. The thinner the stock near the ballpark, the scarcer a “room you can walk back to” becomes.
- — Most cities filling up now are filling for non-baseball reasons. Kanagawa on 10/10 is a three-day weekend, Osaka on 10/31 is Halloween, and Aichi has the Asian Para Games. Saitama and Hokkaido are candidate venues but have not moved yet.
- — 30–50% of inventory absorption happens in the final 14 days, and venue-confirmation lead times fall inside that window. But listed prices are designed to fall 8–24% from LT90 to LT1, so a price floor needs to be in place before the venue is confirmed.
Dates Fixed, Venues Not — Counting the 2026 “Venue-Confirmation Lead Time”
Start with NPB’s official schedule. The 2026 JERA Climax Series Central and the 2026 Persol Climax Series Pacific share the same schedule: the First Stage is a best-of-three from Saturday, October 10 to Monday, October 12, with Tuesday the 13th as a reserve day. The Final Stage runs up to six games from Wednesday, October 14 to Monday, October 19, with reserve days on Tuesday the 20th and Wednesday the 21st. The SMBC Japan Series 2026 opens on Saturday, October 24, and if it goes to Game 7 it ends on Sunday, November 1.
The venue rules work like this. All First Stage games are played at the home ballpark of the second-place team. The Final Stage is hosted by the first-place team. For the 2026 Japan Series, Games 1–2 (10/24, 10/25) and Games 6–7 (10/31, 11/1) are played at the home ballpark of the Central League representative, and Games 3–5 (10/27–29) at the home of the Pacific League representative. NPB also announced a revision to the Final Stage rules on August 24, 2026: if the first-place team finishes 10 or more games ahead of the First Stage winner, or the First Stage winner has a winning percentage below .500, a two-win advantage and a maximum of seven games (first to five wins) apply.
From this we can work back to the lead time at which each venue is confirmed. Under the league agreement, CS participants are determined by “the standings at the end of the schedule incorporated up to two days before the scheduled CS opening date.” With the opener on October 10, standings are settled around October 8. That means the First Stage venue becomes known about 2 days before play, and the Final Stage venue (the first-place team’s home) about 6 days before. The Japan Series is more complicated: the participants are decided when each league’s Final Stage ends (October 16 at the earliest, October 19 at the latest), so the Game 1 venue becomes known 5–8 days out. For Games 6 and 7, the venue is known 12 days ahead, but whether the games will be played at all is not settled until two days to one day before.
| Series / stage | Dates (NPB official) | Home-field rights | When the venue is known | Confirmation LT |
|---|---|---|---|---|
| CS First Stage | 10/10 (Sat)–10/12 (Mon) / reserve day 10/13 | Home of 2nd-place team (all games) | Around 10/8 (set by standings 2 days before the opener) | ~2 days out |
| CS Final Stage | 10/14 (Wed)–10/19 (Mon) / reserve days 10/20, 10/21 | Home of 1st-place team | Around 10/8 (opponent set when the First Stage ends) | ~6 days out |
| Japan Series Games 1–2 | 10/24 (Sat), 10/25 (Sun) | Home of Central League representative | End of Central League CS Final (10/16–19) | 5–8 days out |
| Japan Series Games 3–5 | 10/27 (Tue)–10/29 (Thu) | Home of Pacific League representative | End of Pacific League CS Final (10/16–19) | 8–13 days out |
| Japan Series Games 6–7 | 10/31 (Sat), 11/1 (Sun) | Home of Central League representative | Venue around 10/19 / whether played: 10/29–31 | Venue 12 days out; whether played 1–3 days out |
Source: Compiled by HotelBank Editorial Team from NPB “2026 Climax Series Schedule,” “Japan Series 2026,” and “Notice on the 2026 Central/Pacific Climax Series (August 24, 2026)”
For reference, in the standings NPB published as of the end of play on September 3, 2026, the top three in the Central League were the Hanshin Tigers (.580), Yomiuri Giants (.538, 5.0 games back), and Yokohama DeNA BayStars (.470, 13.0 games back). In the Pacific League, the Fukuoka SoftBank Hawks (.624), Saitama Seibu Lions (.580, 5.0 games back), and Hokkaido Nippon-Ham Fighters (.562, 7.0 games back) led. Each team still had around 20 games left, so the venue cannot be narrowed down to one at this point. From the hotel side, there are at least six candidate home-ballpark markets, all of them in a state of “might host, might not.”
Capacity Around the 12 Home Ballparks — a 298x Gap in Rooms per 1,000 Spectators
How much lodging capacity each candidate market has differs enormously. We counted rooms at operating lodging facilities within radii of 2km, 5km, 10km, and 20km of each of the 12 teams’ home ballparks. For the denominator we used not each ballpark’s official capacity but NPB’s average attendance per home game as of the end of the first half of the 2026 season (as of July 26). Official capacity varies by definition between concert and baseball configurations, whereas average attendance reflects the number of people actually coming to that city, making it a more realistic denominator for lodging demand.
Source: Compiled by HotelBank Editorial Team from MetroEngines Research and NPB “2026 Attendance by Team (end of first half, as of July 26)” (N=12 ballparks; operating facilities only)
| Home ballpark | Location | Avg. attendance per game |
Rooms within 2km | Rooms within 5km |
Rooms within 20km |
5km rooms per 1,000 | 20km rooms per 1,000 |
|---|---|---|---|---|---|---|---|
| Meiji Jingu Stadium (明治神宮野球場) | Tokyo | 27,973 | 8,932 | 66,701 | 172,146 | 2,384.5 | 6,154.0 |
| Tokyo Dome (東京ドーム) | Tokyo | 38,886 | 10,297 | 90,117 | 169,266 | 2,317.5 | 4,352.9 |
| Kyocera Dome Osaka (京セラドーム大阪) | Osaka | 29,884 | 4,303 | 64,567 | 91,666 | 2,160.6 | 3,067.4 |
| Rakuten Mobile Saikyo Park Miyagi (楽天モバイル 最強パーク宮城) | Miyagi | 24,017 | 4,052 | 12,661 | 17,750 | 527.2 | 739.1 |
| MAZDA Zoom-Zoom Stadium Hiroshima (MAZDA Zoom-Zoom スタジアム広島) | Hiroshima | 26,809 | 8,042 | 13,702 | 16,604 | 511.1 | 619.3 |
| Mizuho PayPay Dome Fukuoka (みずほPayPayドーム福岡) | Fukuoka | 38,736 | 1,833 | 16,980 | 32,616 | 438.4 | 842.0 |
| Yokohama Stadium (横浜スタジアム) | Kanagawa | 32,423 | 10,690 | 12,703 | 37,352 | 391.8 | 1,152.0 |
| Vantelin Dome Nagoya (バンテリンドーム ナゴヤ) | Aichi | 35,271 | 142 | 12,230 | 32,596 | 346.7 | 924.2 |
| ZOZO Marine Stadium (ZOZOマリンスタジアム) | Chiba | 26,646 | 3,280 | 3,819 | 29,445 | 143.3 | 1,105.0 |
| Hanshin Koshien Stadium (阪神甲子園球場) | Hyogo | 41,947 | 531 | 1,168 | 102,334 | 27.8 | 2,439.6 |
| ES CON FIELD HOKKAIDO (エスコンフィールドHOKKAIDO) | Hokkaido | 30,718 | 0 | 272 | 27,187 | 8.9 | 885.1 |
| Belluna Dome (ベルーナドーム) | Saitama | 24,640 | 79 | 198 | 11,169 | 8.0 | 453.3 |
Source: Compiled by HotelBank Editorial Team from MetroEngines Research (operating facilities, based on registered room counts) and NPB “2026 Attendance by Team”
Within 5km, the deepest stock is around Meiji Jingu Stadium at 2,384.5 rooms per 1,000 spectators, followed by Tokyo Dome at 2,317.5 and Kyocera Dome Osaka at 2,160.6. The thinnest are Belluna Dome at 8.0, ES CON FIELD HOKKAIDO at 8.9, and Hanshin Koshien Stadium at 27.8. The gap between top and bottom reaches 298x. Even among “cities with a home ballpark,” the number of rooms within walking distance differs by two or three orders of magnitude.
That said, reading these numbers simply as thin supply would be inaccurate. NPB home ballparks sit on rail networks, and demand is distributed along travel time rather than in concentric circles. Widen the radius to 20km and the picture flips. Hanshin Koshien Stadium goes from 27.8 rooms within 5km to 2,439.6 within 20km (taking in central Osaka and Kobe). ES CON FIELD HOKKAIDO goes from 8.9 to 885.1 (central Sapporo). Belluna Dome goes from 8.0 to 453.3 (toward Tokorozawa, Kawagoe, and Ikebukuro). Vantelin Dome Nagoya has only 142 rooms within 2km, but 12,230 rooms of central Nagoya lie within 5km.
The practical implication points the other way. In markets where inventory near the ballpark numbers only in the hundreds of rooms, rooms with the irreplaceable value of “walking back after the game” are structurally scarce. In markets like Tokorozawa, Kitahiroshima, and Nishinomiya, where nearby stock stays in the hundreds of rooms, that scarcity passes through to price more easily. By contrast, in markets like Tokyo Dome and Kyocera Dome Osaka, with tens of thousands of rooms across the wider area, what matters is not price but deciding which segments to go after. We used the same approach of drawing radii around a venue and counting nearby inventory in our analysis comparing hotel supply around six exhibition venues, where the wide gap in 5km stock between venues closely resembles the pattern around NPB home ballparks.
Source: MetroEngines Research / circle size = rooms within 5km
Booking Pace as of September 2 — Markets “Not Yet Moving” and Markets “Moving for Other Reasons”
Next, we looked at the current booking pace for the expected CS dates (10/10–19) and Japan Series dates (10/24–11/1). We used each prefecture’s booking curve, with the latest observation as of September 2, 2026. Simply lining up absolute occupancy levels invites misreading because of day-of-week and seasonal effects, so the metric here is the difference versus normal days at the same LT and on the same day of the week. The baseline is the median of three same-weekday dates before the opening of the Asian Games on September 19 (Saturdays: 8/29, 9/5, 9/12; Mondays: 8/31, 9/7, 9/14; Wednesdays: 9/2, 9/9, 9/16).
| Prefecture | 10/10 (Sat) First Stage Day 1 | 10/12 (Mon) Sports Day |
10/14 (Wed) Final Day 1 | 10/17 (Sat) Final |
10/24 (Sat) Japan Series G1 | 10/28 (Wed) Japan Series G4 |
10/31 (Sat) Japan Series G6 |
|---|---|---|---|---|---|---|---|
| Tokyo | 83.1% +7.9pt | 75.7% +8.1pt | 76.7% +7.2pt | 79.8% +6.9pt | 79.5% +8.3pt | 75.9% +9.7pt | 75.1% +5.6pt |
| Kanagawa | 90.7% +17.8pt | 70.3% +8.6pt | 67.9% +2.7pt | 76.2% +5.5pt | 80.9% +12.0pt | 66.5% +3.7pt | 72.3% +4.6pt |
| Hyogo | 80.1% +1.5pt | 67.7% +0.2pt | 72.1% +2.2pt | 78.7% +1.5pt | 82.2% +5.8pt | 75.1% +6.6pt | 78.3% +3.4pt |
| Osaka | 77.0% +7.6pt | 68.1% +5.7pt | 71.0% +6.3pt | 77.2% +8.8pt | 79.7% +12.4pt | 69.2% +6.2pt | 87.6% +20.9pt |
| Fukuoka | 84.5% +5.9pt | 70.7% +1.6pt | 73.3% +5.0pt | 81.5% +3.9pt | 89.9% +13.9pt | 72.0% +5.7pt | 79.2% +4.4pt |
| Saitama | 84.7% +7.2pt | 67.4% -0.7pt | 70.3% +0.6pt | 77.4% +0.4pt | 80.4% +4.6pt | 69.3% +1.1pt | 77.3% +2.6pt |
| Hokkaido | 84.7% +0.0pt | 70.2% -5.7pt | 73.5% -7.3pt | 80.2% -3.2pt | 82.1% +0.2pt | 68.4% -9.1pt | 81.8% +1.2pt |
| Aichi | 81.5% +4.2pt | 70.6% +2.5pt | 75.5% +5.1pt | 83.2% +7.1pt | 80.5% +4.9pt | 67.6% -1.2pt | 75.1% +0.4pt |
Top = estimated occupancy (based on OTA sales inventory); bottom = difference vs. the median of normal days at the same LT and weekday (N=3 days). Observed September 2, 2026.
Source: MetroEngines Research; compiled by HotelBank Editorial Team
Source: MetroEngines Research; compiled by HotelBank Editorial Team (observed September 2, 2026; baseline = three Saturdays)
The furthest along is Kanagawa on Saturday, October 10, at an estimated occupancy of 90.7% (observed September 2, 2026), 17.8 points above normal Saturdays at the same LT (72.9%). Remaining inventory is 4,474 rooms out of 48,345. But it is too early to read this as postseason demand. October 10–12 is a three-day weekend, with Monday, October 12 being Sports Day, and at this point not even the CS participants have been decided. The holiday-weekend effect and the baseball effect cannot be separated in the current observations.
Another standout is Fukuoka on Saturday, October 24, at an estimated occupancy of 89.9% (observed September 2, 2026; +13.9 points vs. normal), with 5,490 rooms remaining out of 54,290 and listed prices +40.6% vs. normal. However, October 24 is scheduled as a Japan Series game at the Central League representative’s home ballpark, so Fukuoka cannot host that day. Similarly, Osaka on Saturday, October 31 stands out at an estimated occupancy of 87.6% (observed September 2, 2026; +20.9 points), with listed prices +81.9% vs. normal, but this is driven mainly by a different factor: Halloween weekend. In other words, most of the cities already filling up are filling for reasons other than baseball.
In contrast, Saitama is nearly flat at +0.6 points on Wednesday, October 14 and +0.4 points on Saturday, October 17. Hokkaido is below its baseline at −7.3 points on Wednesday, October 14 and −9.1 points on Wednesday, October 28. For Hokkaido, the comparison sets normal days from late August to mid-September against late October, so the difference includes some seasonal softening and should be discounted accordingly. Either way, these two prefectures are candidate postseason venues whose inventory for those dates has barely moved. They are exactly the markets where waiting until the venue is confirmed to start planning will be too late.
*These differences are aligned on the same LT and weekday, but because the baseline is late August to mid-September, they include seasonal variation in demand. They do not isolate the event effect alone.
Treat the Nagoya Area Separately — Overlap with the Asian Para Games
Aichi alone carries a major demand driver independent of the postseason. The 20th Asian Games (Aichi-Nagoya 2026) run from September 19 to October 4, 2026, and the 5th Asian Para Games from October 18 (opening ceremony) to October 24 (closing ceremony), with some events starting on October 16. The Asian Para Games period therefore overlaps directly with the second half of the CS Final Stage (10/14–19) and with Japan Series Game 1 (10/24).
The measurements confirm that October in Aichi is clearly strong. Estimated occupancy on Saturday, October 17 is 83.2% (+7.1 points vs. normal days at the same LT and weekday), and 75.5% on Wednesday, October 14 (+5.1 points). As discussed below, Aichi’s estimated settled ADR for October 2026 is up 48.0% year over year, the largest increase among the 11 prefectures examined.
The key point is that the Chunichi Dragons were sixth in the Central League as of the end of play on September 3, 2026, so Vantelin Dome Nagoya is not in a position to host the CS. Inventory in the Nagoya area is moving for non-baseball reasons. Even so, from a traveling fan’s perspective, Nagoya is a relay point on the Shinkansen network and a likely choice as a lodging base. Hotels need to factor in the sequence in which inventory in Nagoya, the transit point, thins out before inventory in the ballpark cities does. For hotels in candidate markets in Kansai and Kanto as well, this can be read as a period when demand is unlikely to spill over to Nagoya.
Forward Pricing — October Estimated Settled ADR: Aichi +48.0%, Osaka Alone at −15.2%
Next, the price layer. We compared each prefecture’s estimated settled ADR for October 2026 with the October 2025 actual. October 2025 is a finalized actual; October 2026 is an estimate based on current listed levels.
Source: MetroEngines Research; compiled by HotelBank Editorial Team (N=279–1,103 properties per prefecture; October 2026 is an estimate based on listed levels at the time of research)
Ten of the 11 prefectures are above the same month last year. Aichi leads at +48.0% (¥8,700→¥12,900), followed by Hiroshima at +36.0%, Miyagi +32.1%, Saitama +29.0%, Hokkaido +28.8%, Chiba +26.3%, and Fukuoka +25.7%. Tokyo is +19.5% (¥15,600→¥18,700), Kanagawa +13.0%, and Hyogo +9.6%.
The only decline is Osaka at −15.2% (¥13,400→¥11,400), but this is a reaction to October 2025 falling in the final stretch of Expo 2025 Osaka, Kansai (which closed on October 13, 2025), when rates ran well above typical years. It reflects a high prior-year level and does not mean that October 2026 demand itself is retreating. In fact, as shown above, Osaka on Saturday, October 31 has already reached an estimated occupancy of 87.6% (same basis).
What deserves attention is that the markets growing fastest right now are those with thin room stock near the ballpark: Saitama +29.0%, Hokkaido +28.8%, Miyagi +32.1%, and Hiroshima +36.0%. The markets identified in the previous section as having few rooms per 1,000 spectators line up among the top ADR gainers. Scarcity is already starting to show up in price.
Venues Set 2–8 Days Out, 30–50% of Inventory Absorbed in the Final 14 Days — the Structures Mesh
Let us bring the evidence together into a single question: can the market physically absorb demand whose venue is decided only 2–8 days in advance? To answer it, we measured where in the lead-time window inventory is absorbed during normal periods. For check-in dates in July and August 2026, we broke absorption into three bands: LT90–46, LT45–15, and LT14–0.
Source: MetroEngines Research; compiled by HotelBank Editorial Team (monthly average curves for July and August 2026 check-in dates; averages of all 31 days in each month)
The results split clearly by market. Absorption is concentrated in the final 14 days (LT14–0) in Saitama at 48.5%, Hyogo 45.8%, Osaka 45.7%, Aichi 43.9%, and Kanagawa 41.4%. Conversely, rooms are booked earlier in Hokkaido at 27.6%, Fukuoka 32.8%, and Tokyo 34.4%. Even in normal periods, many markets process around 40% of inventory absorption in the last two weeks.
This is good news. The venue-confirmation lead times (about 2 days for the CS First Stage, about 6 days for the Final Stage, and 5–13 days for the Japan Series) fall neatly within this thick final-14-day band. Structurally, the market has room to absorb demand that moves after confirmation. Particularly in markets such as Saitama and Hyogo, where the last-minute absorption share exceeds 45%, there is a track record of clearing inventory on normal demand alone even with more than 40% of rooms still unsold at LT15. If a market does land the postseason, that demand stacks on top.
However, current pricing design points the opposite way. In the same July–August measurements, listed prices (all-plan average, tax included) fell from LT90 to LT1 in every market: Hyogo −23.7%, Kanagawa −17.9%, Osaka −17.9%, Saitama −17.5%, Fukuoka −16.6%, Aichi −13.4%, Tokyo −8.3%, and Hokkaido −8.2%. In other words, the last-minute window is designed to “take volume by lowering rates”. Postseason demand, with its venue confirmed at the last minute, collides head-on with this standard design, because a markdown schedule is already set for the very window in which rooms would sell at the highest price if the market wins a venue. A separate HotelBank analysis of last-minute markdowns in the final two weeks (1,161 properties, 2,904 cases) found that the dividing line between markdowns that work and those that merely cut rates is an absorption rate below 70%.
Two Scenarios to Set Before Confirmation — Branching Inventory, Pricing, Cancellation, and Length-of-Stay Design
If you wait until the venue is confirmed, there is no time left to rework the design of the final 14-day window. The realistic approach is to lay out two plans side by side before confirmation — “if we win the venue (Scenario A)” and “if we don’t (Scenario B)” — so that on confirmation day all that remains is to flip the switch. Below is an outline of the design that follows from the measurements so far.
| Design item | Scenario A: Your area becomes a host venue | Scenario B: Your area does not become a host venue |
|---|---|---|
| Inventory allocation | At LT45–15, hold back a pre-confirmation block equal to your area’s measured last-minute absorption share. In the Saitama area and Kansai, more than 40% of rooms move at the last minute even in normal periods, so 40% of rooms remaining at LT15 is not excess inventory. | Release the held block straight to normal last-minute demand. LT14–0 is this market’s main battleground anyway, so a miss does not mean lost business. |
| Pricing | Decide in advance the date, keyed to venue confirmation, on which you will halt the standard last-minute markdown schedule. Since the measured standard is to cut 8–24% from LT90 to LT1, set a numeric price floor beforehand. | Return to the normal declining curve. If the halt decision is tied to a date, you can revert without hesitation the day after confirmation. |
| Cancellation policy | Set the free-cancellation deadline outside the venue-confirmation LT (2–8 days out). If the deadline falls inside the confirmation LT, you cannot absorb the wave of cancellations that follows a lost venue as sellable inventory. Relative to the confirmation LT, placing the paid-cancellation line at 10 days out is the straightforward choice. | The same policy works to retain guests who booked early. Reservations taken before confirmation tend to stay on the books after confirmation. |
| Length-of-stay conditions | The only games where multi-night stays can be structurally anticipated are Japan Series Games 3–5 (10/27–29, a three-game stretch at the Pacific League home ballpark). The CS Final is played on anywhere from 3 to 6 actual days within the 10/14–19 window, so a fixed minimum-stay requirement is likely to miss. Stick to soft incentives such as a second-night discount. | Without a minimum-stay requirement, rooms can be filled with single-night demand as is. A soft design means no missed opportunity under Scenario B either. |
| Decision calendar | Around 10/8 = CS participants and First Stage venues confirmed / 10/16–19 = Japan Series participants confirmed / 10/29–31 = whether Games 6–7 will be played confirmed. Put these three points on the calendar now as inventory and pricing review dates. | |
Source: Compiled by HotelBank Editorial Team from MetroEngines Research and the official NPB schedule
In practice, the most effective element is the last one: the decision calendar. The three branch points — October 8, October 16–19, and October 29–31 — can all be worked out today from NPB’s published schedule. Even if the venue itself cannot be predicted, the dates on which it becomes predictable are already fixed. Block out these three dates in advance as inventory and pricing review days, and there will be ample time to act once venues are confirmed.
Summary
The 2026 postseason is a difficult kind of demand for hotels: the schedule is completely fixed, yet the host cities are not decided until the last moment. The findings come down to four points.
First, the venue becomes known about 2 days in advance for the CS First Stage, about 6 days for the Final Stage, and 5–13 days for the Japan Series. Whether Games 6 and 7 are played at all is not decided until 1–3 days before. Second, capacity around the 12 home ballparks varies 298-fold within 5km, from 8.0 to 2,384.5 rooms per 1,000 spectators, and the thinner the stock near the ballpark, the scarcer “rooms you can walk back to” become. Third, most cities showing strong pace at this point (observed September 2) are being driven by other factors such as a three-day weekend, Halloween, or the Asian Para Games, while markets like Saitama and Hokkaido are candidate venues that have not yet moved. Fourth, even in normal periods 30–50% of inventory absorption occurs in the final 14 days, and venue-confirmation lead times fall within that window. The structural capacity to absorb this demand is there.
The remaining issue is that this last-minute window is currently designed to “cut prices to capture volume.” Listed prices fall 8–24% from LT90 to LT1. Unlike events with fixed dates such as fireworks festivals, where demand builds from 45 days out, postseason demand arrives in the same window as the markdown schedule. That is exactly why it pays to prepare the branches in advance rather than waiting for confirmation. Simply setting October 8, October 16–19, and October 29–31 as review dates substantially changes how much room you have to act once venues are confirmed.
⚠ Note on data for future dates: The estimated settled ADR, estimated occupancy, and listed prices for October–November 2026 in this article are estimates based on selling prices and inventory published on OTAs and other channels at the time of research (estimated occupancy and listed prices as of September 2, 2026; estimated settled ADR based on listed levels at the same point) and will change as check-in dates approach. All dates analyzed in this article are also more than 30 days after the time of writing, and the occupancy figures shown are interim readings of bookings still in progress. They do not indicate whether any specific property is sold out.
Related Articles
- Omagari Fireworks: Akita 97.8% OCC 45 Days Out, Only 2.2pt Headroom
- Autumn Festivals 2026: Kawagoe 1 Night, Kyoto 1, Saga 7 Nights
- NPB Postseason 2026: October Rates Flat in 8 of 11 Ballpark Markets
- NPB Away-Game Hotels 2026: ¥17,655-41,351 Across 12 Home Cities
References & Sources
■ Schedules, rules, and attendance (NPB official)
- NPB, “2026 Central League Climax Series Schedule”
- NPB, “2026 Pacific League Climax Series Schedule”
- NPB, “Notice on the 2026 Central/Pacific Climax Series” (August 24, 2026)
- NPB, “Japan Series 2026” schedule
- NPB, “2026 Central/Pacific Regular Season Attendance” (attendance by team, end of first half / as of July 26)
- NPB, “Home Ballparks of the 12 Teams”
- NPB, “2026 Central League Team Standings” / Pacific League Team Standings
■ Tournament schedules (public bodies and sports organizations)
- Japanese Olympic Committee, “Aichi-Nagoya Asian Games” (20th Asian Games, September 19–October 4, 2026)
- Japanese Paralympic Committee, “Aichi-Nagoya 2026 Asian Para Games” (October 18–24, 2026)
■ Lodging market data
- MetroEngines Research — estimated settled ADR (by prefecture, monthly, N=279–1,103 properties per prefecture); estimated occupancy and booking curves (by prefecture, daily, observed September 2, 2026); listed prices (2 guests, per room, tax included, all-plan average)
- MetroEngines Research — rooms at operating lodging facilities within 2km / 5km / 10km / 20km of the 12 teams’ home ballparks