

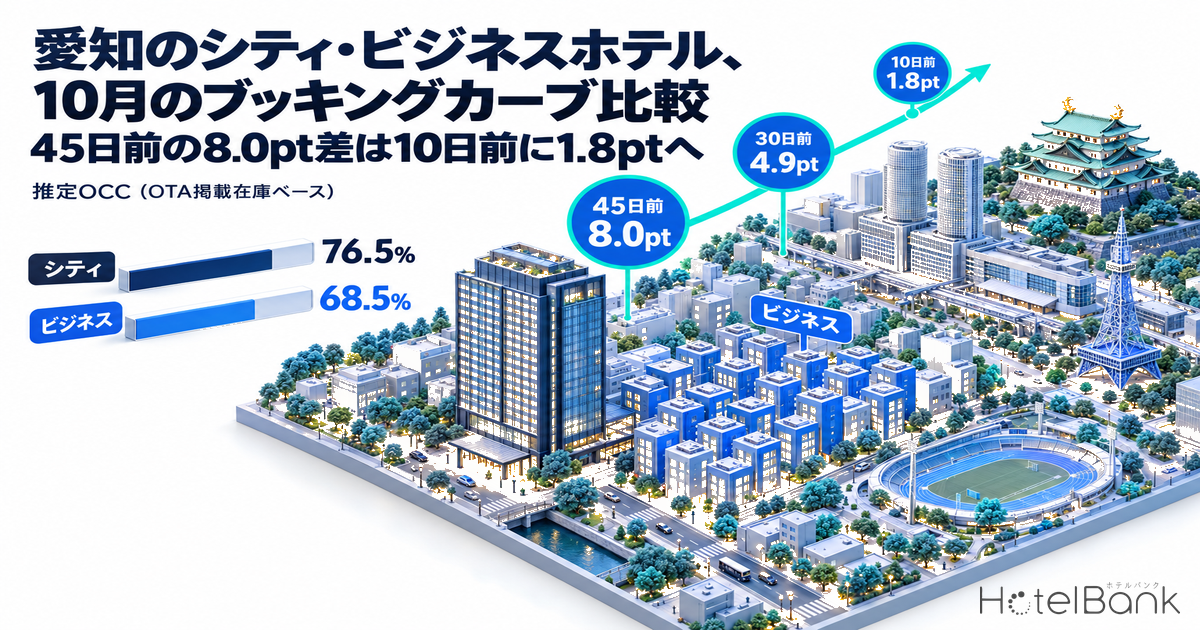
Put the booking pace of Aichi Prefecture’s city hotels and business hotels for October stay dates on the same yardstick and the difference in shape is plain. Averaged over the eight stay dates of October 1–8, estimated OCC (OTA-listed-inventory basis) stood at 76.5% for city hotels and 68.5% for business hotels 45 days out, a gap of 8.0pt; it narrowed to 4.9pt at 30 days out and to 1.8pt at 10 days out. City hotels were already at a high level 45 days out and stayed almost flat through 30 days out (+0.7pt), while business hotels built steadily from 45 days out (+12.4pt by 10 days out). The pattern is “city leads, business catches up later,” and it gives revenue managers a basis for setting the timing of inventory release and rate revisions separately by category.
Coverage: Aichi Prefecture city hotels N=23–24 properties (3,674–3,825 rooms) and business hotels N=173–176 properties (26,055–26,336 rooms). The price metric in this article is estimated settled ADR (the transacted price level estimated from OTA and other sales data, tax-exclusive equivalent); occupancy is an estimate based on OTA-listed inventory. Both are defined at the end of the article. Data as of September 29, 2026.
- — Category gap, Oct 1–8 average / 8.0pt at 45 days out → 4.9pt at 30 days out → 1.8pt at 10 days out
- — Build from 45 to 10 days out / City +6.2pt (23 hotels / 3,674 rooms) / Business +12.4pt (173–174 hotels / 26,141–26,194 rooms)
- — 45-days-out average, all 31 October dates / City 76.3%, Business 67.5%
- — Oct 17 (Sat), latest observation (19 days out) / City 89.6%, Business 86.5%
- — 45-days-out average, Asian Para Games period (Oct 18–24) / City 79.7%, Business 74.7%
Average Booking Curve for the First Week of October — City Flat Then Rising Late, Business a Straight Line
First, for the eight stay dates from October 1 (Thu) to October 8 (Thu), where observations are complete from 45 days out to 10 days out, we averaged estimated OCC at each number of days before the stay date. The figures track the same set of hotels throughout, so the shape of the curves themselves can be compared.
City hotels (23 hotels / 3,674 rooms) were at 76.5% 45 days out and 77.2% 30 days out, a build of only +0.7pt over those 15 days. Growth starts after the 30-day mark, reaching 82.7% at 10 days out (+5.5pt from 30 to 10 days out). Business hotels (173–174 hotels / 26,141–26,194 rooms), by contrast, went from 68.5% at 45 days out to 72.3% at 30 days out and 80.9% at 10 days out, rising without a break in both the first half (+3.8pt) and the second half (+8.6pt). The 8.0pt category gap at 45 days out shrank to 4.9pt at 30 days out and 1.8pt at 10 days out as business hotels caught up.
Because city hotels are already at a high level 45 days out, they have little headroom within this observation window, and their movement is concentrated after 30 days out. Business hotels start from a lower level at 45 days out and so build across the whole window. Even for the same “October weekdays and weekends,” the point at which inventory and rates should be moved differs by category.
Average of the eight stay dates October 1–8. Estimated OCC (OTA-listed-inventory basis). City: 23 hotels / 3,674 rooms; Business: 173–174 hotels / 26,141–26,194 rooms (as listed on major booking sites). The horizontal axis is the number of days remaining before the stay date.
Source: Compiled by the HotelBank Editorial Team from MetroEngines Research data
Three-Point Comparison of Representative Dates — Five Stay Dates from Oct 3 (Sat) to Oct 17 (Sat)
Next, we compare individual stay dates at three points: 45 days out, 30 days out, and the latest observation (September 28). Figures in parentheses are the sold-out hotel share (the estimated share of hotels with no listed inventory found on OTAs and similar channels); the latest-observation column also shows the days remaining at the time of observation.
| Stay date | Category | Coverage | 45 days out | 30 days out | Latest observation | 45 days out → latest |
|---|---|---|---|---|---|---|
| Oct 3 (Sat, during the Asian Games) | City | 23 hotels / 3,674 rooms | 93.9% (47.8%) | 93.7% (52.2%) | 94.7% (47.8%) (5 days out) | +0.8pt |
| Business | 173 hotels / 26,141 rooms | 85.4% (27.2%) | 88.8% (32.4%) | 94.0% (38.7%) (5 days out) | +8.6pt | |
| Oct 7 (Wed, weekday) | City | 23 hotels / 3,674 rooms | 63.7% (0.0%) | 66.0% (0.0%) | 75.6% (0.0%) (9 days out) | +11.9pt |
| Business | 173 hotels / 26,141 rooms | 54.1% (2.9%) | 59.3% (0.6%) | 73.0% (2.3%) (9 days out) | +18.9pt | |
| Oct 9 (Fri, eve of the long weekend) | City | 23 hotels / 3,674 rooms | 79.6% (17.4%) | 79.8% (17.4%) | 82.7% (21.7%) (11 days out) | +3.1pt |
| Business | 174 hotels / 26,194 rooms | 61.4% (5.8%) | 66.8% (4.6%) | 76.4% (9.8%) (11 days out) | +15.0pt | |
| Oct 10 (Sat, first day of the three-day weekend) | City | 23 hotels / 3,674 rooms | 82.0% (17.4%) | 89.9% (34.8%) | 92.7% (43.5%) (12 days out) | +10.7pt |
| Business | 174 hotels / 26,194 rooms | 68.0% (16.2%) | 74.8% (25.9%) | 85.5% (29.3%) (12 days out) | +17.5pt | |
| Oct 17 (Sat, eve of the Asian Para Games opening) | City | 23 hotels / 3,674 rooms | 81.8% (26.1%) | 85.4% (39.1%) | 89.6% (39.1%) (19 days out) | +7.8pt |
| Business | 174 hotels / 26,194 rooms | 76.8% (18.5%) | 82.5% (21.8%) | 86.5% (28.2%) (19 days out) | +9.7pt |
Source: Compiled by the HotelBank Editorial Team from MetroEngines Research data
October 9 (Fri) shows the difference in shape most clearly. City hotels barely moved, at 79.6% 45 days out and 79.8% 30 days out, with a temporary dip to 77.5% at 38 days out along the way. The latest observation at 11 days out was 82.7% (+3.1pt from 45 days out). Business hotels went from 61.4% at 45 days out to 66.8% at 30 days out and 76.4% at 11 days out, adding +15.0pt from 45 days out. The gap of 18.2pt at 45 days out had narrowed to 6.3pt by 11 days out.
On October 10 (Sat, the first day of the three-day weekend that includes Sports Day), city hotels rose early, from 82.0% to 89.9% by 30 days out, and the sold-out hotel share doubled from 17.4% to 34.8%. Business hotels went 68.0% → 74.8% → 85.5% (12 days out). On October 17 (Sat), city hotels went 81.8% → 85.4% → 89.6% (19 days out) and business hotels 76.8% → 82.5% → 86.5% (19 days out); in both categories the gain up to 30 days out was large. On dates where weekend or long-weekend demand is expected, city hotels also move by 30 days out, whereas on weekday-leaning dates the first half of the city curve tends to stay flat.
Booking curves for October 9 (Fri) and October 17 (Sat). Estimated OCC (OTA-listed-inventory basis). City: 23 hotels / 3,674 rooms; Business: 174 hotels / 26,194 rooms (as listed on major booking sites).
Source: Compiled by the HotelBank Editorial Team from MetroEngines Research data
45-Days-Out Levels for Every October Date — The Asian Games and Asian Para Games Periods Lift Weekdays
We lined up estimated OCC at 45 days out for all 31 October stay dates. The 45-days-out average for October as a whole was 76.3% for city hotels and 67.5% for business hotels, with city above business on all 31 dates. The average sold-out hotel share at 45 days out was also higher for city hotels, at 16.9% versus 9.1% for business hotels, meaning more city hotels fill early.
Two peaks stand out on the calendar. One is October 1–4, which overlaps the final days of the 20th Asian Games (September 19 – October 4, 2026) as published by the Japan Sports Agency; the 45-days-out average was 88.8% for city hotels and 80.8% for business hotels. The other is the period overlapping the 5th Asian Para Games (October 18–24), where the 45-days-out average was 79.7% for city hotels and 74.7% for business hotels. The difference is especially large on weekdays: for October 19 (Mon) – October 22 (Thu), during the Games, the 45-days-out average was 74.7% for business hotels and 79.2% for city hotels. Comparing the same Monday–Thursday run, October 5–8 came in at 56.3% for business and 64.2% for city, and October 26–29 at 58.8% for business and 68.6% for city, so weekdays during the Games are running at a different level from ordinary weekdays. The breadth of weekday demand in the Games week is analyzed in detail in Asian Para Games 2026: Aichi Weekdays Run 12pt Above the Next Week.
Estimated OCC (OTA-listed-inventory basis) at 45 days out for each stay date. City: 23–24 hotels / 3,674–3,825 rooms (24 hotels from October 27); Business: 173–176 hotels / 26,055–26,336 rooms (as listed on major booking sites).
Source: Compiled by the HotelBank Editorial Team from MetroEngines Research data
Sundays and the last day of long weekends are low in both categories. October 4 (Sun) was 80.2% for city and 70.5% for business, October 11 (Sun) 73.6% and 63.6%, and October 25 (Sun) 72.2% and 59.7%, each a step down from the preceding Saturday. Weekend strength is concentrated on Saturdays, and designing Sundays with the same thinking as weekdays is closer to reality.
Day-of-Week Results for Elapsed Months — August Shows Day-of-Week Gaps, September Narrows Them During the Games
As a premise for reading the October outlook, we averaged results for elapsed months (daily estimated OCC based on observations as of the day before each stay date) by day of the week. The values use the same fixed set of hotels.
| Month / category | Mon | Tue | Wed | Thu | Fri | Sat | Sun | Monthly avg. |
|---|---|---|---|---|---|---|---|---|
| August — City (22–23 hotels / 3,504–3,655 rooms) | 75.3% | 81.6% | 84.4% | 85.1% | 80.3% | 84.0% | 72.1% | 80.1% |
| August — Business (171–175 hotels / 25,652–26,025 rooms) | 79.4% | 86.6% | 87.9% | 87.9% | 82.4% | 82.7% | 73.5% | 82.5% |
| Sep 1–29 — City (21–23 hotels / 3,504–3,674 rooms) | 90.1% | 87.8% | 85.7% | 86.9% | 88.1% | 91.7% | 87.2% | 88.2% |
| Sep 1–29 — Business (171–175 hotels / 24,654–26,194 rooms) | 92.2% | 91.7% | 90.7% | 92.5% | 89.5% | 92.9% | 88.6% | 91.2% |
Source: Compiled by the HotelBank Editorial Team from MetroEngines Research data
In August, business hotels showed a weekday-type shape, high on Tuesday–Thursday at 86.6–87.9% and lowest on Sunday at 73.5%. City hotels were also lowest on Sunday at 72.1%, with Thursday (85.1%), Wednesday (84.4%) and Saturday (84.0%) high. In September (1–29), partly because the month includes the Asian Games period, the day-of-week spread narrowed to 88.6–92.9% for business hotels and 85.7–91.7% for city hotels. On the monthly average, city hotels were at 88.2% and business hotels at 91.2%, so in actual results business exceeds city. City runs higher in the leading indicator and business catches up in the results — consistent with the “catch-up” shape seen in the October curves.
Estimated Settled ADR Is Referenced for Closed Months Only — July and August Were Below the Prior Year
For price, we reference only closed months of estimated settled ADR (tax-exclusive equivalent) on a monthly basis. Values for the current and future months change with sales conditions and are not covered in this article.
| Closed month | City | N | Business | N |
|---|---|---|---|---|
| July 2025 | ¥11,684 | 31 hotels | ¥7,584 | 327 hotels |
| July 2026 | ¥11,466 (YoY −1.9%) | 30 hotels | ¥7,491 (YoY −1.2%) | 323 hotels |
| August 2025 | ¥13,368 | 30 hotels | ¥8,149 | 324 hotels |
| August 2026 | ¥12,030 (YoY −10.0%) | 31 hotels | ¥7,852 (YoY −3.6%) | 319 hotels |
| October 2025 (reference; prior-year closed value) | ¥12,996 | 30 hotels | ¥7,815 | 322 hotels |
Source: Compiled by the HotelBank Editorial Team from MetroEngines Research data
The closed values for July 2026 were ¥11,500 for city hotels (N=30) and ¥7,500 for business hotels (N=323), down 1.9% and 1.2% YoY respectively. August came in at ¥12,000 for city hotels (N=31) and ¥7,900 for business hotels (N=319), down 10.0% and 3.6% YoY. The closed values for October of the prior year were ¥13,000 for city and ¥7,800 for business. A comparison with this October’s closed values has to wait for month-end closing, but the question is how the shortfall against the prior-year level in the closed summer months can be recovered in October, a month with demand peaks.
For Revenue Managers Running City and Business Hotels in Aichi — Implications and Action Plan
1. Separate “when to move” by category. City hotels in the market are already at a high level 45 days out, and in the first-week-of-October average the build up to 30 days out was only +0.7pt. If you operate a city hotel, slow pickup at your property between 45 and 30 days out is itself the same shape as the market, and is unlikely to justify pre-emptive discounting in that interval. It is natural to put the weight of rate decisions after 30 days out, when the market starts to move.
2. A “don’t raise it all at once” design suits business hotels. Business hotels in the market build without a break from 45 to 10 days out, gaining +8.6pt from 30 to 10 days out on the first-week average. Because demand keeps coming in during the second half, it is better to leave room for step-by-step revisions as pace develops than to lock in a high rate early.
3. Weekdays during the Games are not “weekdays.” October 19–22, which overlaps the Asian Para Games, was at 74.7% for business hotels 45 days out, higher than the same run of days on October 5–8 (56.3%). If your rate calendar is built on day of week alone, this period is worth switching to individual settings and reviewing.
4. Decouple Saturday and Sunday. October 25 (Sun) was at 72.2% for city and 59.7% for business 45 days out, clearly lower than the Saturdays of the same month. Rather than treating the weekend as one block, consider building Sundays with multi-night conditions or weekday-type settings.
The action plan is organized in three tiers, starting with the stay dates that have the fewest days remaining: this week, within two weeks, and looking ahead to November and beyond. Every decision trigger is a market figure shown in this article.
| Time horizon | Measure | Decision trigger (figures in this article) | Aim |
|---|---|---|---|
| Today – this week | Treat weekdays of Oct 18–24 (the Asian Para Games period) as a price and inventory calendar separate from ordinary weekdays | When your property’s booking pace for weekdays in that period has not reached the market’s 45-days-out level (business average 74.7%, city average 79.2%) | Avoid missing weekday demand during the Games by leaving ordinary-weekday settings in place |
| Today – this week | For remaining weekend inventory such as Oct 17 (Sat) and Oct 24 (Sat), make holding the rate, not discounting, the baseline | Dates on which the market’s latest sold-out hotel share has risen to 39.1% for city and 28.2% for business (Oct 17) | Protect the last rooms on peak dates on the assumption that they will fill |
| Within two weeks | For business hotels, assume a build after 30 days out and revise rates in stages rather than in a single move | When your property is also building after 30 days out, just as the business first-week average rose +8.6pt from 30 to 10 days out | Leave room to raise rates step by step in line with second-half growth |
| Within two weeks | For city hotels, the smaller the build up to 30 days out on a given date, the more rate decisions should be timed to the pickup after 30 days out | When your property shows the same shape as the city first-week average, which gained only +0.7pt from 45 to 30 days out | Avoid the decision to fill early through early discounting |
| Toward November and beyond | Reflect the category differences for Sundays, long-weekend final days and weekends in the next demand-calendar design | When the pattern persists of Oct 25 (Sun) at 45 days out — 72.2% for city, 59.7% for business — sitting below the Saturdays of the same month | Design Sunday inventory and multi-night conditions separately from the weekend |
| Toward November and beyond | Establish a routine of checking the market’s closed-month estimated settled ADR side by side with your property’s actual rate every month | Where your property’s actual results sit relative to the closed August 2026 values of ¥12,030 for city and ¥7,852 for business | Check for price-band drift at every month-end close |
Summary — Three Yardsticks for Reading the Curve
October in Aichi Prefecture is progressing with city hotels leading and business hotels catching up later. We narrow the yardsticks for turning this shape into decisions at your own property down to three.
| Yardstick | How to read it | Value in this article |
|---|---|---|
| 1. Level gap at 45 days out | How far one category is ahead of the other | Oct 1–8 average: 8.0pt (City 76.5%, Business 68.5%) |
| 2. Build from 45 to 30 days out | Whether the category moves in the first half or the second half | City +0.7pt / Business +3.8pt |
| 3. Build from 30 days out to the latest point | How much demand remains close to the stay date | City +5.5pt / Business +8.6pt (through 10 days out) |
Set the three yardsticks beside your own pace for the same stay dates and you can tell whether you are “behind the market or in the same shape as the market.” If the shape is the same there is no need to rush; only when the shape differs is there a reason to move inventory and rates.
Frequently Asked Questions
Q. Why does estimated OCC look higher than actual occupancy?
A. It is back-calculated from the remaining rooms listed on OTAs and similar channels, and rooms that are not listed are counted as consumed, so it comes out higher than actual room occupancy. This article focuses less on the level itself than on the gap between categories and the change over time.
Q. Why do the days remaining for the “latest” point differ by stay date?
A. Because the latest observation on September 28, 2026 is used as the “latest” point, the further ahead the stay date, the more days remain. For comparisons averaged over multiple dates, we used 10 days out, where observations are available for every date, as the common final point.
Q. Why is estimated settled ADR for October not shown?
A. Estimated settled ADR for the current and future months changes with sales conditions, so this article references only closed months (July and August 2026 and the corresponding prior-year months) on a monthly basis.
About the Data
| Definition of estimated OCC | OTA-listed-inventory occupancy = 100 − 100 × rooms remaining on OTAs ÷ total rooms. Coverage is a fixed cohort of hotels that list at least 30% of their total rooms on OTAs (the same set of hotels for each stay date). It is an estimate based on the consumption of inventory sold on OTAs and is defined differently from actual room occupancy (it comes out higher because unlisted rooms are counted as consumed). |
| Booking curve | Based on observations from 45 days before the stay date to the most recent. The fixed points are 45 days out, 30 days out, and the latest (the most recent observation on September 28, 2026). |
| Definition of estimated settled ADR | The transacted price level (tax-exclusive equivalent) estimated from OTA and other sales data (lowest-plan level × category-specific coefficient, an ensemble across multiple channels). Past months are closed values; the current and future months are estimates based on sales conditions at the time. Median error of 6.6% when checked against published operating results. This article uses closed values only. |
| Coverage N= | Booking curves (October stay dates): City 23 hotels / 3,674 rooms (24 hotels / 3,825 rooms for Oct 27–31), Business 173–176 hotels / 26,055–26,336 rooms. Elapsed-month results: August — City 22–23 hotels, Business 171–175 hotels; September — City 21–23 hotels, Business 171–175 hotels. Estimated settled ADR: City 30–31 hotels, Business 319–327 hotels (varies by month; shown in the table). All in Aichi Prefecture. |
| Data as of | Data as of September 29, 2026. Sales conditions and inventory change daily, so the figures in this article are a snapshot at the time of retrieval. |
References and Sources
■ Data sources
OTA-listed inventory and price data observed by MetroEngines Research for each stay date (a fixed cohort of 23–24 city hotels and 173–176 business hotels in Aichi Prefecture). Games periods are based on information published by the Japan Sports Agency.
■ Calculation assumptions
Estimated OCC is calculated as “100 − 100 × rooms remaining on OTAs ÷ total rooms,” limited to hotels that list at least 30% of their total rooms on OTAs. The October 1–8 average is a simple average of the eight stay dates for which observations are complete from 45 to 10 days out. “Latest” is the most recent observation on September 28, 2026. Estimated settled ADR uses closed months only (July and August 2026, the same months of the prior year, and October of the prior year).
■ Limitations and caveats
Estimated OCC counts unlisted rooms as consumed and therefore comes out higher than actual room occupancy. City hotels are few in number (N=23–24), so inventory changes at a single hotel have a large effect on the average. October figures are a snapshot at the time of retrieval and will change before the stay date. The overlap with the Games periods indicates a coincidence of dates and does not identify the cause of any increase in demand.
■ Market data and public information