

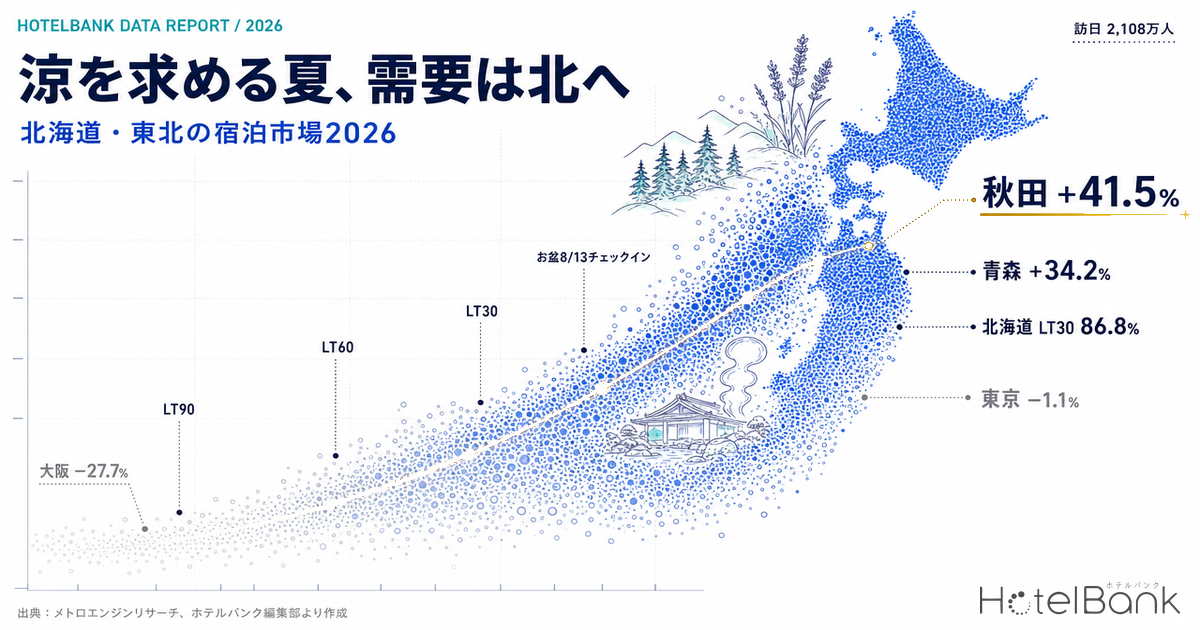
Inbound arrivals to Japan in the first half of 2026 (January–June) came in at 21.08 million, down 2.0% year on year. June alone recorded 3.15 million visitors (down 6.8% YoY), the third consecutive month below the prior year — but that decline is driven overwhelmingly by China, down 57.3%, while 15 markets including Taiwan, South Korea, the United States and the Nordics posted record highs for the month of June. The market is not so much decelerating as dispersing. Domestically, meanwhile, record-breaking heat has sharpened a “escape the heat” travel preference, and demand seeking cooler destinations is now visibly turning toward Hokkaido and Tohoku. This article quantifies the upside the north is capturing this summer, comparing occupancy and pricing across Hokkaido, Aomori, Akita, Miyagi and Yamagata against the metropolitan markets of Tokyo and Osaka.
Metric Definitions Used in This Article
- ADR (Average Daily Rate): An estimated settled rate (tax-exclusive equivalent) calculated by applying category-specific adjustment coefficients to the lowest publicly listed plan level on OTAs (double occupancy, per-room rate, tax-inclusive). Cross-checked against property-level disclosures from listed hotel REITs (91 properties, most recent 3 months), the median error is approximately 7%. These are estimates and differ from each property’s actual transacted prices or accounting figures. Area-level ADR is the median of the properties covered (the level of a typical property in that area).
- OCC (Occupancy Rate): The share of sold rooms against total rooms in the area (an estimate based on OTA-listed inventory). Because it is derived from the depletion of inventory listed on OTAs, it differs from a property’s true operating occupancy.
- LT (Lead Time): Days remaining until the check-in date. LT0 = same day.
- Data source: MetroEngines Research. Of approximately 168,000 lodging facilities in Japan tracked by MetroEngines Research, roughly 27,000 facilities and 1.26 million rooms with confirmed activity on OTAs are included in this analysis.
- — 21.08 million arrivals in H1 (down 2.0% YoY), but excluding China’s 57.3% decline, 15 markets including Taiwan, South Korea and the United States set June records. The market is dispersing, not shrinking.
- — Record heat has strengthened the appetite for cooler destinations; JTB’s summer outlook puts Hokkaido up 11.2% year on year. Demand is turning clearly toward Hokkaido and Tohoku.
- — For the Obon peak (August 13 check-in), Hokkaido is at 74.8% occupancy at LT90, running roughly 10 points ahead of the cities (Tokyo 64.4%). The northern booking curve leads the metros.
- — August estimated settled ADR is up double digits in all five northern prefectures (Akita +41.5%, Aomori +34.2%), while Tokyo is essentially flat and Osaka is down 27.7% on a payback effect.
- — The ryokan segment also shows double-digit gains, and rate upside built on “cool climate × cuisine” underpins the north’s summer headroom.
21.08 Million in H1, a Third Straight Monthly Decline in June — Yet 15 Markets Hit Records
According to estimates from the Japan National Tourism Organization (JNTO), inbound arrivals in June 2026 totaled 3,148,600, down 6.8% year on year. The cumulative January–June figure reached 21,084,800 (down 2.0% YoY), still a high level for a first half. The main driver of the decline is the Chinese market, which fell 57.3% year on year in June, attributed to Chinese government travel advisories and reduced flight capacity.
The fuller picture, however, looks less like contraction than a change in the cast of characters. Fifteen markets — Taiwan, South Korea, Vietnam, India, Australia, the United States, Canada, Mexico, the United Kingdom, France, Italy, Spain, Russia, the Nordics and the Middle East — set new June records. Taiwan in particular has held near record-high levels and now anchors a more diversified inbound mix as China slows. Reduced dependence on any single country, with demand spreading across multiple markets, is arguably a tailwind when thinking about seasonal and regional dispersion. Note that this article treats country-level movements as a rough reference based on JNTO’s estimated visitor counts, and does not evaluate the relative performance of individual markets.
Reinforcing this dispersion from the domestic side is the record-breaking heat. According to JTB’s outlook for the 2026 summer holiday period (July 15 – August 31), 15.8% of domestic travelers intend to “avoid the heat and enjoy sightseeing or activities at indoor facilities,” and travel making use of early-morning and nighttime hours is expected to increase. Among destinations, Hokkaido ranks third at 11.2%, behind Kanto (19.0%) and Kinki (14.9%). The sections that follow examine, through the data, how this cool-seeking destination choice is showing up in lodging demand across Hokkaido and Tohoku.
Obon Booking Pace Runs Ahead in the North — The Booking Curve for August 13 Check-In
Nothing captures the direction of demand more directly than the booking pace on a peak date. Lining up area-level booking curves (estimated occupancy based on OTA-listed inventory) for check-in on August 13, 2026 — the middle day of the Obon holiday — Hokkaido and Tohoku are depleting inventory faster than the metropolitan areas from an early stage in the lead time (LT).
Source: Compiled by the HotelBank Editorial Team from MetroEngines Research (check-in 2026-08-13, all facilities)
At LT90 (roughly three months before check-in), Hokkaido stands at an estimated 74.8% occupancy, Akita 74.1%, Aomori 72.1%, Yamagata 70.3% and Miyagi 70.2% — all already in the 70% range. Tokyo, by contrast, is at 64.4% and Osaka at 64.8%, leaving the metros roughly 10 points behind the north at this point. By LT30 (about one month out), Hokkaido has built to 86.8% and Aomori to 86.7%, widening the gap against Tokyo at 76.0% and Osaka at 73.2%. City inventory still has slack while peak-date inventory in the north tightens ahead of schedule — this asymmetry is what summer demand shifting toward cooler destinations looks like in practice. Sell-out timing also varies sharply at the individual-property level on the Obon peak dates, with onsen ryokan in particular closing out well ahead of the area average.
| Area | LT90 | LT60 | LT30 | LT21 | Rooms covered |
|---|---|---|---|---|---|
| Hokkaido | 74.8% | 79.4% | 86.8% | 89.0% | 91,754 |
| Aomori | 72.1% | 75.6% | 86.7% | 89.6% | 12,635 |
| Akita | 74.1% | 76.9% | 83.8% | 86.2% | 9,998 |
| Miyagi | 70.2% | 73.3% | 81.3% | 84.6% | 26,324 |
| Yamagata | 70.3% | 73.4% | 81.8% | 85.7% | 11,374 |
| Tokyo | 64.4% | 68.9% | 76.0% | 78.6% | 181,295 |
| Osaka | 64.8% | 67.8% | 73.2% | 76.3% | 110,137 |
Source: Compiled by the HotelBank Editorial Team from MetroEngines Research
Recent-Month Occupancy Is High Everywhere — The Difference Shows Up in the Price Trajectory
Looking at estimated occupancy (based on OTA-listed inventory) for June 2026, the most recent past month available, by facility category, occupancy itself is uniformly high in both the north and the cities. Hokkaido stands at 93.2% across all facilities, with ryokan at 90.3% and resorts at 90.2%. Tokyo is at 94.4% for all facilities and Osaka at 88.0%. In other words, summer occupancy is close to saturation nationwide, and occupancy alone does not reveal any northern advantage. Where the difference does show up clearly is in the price trajectory — the year-on-year change in ADR.
| Area | All facilities | Ryokan | Resort | City hotel | Business hotel |
|---|---|---|---|---|---|
| Hokkaido | 93.2% | 90.3% | 90.2% | 94.1% | 94.5% |
| Aomori | 94.9% | 92.9% | 96.3%† | 94.3% | 95.5% |
| Akita | 92.0% | 89.9% | 88.8%† | 92.9% | 92.7% |
| Miyagi | 91.2% | 85.3% | 87.6% | 93.6% | 92.4% |
| Yamagata | 91.7% | 88.5% | 86.0% | 92.8% | 94.4% |
| Tokyo | 94.4% | 92.4% | 87.6% | 94.1% | 94.3% |
| Osaka | 88.0% | 82.9% | 89.1% | 90.7% | 86.3% |
† Resort figures for Aomori and Akita cover only four facilities each and are reference values. Source: Compiled by the HotelBank Editorial Team from MetroEngines Research (June 2026)
Double-Digit ADR Gains in the North, Flat to Negative in the Cities — Quantifying August Headroom
Comparing estimated all-facility ADR for August 2026 (based on listings at the time of the survey) against the same month last year, the scale of the increase across Hokkaido and Tohoku stands out. Akita is up 41.5% year on year (approximately ¥9,400 → ¥13,300), Aomori up 34.2% (approximately ¥10,600 → ¥14,200), Yamagata up 31.1% (approximately ¥10,400 → ¥13,600), Miyagi up 19.3% (approximately ¥10,600 → ¥12,600) and Hokkaido up 14.2% (approximately ¥12,900 → ¥14,700) — double-digit growth in all five prefectures.
Source: Compiled by the HotelBank Editorial Team from MetroEngines Research (all facilities, estimated settled ADR, August)
By contrast, growth in the metropolitan markets has run its course. Tokyo is down 1.1% (approximately ¥13,000 → ¥12,900), essentially flat, while Osaka has corrected sharply at down 27.7% (approximately ¥13,500 → ¥9,700). Osaka’s decline is largely a payback effect from the unwinding of the temporary premium associated with the 2025 Osaka-Kansai Expo, and needs to be read separately from the underlying trend. Either way, with urban rate growth pausing this summer, conditions are falling into place for the north to capture ADR headroom.
Source: Compiled by the HotelBank Editorial Team from MetroEngines Research (all-facility ADR, year-on-year, August 2026)
Rate Levels in the Ryokan Segment — Upside Framed by Cool Climate and Cuisine
At the core of the demand the north is capturing are the ryokan and resorts of its summer retreats. Looking at estimated August ADR for the ryokan segment, where the sample is deep (N = 70–185 facilities per prefecture), Akita is up 35.9% (approximately ¥10,400 → ¥14,100), Aomori up 29.1% (approximately ¥11,300 → ¥14,500) and Hokkaido up 22.5% (approximately ¥11,300 → ¥13,800) — double-digit gains in the ryokan category on its own. Miyagi (approximately ¥15,900, up 5.2%) and Yamagata (approximately ¥14,800, up 10.1%) started from higher rate levels, so their growth rates are more moderate, but they rank at the top in absolute terms.
| Area (ryokan) | August 2025 | August 2026 | YoY | Facilities covered |
|---|---|---|---|---|
| Akita | ¥10,400 | ¥14,100 | +35.9% | 89 |
| Aomori | ¥11,300 | ¥14,500 | +29.1% | 70 |
| Hokkaido | ¥11,300 | ¥13,800 | +22.5% | 274 |
| Yamagata | ¥13,400 | ¥14,800 | +10.1% | 185 |
| Miyagi | ¥15,100 | ¥15,900 | +5.2% | 111 |
Source: Compiled by the HotelBank Editorial Team from MetroEngines Research (ryokan, estimated settled ADR, August)
There is considerable room here to combine cool-climate stay demand with the culinary potential of local ingredients. Resorts in Hokkaido maintain the highest absolute level, with estimated August ADR of approximately ¥20,000 (N = 145), and for both ryokan and resorts, layering tiered pricing around “cool climate × cuisine × length of stay” opens up further revenue opportunity. Precisely when urban markets loosen in summer, northern areas are positioned to capture upside in both rate and occupancy.
⚠ A note on ADR and occupancy for future dates: The July–August 2026 ADR figures and Obon booking pace in this article are estimates based on selling prices and inventory published on OTAs at the time of the survey, and will shift as the check-in dates approach. Please note that the addition of new plans or last-minute price adjustments may move levels away from those shown here. For the Kansai area, the payback risk from the unwinding of the Expo premium should also be taken into account.
Conclusion — Dispersing Inbound Demand and Record Heat Lift “Summer in the North”
Inbound arrivals in the first half of 2026 came in slightly below the prior year on China’s slowdown, but 15 markets set June records and demand is shifting away from dependence on any single country toward dispersion. Layered on top of this structural change, a domestic preference for “escaping the heat” driven by record temperatures is lifting summer demand across Hokkaido and Tohoku. Booking pace on the Obon peak date runs consistently ahead of the cities in the north, and August ADR is up double digits in all five prefectures. With the metros flat to correcting, northern areas retain upside in both rate and occupancy. Designing around the seasonal asset of a cool climate, combined with cuisine and length of stay, will be the key to maximizing this summer’s revenue opportunity.
For operators: plan-naming cues that work for this theme
The most common appeal elements among plan names published for Hokkaido × summer (N = 608) —
Room only 43%Breakfast included 39%Seasonal sale 32%Sale 21%Buffet 13%Near the station 7%
Examples of actual names (anonymized, shown in the original Japanese with an English gloss):
- 【SALE】夏のふたり旅におすすめ★高層階ダブル<ラウンジサービス&朝食ビュッフェ付> — “[SALE] Recommended for a summer trip for two ★ High-floor double <lounge service & breakfast buffet included>”
- 【夏秋旅セール】ファミリー・カップル歓迎♪シンプルステイプラン【素泊り】 — “[Summer & autumn travel sale] Families and couples welcome ♪ Simple stay plan [room only]”
* These are tendencies derived from aggregated published plan names and do not demonstrate a causal relationship between naming and sales.
References and Sources
- Foreign Visitors to Japan (June 2026 estimates) | JNTO (Japan National Tourism Organization)
- Foreign visitors to Japan down 6.8% year on year to 3.15 million in June 2026, with records in 15 markets (Travel Voice, July 15, 2026)
- Travel Outlook for the 2026 Summer Holiday Period (July 15 – August 31) | JTB
- 2026 summer holiday travel forecast: total travelers down 5% to 71.17 million (Travel Voice, July 2, 2026)
- MetroEngines Research — estimated settled ADR, estimated occupancy (OCC) and booking-curve analysis based on OTA published price data