

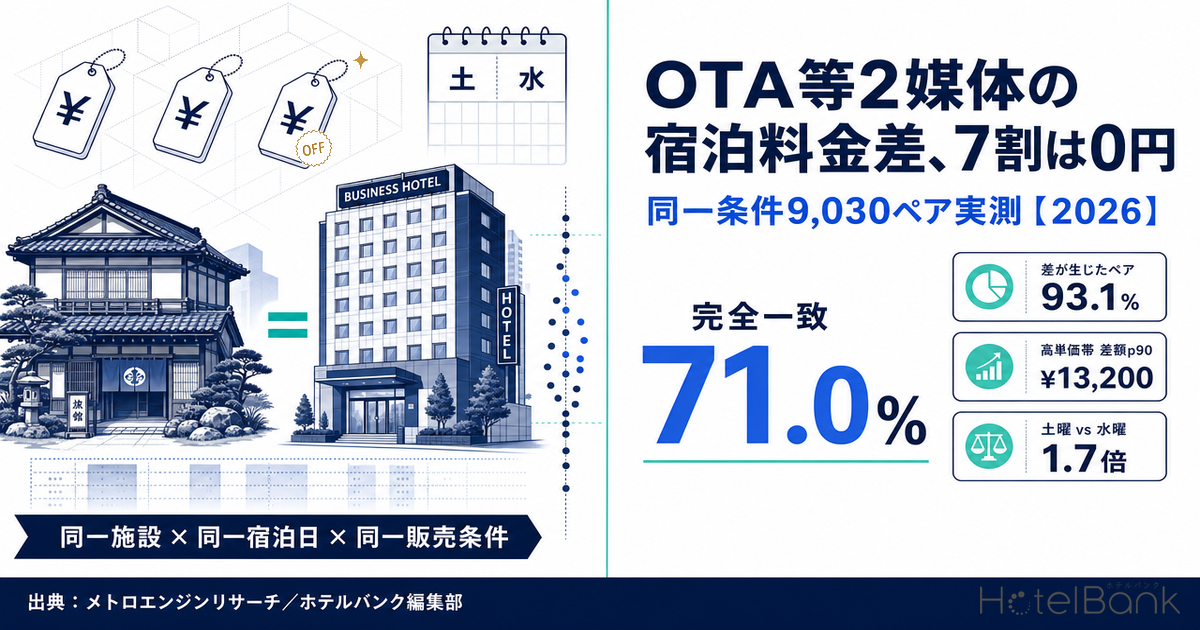
The same property, the same night, the same room conditions. Line those listings up across multiple booking platforms and how much do the prices actually differ? The sense that “the price depends on which site you use” runs deep among both industry professionals and travelers, yet almost no public dataset measures, at the room level, how large those gaps are and where they concentrate. The HotelBank Editorial Team therefore ran a direct measurement study: taking properties listed simultaneously on two major Japanese OTAs and comparable booking platforms, we aligned property, stay date and sales conditions, then compared the advertised prices side by side.
The headline finding first. Of the 9,030 pairs that could be compared under identical conditions, 71.0% differed by not a single yen. A gap appeared in the remaining 29.0%, with a median of roughly ¥1,000 (6.9% against the cheaper side). In other words, prices are aligned across most of the market, and gaps are concentrated in specific segments. That concentration follows clear patterns by property type, price band, region and day of week. What follows reads those patterns through the lens of channel strategy.
Metric Definitions Used in This Article
- Advertised price: the selling price published on a booking site. Throughout this article, conditions are fixed to the per-room rate for 2 guests per room (tax included), room-only (no breakfast, no dinner), on plans open for booking at the time of collection, and the lowest advertised price for that property on that date is used as the representative value. This is not the actual transacted price.
- Pair: a combination of the same property × the same stay date × the same sales conditions where a price existed on both platforms and both prices were collected on the same date. Combinations whose collection dates did not match were excluded entirely, since a timing lag creates an apparent gap.
- Price gap: the higher side minus the cheaper side within a pair (in yen). Gap rate = price gap ÷ cheaper side × 100 (%).
- Match rate: the share of pairs whose price gap was ¥0.
- Platform A / Platform B: two major Japanese OTAs and comparable booking platforms. This article does not identify them by name and refers to them as A and B.
- Data source: MetroEngines Research
- — 71.0% — the share of the 9,030 pairs, matched on property, stay date and sales conditions, whose prices did not differ by a single yen. The median price gap was ¥0, and ¥300 at p75.
- — Clustered at 5% and 11% — gap rates across the 2,623 pairs that did differ pile up at specific values, consistent with a 5% or 10% discount sitting on one platform only.
- — ¥13,200 — the p90 gap in the high-rate band above ¥40,000. That is 13x the ¥1,000 seen below ¥10,000, and gaps widen consistently as the rate band rises.
- — 93.1% — the share of the 363 properties with observed gaps where the cheaper platform was the same on every stay date. Price gaps are the result of design, not noise.
- — 81.4% ↔ 42.9% — the highest match rate was Nagano, the lowest Okinawa. The higher the share of ryokan in a region, the more aligned prices are; the higher the resort share, the wider the gaps.
Seven in ten match exactly — “prices differ by site” is not the majority case
The study population was drawn from the roughly 168,000 domestic properties tracked by MetroEngines Research, restricted to those confirmed as operating and then filtered to four property types — ryokan, resort hotels, business hotels and city hotels — with at least 10 guest rooms and a listing on both of the two major booking platforms. Six stay dates were selected across September, October and November 2026: three Saturdays (Sep 12, Oct 10, Nov 14) and three Wednesdays (Sep 16, Oct 14, Nov 18). Including equal numbers of weekend and weekday dates keeps peak-demand bias from distorting the conclusions.
Those conditions produced 9,030 pairs across 4,710 properties. The distribution of gaps is shown below.
Source: MetroEngines Research; compiled by the HotelBank Editorial Team (N=9,030 pairs / 4,710 properties)
Zero-yen gaps account for 71.0%, followed by gaps of ¥1–499 at 7.6%. Those two buckets alone reach 78.6%. Conversely, gaps of ¥1,000 or more — the level a traveler would clearly register as “different” — make up just 16.1% of the total. Gaps of ¥5,000 or more come to 3.8%.
By percentile: p25 = ¥0, p50 (median) = ¥0, p75 = ¥300, p90 = ¥1,900. Converted to rates, p75 = 2.3% and p90 = 11.1%. For three-quarters of the market, the gap is ¥300 or less. One methodological note: computing these percentiles through string concatenation on the database side truncates values and introduces error, so they were calculated after extraction, holding the property-level data intact.
As a robustness check, we also tested loosening the same-collection-date requirement to ±1 day and ±2 days. At ±1 day, N=17,048 with a 69.7% match rate and p90 of about ¥2,000. At ±2 days, N=17,761 with a 68.8% match rate and p90 of about ¥2,000. Roughly doubling the sample does not move the conclusion. All analysis below uses the strictest specification — same collection date, N=9,030.
The gap is a one-sided 5% or 10% discount — gap rates cluster at specific values
So what is actually inside the 2,623 pairs that did differ? Slicing the distribution of gap rates does not produce a smooth curve; it piles up distinctly at several values.
Source: MetroEngines Research; compiled by the HotelBank Editorial Team (N=2,623 pairs — only pairs where a price gap occurred)
The thickest band is 5–8% at 24.4%, followed by 3–5% at 12.0% and 10–12% at 10.8%. The location of these peaks is meaningful. Being 5.3% above the cheaper side is precisely the relationship in which applying a 5% discount to the higher price yields the cheaper one. Likewise, 11.1% corresponds to a 10% discount. In practice, pairs falling between 5.0% and 5.6% represent 13.8% of all pairs with a gap, and those between 10.5% and 11.7% represent 7.0%. Together, more than a fifth are explained by the fingerprints of these two discount rates.
In other words, a substantial share of the price gaps observed across booking platforms most likely reflects not different base rates but a coupon or discounted plan sitting on one platform only. Keeping the base rate aligned while varying promotional allocation by platform is not a breakdown in price control — it reads more naturally as deliberate channel design.
That said, 10.6% of pairs showed gaps of 30% or more. This band cannot be explained by discount rates, and likely reflects cases where the cheapest plan offered on each platform differs in substance (room grade or allocation). This study aligns property, date and sales conditions, but does not standardize room grade itself, so differences in room composition are mixed into this layer — a point worth stating explicitly.
By property type — 80% of ryokan match exactly, and when they differ it is ¥2,200
Breaking the data down by property type shows that “match rate” and “size of gap when one occurs” move in opposite directions.
Source: MetroEngines Research; compiled by the HotelBank Editorial Team
| Property type | Pairs | Properties | Match rate | Gap p75 | Gap p90 | Median gap when one occurs |
|---|---|---|---|---|---|---|
| Ryokan | 3,364 | 1,752 | 80.1% | ¥0 | ¥2,200 | ¥2,200 (11.1%) |
| Resort hotel | 753 | 370 | 69.9% | ¥1,000 | ¥4,000 | ¥2,100 (11.1%) |
| Business hotel | 4,143 | 2,167 | 65.0% | ¥400 | ¥1,279 | ¥700 (5.5%) |
| City hotel | 770 | 421 | 64.0% | ¥480 | ¥1,602 | ¥864 (5.3%) |
| Overall | 9,030 | 4,710 | 71.0% | ¥300 | ¥1,900 | ¥1,000 (6.9%) |
Source: MetroEngines Research; compiled by the HotelBank Editorial Team (same-collection-date pairs only)
Ryokan post the highest match rate of the four types at 80.1%. The likely background is that the number of room-only plans is limited to begin with, and finely segmenting promotional allocation by platform is uncommon. Yet once a gap does appear, its median is ¥2,200 (11.1%) — more than triple that of business hotels. The ryokan gap is the “rare but large” type.
Business hotels are the mirror image: the lowest match rate at 65.0%, but a median gap of only ¥700 (5.5%) when one occurs. Rates are revised frequently, so differences in how quickly each platform reflects a change, or whether a small coupon is attached, surface as fine-grained gaps. Because the absolute amounts are small, travelers experience these as “essentially the same”.
Resort hotels sit at a 69.9% match rate with a p90 gap of ¥4,000 — the widest swing in absolute terms. Rate levels are high, so the same discount percentage translates into a larger yen figure. This is the layer where platform-specific promotional design feeds most directly into average rate, and where the room to design allocation across channels is widest.
Gaps widen as rates rise — above ¥40,000, one pair in ten differs by ¥13,200
Cutting the data by rate level reveals a simpler structure. The table below splits pairs into five bands based on the cheaper side.
Source: MetroEngines Research; compiled by the HotelBank Editorial Team
| Rate band (cheaper side, 2 guests/room, room-only) | Pairs | Match rate | Gap p90 | Gap rate p90 | Median gap when one occurs |
|---|---|---|---|---|---|
| Under ¥10,000 | 1,696 | 61.4% | ¥1,000 | 12.5% | ¥500 |
| ¥10,000–15,000 | 2,910 | 72.4% | ¥1,130 | 10.0% | ¥800 |
| ¥15,000–25,000 | 2,657 | 76.2% | ¥1,662 | 8.3% | ¥1,210 |
| ¥25,000–40,000 | 1,203 | 72.2% | ¥4,000 | 11.7% | ¥2,530 |
| ¥40,000 and above | 564 | 64.7% | ¥13,200 | 22.8% | ¥6,600 |
Source: MetroEngines Research; compiled by the HotelBank Editorial Team (N=9,030 pairs)
The match rate itself forms a gentle arc, peaking at 76.2% in the ¥15,000–25,000 band and easing off in the bands above and below. The size of the gap, however, expands consistently with the rate band. The median gap when one occurs widens 13-fold, from ¥500 below ¥10,000 to ¥6,600 above ¥40,000. At p90 it reaches ¥13,200.
The p90 gap rate in the ¥40,000-plus band also stands out at 22.8%, which cannot be explained by amount size alone. At higher rates, platform-specific benefit design (multi-night perks, meal upgrades, discounts equivalent to points rebates) tends to layer up, so the composition of the cheapest plan diverges more readily by platform. The higher a property’s rates, the more genuine freedom it has to design a distinct value proposition per channel — that is how this data reads. For how long high-rate rooms actually remain in inventory, see our detailed analysis in Do ¥100k+ Rooms Sell Last? Index 53 on Normal Saturdays, 24 at Obon.
By region — Nagano at 81.4% against Okinawa at 42.9%, reflecting demand structure
Match rates are shown below for the 16 prefectures with at least 150 pairs.
Source: MetroEngines Research; compiled by the HotelBank Editorial Team (prefectures with 150 or more pairs)
Prices are most aligned in Nagano at 81.4% (N=404), followed by Kyoto at 77.7% (N=197) and Tochigi at 76.5% (N=251). All three are regions with a high share of ryokan and hot-spring inns, so the property-type pattern carries straight through.
At the other end, gaps are most likely in Okinawa, with a match rate of 42.9% (N=175). This is the only prefecture whose median is not ¥0 but ¥300 (3.3%), meaning a majority of pairs carry some kind of gap. Its p90 gap rate of 25.0% is also the highest nationwide. Okinawa has a high share of resort properties, heavy package sales bundled with airfare and wide seasonal swings — a market where varying promotional intensity by platform has become established practice. Other regions with high resort and leisure shares show similarly low match rates: Chiba (59.1%), Yamanashi (68.2%) and Miyagi (61.1%), with p90 gaps of roughly ¥3,000, ¥3,100 and ¥3,500 respectively.
In the three major metropolitan areas, match rates are low — Tokyo at 59.2% (N=453) and Osaka at 64.1% (N=376) — but p90 gaps stay contained at roughly ¥2,400 and ¥1,700. Urban markets revise rates frequently, which produces many small gaps, yet the yen amounts remain restrained. The key point is that “not aligned” does not mean “loosely managed”; the shape of the gap simply differs by market. Rate levels also diverge sharply between municipalities within a single prefecture, a structure we set out in Intra-Prefecture ADR Gaps 2026: Median 2.74x, Okinawa Widest at 5.86x.
Saturdays widen, Wednesdays align — platform-level design bites hardest in strong demand
Comparing three Saturdays against three Wednesdays reveals a consistent difference in how gaps form. On Saturdays (N=3,497) the match rate is 69.2%, with a p75 gap of about ¥400 and p90 of about ¥2,300. On Wednesdays (N=5,533) the match rate is 72.1%, with p75 at ¥200 and p90 at about ¥1,400. On high-demand Saturdays, the match rate is about 3pt lower and the p90 gap roughly 1.7x wider.
The number of pairs formed on the same collection date is itself 1.6x higher on Wednesdays. Saturday inventory sells down, so cases where a room-only plan remains live on both platforms simultaneously become scarcer. How remaining inventory is presented, and on which platform — the stronger the demand, the more that judgment surfaces as a price gap.
| Group | Pairs | Match rate | Gap p75 | Gap p90 |
|---|---|---|---|---|
| Saturdays (Sep 12, Oct 10, Nov 14) | 3,497 | 69.2% | ¥420 | ¥2,304 |
| Wednesdays (Sep 16, Oct 14, Nov 18) | 5,533 | 72.1% | ¥200 | ¥1,363 |
Source: MetroEngines Research; compiled by the HotelBank Editorial Team
Gaps are design, not drift — in 93% of properties with gaps, the cheaper side is fixed
The analysis so far is pair-level. Re-examining at the property level allows a stronger statement. We aggregated match rates for the 1,081 properties that formed pairs on at least three of the six stay dates.
Source: MetroEngines Research; compiled by the HotelBank Editorial Team (1,081 properties forming pairs on 3 or more stay dates)
718 properties (66.4%) matched exactly on every stay date. Conversely, 213 properties (19.7%) showed a gap on every date. The middle ground (1–99%) accounts for only 150 properties, or 13.9%. Properties polarize into “always aligned” or “always differentiated”; they are not drifting at random from one day to the next.
More decisive still is direction. Among the 363 properties where gaps were observed, 338 (93.1%) had the same cheaper platform on every stay date. Only 25 properties (6.9%) saw the cheaper platform switch by date. Price gaps are best understood not as synchronization lag or random error but as an allocation the property deliberately maintains.
Looking at overall direction, of the 9,030 pairs, Platform A was cheaper in 11.9%, Platform B in 17.2%, and prices were equal in 71.0%. This is not a picture of one platform being unilaterally cheaper; which side to weight is decided property by property. That means no single winning formula has settled across the industry — and conversely, that room to design remains with the individual property. On how much of total room stock each property lists on booking platforms in the first place, see the measurements in Median 39.2% of Rooms Online — Allocation Across 12,941 Hotels.
Where the room for channel design actually lies
Pulling this together, the layers with large price gaps — the layers where freedom in channel design is actually being used — come down to three.
| Layer | Measured values | Design room this implies |
|---|---|---|
| High-rate band (¥40,000 and above) |
Gap p90 ¥13,200 / gap rate p90 22.8% Median gap when one occurs ¥6,600 |
The largest per-night monetary impact. The widest room to layer platform-specific benefits, and the same discount rate moves revenue far more. |
| Resort properties | Match rate 69.9% / gap p90 ¥4,000 Median gap when one occurs ¥2,100 (11.1%) |
Purpose of stay is clear and rates are high. Differentiating presentation to match each platform’s guest mix (families, couples, groups) works well here. |
| Peak-demand Saturdays | Match rate 69.2% / gap p90 ¥2,304 (about 1.7x Wednesdays) |
Gaps surface as inventory tightens. Which platform holds the last of the inventory feeds directly into average rate. |
Source: MetroEngines Research; compiled by the HotelBank Editorial Team
Conversely, ryokan (80.1% match rate) and regions above 75% such as Nagano, Kyoto and Tochigi are layers where aligned pricing is already established practice. Differentiating is not necessarily the right answer there. The number of room-only plans is small to begin with, and differentiation is already completed through non-price elements — meals, private baths, room types. Even so, the fact that the median gap, when one occurs, is a substantial ¥2,200 (11.1%) shows that the impact per discount is large, which suits a design that concentrates promotional spend into narrow windows.
On rate parity more broadly, a survey published in June 2019 by the youth division of the Japan Ryokan and Hotel Association (N=417) found that 94.7% of properties wanted to “set prices freely and offer products at compelling value”, while 63.3% said they had felt unable to offer compelling value because they could not set prices freely. The picture this study observes — 71% matching exactly, yet a fixed direction among properties that do differentiate — marks the present state of a debate continuous with that one.
Methodology and sources
This study is an independent analysis using advertised-price data for Japanese lodging properties collected by MetroEngines Research. To align comparison conditions, the population was constructed as follows.
| Item | Detail |
|---|---|
| Properties covered | Four property types — ryokan, resort hotels, business hotels and city hotels — with 10 or more guest rooms and currently operating. Only properties listed on both of the two major booking platforms (apple-to-apple condition). |
| Stay dates | Six dates in total: Saturday September 12, Wednesday September 16, Saturday October 10, Wednesday October 14, Saturday November 14 and Wednesday November 18, 2026. |
| Fixed sales conditions | 2 guests per room, room-only (no breakfast and no dinner), open for booking (plans that had closed as of the survey date were excluded), per-room price including tax. All combinations with mismatched meal conditions or occupancy were excluded. |
| Representative value | The lowest advertised price among qualifying plans, taken per property × stay date × platform. |
| Collection-date synchronization | Only pairs whose prices on both platforms were collected on the same date were used, eliminating apparent gaps caused by timing lags. Robustness checks loosening this to ±1 day and ±2 days were also run (conclusions unchanged). |
| Final sample | 9,030 pairs / 4,710 properties (±1 day: 17,048 pairs; ±2 days: 17,761 pairs). |
| Statistical treatment | Percentiles calculated by linear interpolation. Aggregation cells were published only where pairs numbered 150 or more (by prefecture) and 100 or more (by rate band). |
| Caveats | Property, stay date, meal conditions and occupancy are standardized, but room grade is not. Where the cheapest plan on each platform covers a different room type, that difference is included in the price gap reported here. The layer above a 30% gap rate (10.6% of pairs with a gap) is assumed to carry a mix of this factor. |
Source: MetroEngines Research; compiled by the HotelBank Editorial Team
⚠ Note on advertised prices for future dates: the September–November 2026 stay dates covered here all fall after the survey date (August 22, 2026). Advertised prices are revised as check-in approaches, and plans are added and withdrawn. The match rates and price gaps shown here are direct measurements based on a snapshot at the survey date, and readers should note that the figures shift closer to arrival.
Conclusion
Of the 9,030 pairs matched on property, stay date and sales conditions across two major booking platforms, 71.0% were identical. The median price gap was ¥0, and ¥300 at p75. The feeling that “prices differ by site” is, across the market as a whole, a minority phenomenon.
Nor is the 29.0% with gaps disorderly. Gap rates cluster around 5% and around 11%, consistent with a 5% or 10% discount sitting on one platform only. Keep the base rate aligned, then vary promotional allocation by platform — that is the shape most properties have adopted.
And among properties that do differentiate, the direction is fixed. Of the 363 properties with gaps among those observed on three or more dates, 93.1% had the same cheaper platform on every date. Price gaps are not synchronization lag or random error; they are the trace of a decision made by the property.
The layers with genuinely large room to design are three: the high-rate band (above ¥40,000, gap p90 ¥13,200), resort properties (gap p90 ¥4,000) and peak-demand Saturdays (1.7x Wednesdays). Conversely, ryokan and regions above a 75% match rate such as Nagano, Kyoto and Tochigi have completed their differentiation through non-price elements, and aligned pricing already works for them. Know which side your property sits on, then decide platform allocation deliberately — that is the practical implication this study supports.
Further Reading
- Booking Curves Across 47 Prefectures: +4.1pt Median Pickup from T-45
- December Listings 56–83% of August: Japan’s Winter Inventory Timing
- In-Room Dining Ryokan TOP 30: 58.3% Still Offer It, ADR +91%
- 226k Hotel Rooms in 32 Regional Cities: 42.7% Built Before 1996
- Median 39.2% of Rooms Online — Allocation Across 12,941 Hotels
- Do ¥100k+ Rooms Sell Last? Index 53 on Normal Saturdays, 24 at Obon
- Intra-Prefecture ADR Gaps 2026: Median 2.74x, Okinawa Widest at 5.86x
References and Sources
- MetroEngines Research — advertised-price data for Japanese lodging properties (independent analysis for this article: 9,030 pairs / 4,710 properties, as of August 22, 2026)
- “JFTC inspection of OTAs: Japan Ryokan and Hotel Association youth division survey finds 95% want free pricing” (Kanko Keizai Shimbun, June 10, 2019, N=417)
- Japan Tourism Agency, “Overnight Travel Statistics Survey”
- Japan Fair Trade Commission
■ Data source
Advertised-price data for Japanese lodging properties collected by MetroEngines Research (two major booking platforms, drawn from a tracked population of roughly 168,000 domestic properties). Coverage is four property types — ryokan, resort hotels, business hotels and city hotels — with 10 or more guest rooms, currently operating and listed on both platforms. The final sample is 9,030 pairs / 4,710 properties (as of August 22, 2026).
■ Calculation assumptions
Conditions were fixed to 2 guests per room, room-only (no breakfast and no dinner), open for booking, per-room price including tax, and the lowest advertised price per property × stay date × platform was taken as the representative value. Only pairs whose prices on both platforms were collected on the same date were used. Stay dates were three Saturdays and three Wednesdays across September–November 2026, six dates in total. Percentiles were calculated after extraction by linear interpolation (aggregation cells published only where pairs numbered 150 or more by prefecture and 100 or more by rate band).
■ Limitations and caveats
These are advertised prices, not actual transacted prices. Room grade is not standardized, so where the cheapest plan on each platform covers a different room type, that difference is included in the price gap (the layer above a 30% gap rate — 10.6% of pairs with a gap — is assumed to carry a mix of this factor). The stay dates covered are in the future relative to the survey date, and figures shift closer to arrival. Robustness checks loosening the collection-date condition to ±1 day and ±2 days produced match rates of 69.7% and 68.8%, leaving conclusions unchanged.