

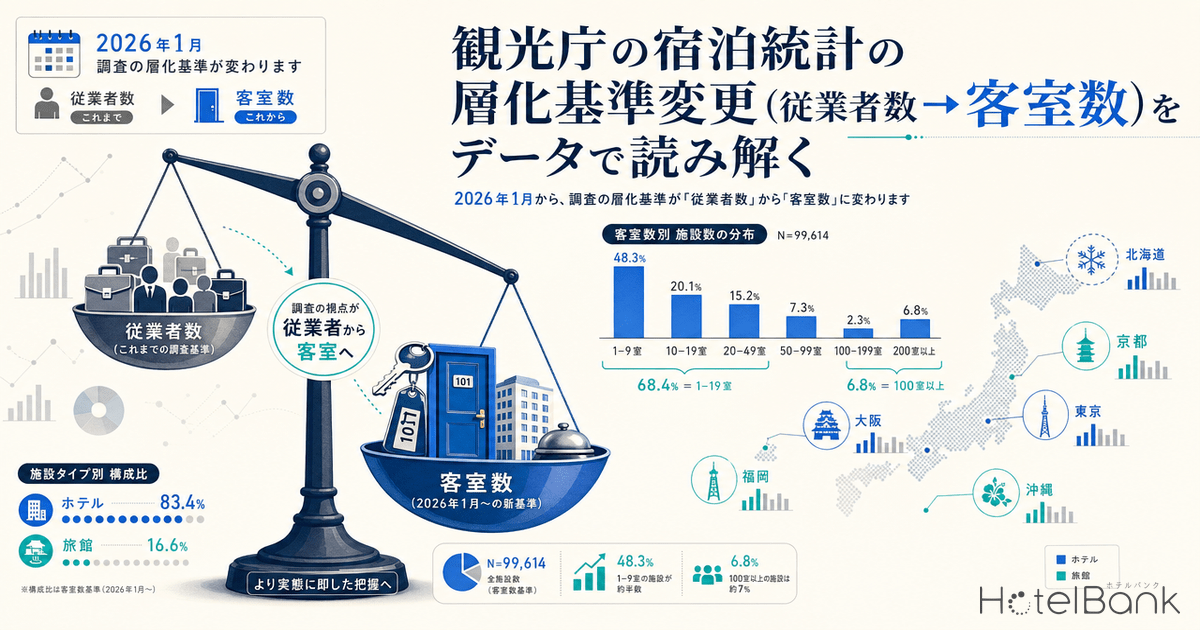

The Japan Tourism Agency (JTA) has announced that, beginning with the January 2026 (Reiwa 8) survey round, it will change the stratification variable for the Overnight Travel Statistics Survey from “number of employees” to “number of guest rooms”, with the stated aim of improving statistical accuracy. The agency officially notes that month-on-month year-over-year (YoY) comparisons “may include the effects of this revision” — a methodologically critical change with significant operational implications. This article first organizes the institutional background of JTA’s announcement, then uses MetroEngines Research’s nationwide population data on lodging facilities to visualize how the new “guest rooms” stratification axis actually divides the real distribution of hotels, and discusses how industry stakeholders should reinterpret future lodging statistics.
– “Stratification variable” refers to the variable used to divide a population into strata for sample selection. JTA used “number of employees” as the stratification variable through the December 2025 survey.
– OTA prices in this article are the average per-room rate (tax-included) for double-occupancy stays at the surveyed properties.
– OTA prices are “publicly listed selling prices,” which differ in nature from JTA’s lodging statistics (transaction values, actual guest counts). This article does not claim equivalence between the two.
– This article presents OTA population data as supplementary information for understanding how room count functions as a stratification variable. It is NOT an attempt to “estimate distortions in JTA statistics from our own data.”
1. JTA’s Announcement and Institutional Background
In its April 2026 release titled “Overnight Travel Statistics Survey (December 2025 Second Preliminary, January 2026 First Preliminary),” JTA explicitly stated the following note.
“In order to further improve statistical accuracy, we have conducted a review and changed the stratification variable from ‘number of employees’ to ‘number of guest rooms,’ starting with the January 2026 (Reiwa 8) survey. Please note that year-over-year (same-month) ratios and differences may include the effects of this revision.” (Source: JTA, “Overnight Travel Statistics Survey,” April 2026 release)
The Overnight Travel Statistics Survey is an official monthly government statistic conducted since 2007, covering hotels, ryokan, simple lodgings, and corporate/group accommodations licensed under the Hotel Business Act. Facilities with 10 or more employees are surveyed in full, while those with fewer than 10 employees are surveyed via stratified sampling. Three questionnaire formats have long been prepared by room count — “1-19 rooms,” “20-199 rooms,” and “200 rooms or more.” In other words, room count has always functioned as the axis for questionnaire classification, but the stratification axis for sample selection was “number of employees.”
The challenges of using number of employees as the stratification axis lie, first, in the weakening correspondence between “number of employees” and “facility scale” as labor-saving operations have advanced. With the spread of unmanned front desks, outsourced housekeeping, and hotel management agreements (HMA), even a 200-room city hotel can report widely varying employee counts depending on employment structure. Second, the penetration of foreign-brand and management contract (HMA) models has made employee counts increasingly inconsistent across facilities of similar scale. Room count is an immutable indicator of a facility’s physical supply capacity, and as a proxy for scale it is more stable than “number of employees.” JTA’s switch to room-count stratification is thought to reflect this aim of improving sample design robustness.
2. National Distribution of Lodging Facilities by Room Count
So how does the actual lodging facility population get divided when “room count” is used as the stratification variable? The chart below tabulates facility counts by room-count band based on MetroEngines Research’s proprietary database (N=99,614 facilities, room count disclosed only). Note that this represents facilities recorded in our proprietary database (sourced from OTAs, etc.), and not the JTA survey population itself.
Source: Compiled by MetroEngines Research and HotelBank Editorial Team (N=99,614 facilities, room count disclosed only)
The distribution shows clear features. First, on a facility-count basis, 48.3% of all facilities are concentrated in the “1-9 rooms” band, and “1-19 rooms” accounts for 68.4% of the total. This reflects the fact that small-scale lodging facilities — ryokan, minshuku, guesthouses — make up the bulk of Japan’s facility count. With the stratification axis switched to room count, the question of how to handle this extremely thick small-scale stratum becomes the core of sample design. Second, mid-to-large facilities of “100 rooms or more” account for only 6.8% of facility count, yet this stratum represents the bulk of room counts and overnight stays in JTA statistics. In short, the picture from a simple facility-count average and that from a room-count-weighted average differ substantially.
3. “Hotels” and “Ryokan” Have Inverted Scale Distributions
One reason time-series comparisons can be distorted under room-count stratification is that the shape of the scale distribution differs sharply by lodging type. The chart below extracts “hotels” and “ryokan” from our database and lays them out by scale band.
Source: Compiled by MetroEngines Research and HotelBank Editorial Team (Hotels N=8,253, Ryokan N=6,549)
For hotels, “100-199 rooms” (25.2%) and “50-99 rooms” (22.3%) form the peaks of the distribution, with large-scale facilities of 200+ rooms accounting for 12.8% of the total. For ryokan, by contrast, “10-19 rooms” (34.8%) and “20-49 rooms” (28.9%) form the core, while large ryokan with 200+ rooms account for just 0.6%. In other words, even when slicing by the same “room-count strata,” hotels are heavy in the large-scale band while ryokan are heavy in the small-to-medium band — exactly inverted shapes.
What does this mean? In the era when the stratification axis was “number of employees,” facilities with more staff were sampled more heavily within each stratum. A mid-scale hotel that adopted unmanned front desks would report low employee counts, and could end up grouped together with ryokan in the “low-employee stratum.” Under the new criterion (room count), strata are sliced by physical room count, so the scale distribution characteristics of each lodging type are reflected directly in the sample structure. In particular, small ryokan (1-19 rooms) and mid-sized business hotels (50-199 rooms) are likely to see substantial reshuffling between strata, and YoY comparisons in regions and lodging types heavily comprised of these strata may be especially susceptible to methodological noise.
4. Room-Count Distribution by Prefecture — “Stratum Bias” by Tourism Region
Another point under room-count stratification is the regional bias in distribution. Tourism regions with different characteristics show different room-scale distributions. The table below compares the share of facilities by room-count band across eight major prefectures.
| Prefecture | 1-19 rooms | 20-49 rooms | 50-99 rooms | 100-199 rooms | 200+ rooms | N |
|---|---|---|---|---|---|---|
| Kyoto | 82.0% | 9.4% | 3.4% | 3.6% | 1.6% | 4,772 |
| Okinawa | 82.9% | 9.3% | 3.3% | 2.6% | 1.9% | 4,334 |
| Hokkaido | 73.5% | 15.2% | 6.4% | 5.9% | 3.6% | 4,222 |
| Chiba | 70.4% | 16.0% | 5.0% | 4.8% | 3.8% | 2,135 |
| Kanagawa | 62.1% | 20.1% | 6.7% | 7.3% | 3.8% | 1,979 |
| Fukuoka | 54.8% | 22.0% | 9.3% | 10.0% | 6.8% | 1,515 |
| Tokyo | 53.4% | 21.6% | 11.5% | 15.4% | 9.0% | 3,702 |
| Osaka | 48.8% | 28.0% | 11.9% | 14.2% | 11.4% | 2,097 |
Source: Compiled by MetroEngines Research and HotelBank Editorial Team (proprietary database, room count disclosed only)
In Kyoto and Okinawa, more than 80% of facilities are concentrated in “1-19 rooms,” with machiya, condominiums, small ryokan, and pensions making up the core of the distribution. Osaka, by contrast, sees “1-19 rooms” shrink to 48.8%, while the combined share of “100+ rooms” reaches 25.6%. Tokyo similarly shows a 24.4% share for “100+ rooms.” Even when applying the same “room-count strata,” samples in Kyoto and Okinawa cluster densely in the small-scale band, while in Tokyo and Osaka they are dispersed across the mid-to-large bands — quite different structures.
This means that the impact of the stratification change is not uniform nationwide. In regions like Kyoto and Okinawa, where the small-scale stratum is extremely thick, sample sizes within strata are easier to secure even under the new criterion, but shifts in stratum weights are more likely to be reflected in apparent ADR or occupancy YoY changes. Conversely, in regions like Tokyo and Osaka with broader scale distributions, more strata mean higher precision per stratum, but linking to past data requires care.
5. Scale and Price Structure by Lodging Category
Another important angle for understanding room-count stratification is the relationship between scale and price by lodging category. The chart below organizes facility count and ADR (average public list price) for the major categories in our proprietary database.
Source: Compiled by MetroEngines Research and HotelBank Editorial Team (March 2026, average public list prices for surveyed facilities)
The most numerous categories are Business Hotels (7,194 facilities, ADR approx. ¥14,700) and Ryokan (6,239 facilities, ADR approx. ¥31,200), which together account for about 58% of all categories. On the other hand, Deluxe Hotels (190 facilities, ADR approx. ¥85,200) and Auberges (208 facilities, ADR approx. ¥66,900) are few in number but command ADRs more than three times the average. In other words, the “market picture” you get from a facility-count average and from a room-count-weighted average diverges substantially. By placing room count on the stratification axis, JTA moves closer to a design in which large hotels with many rooms are appropriately represented within strata. At the same time, the small-scale stratum, which accounts for 80% of the population on a facility-count basis, may see its relative weight decline.
6. Public List ADR for Major Cities and the Stratification Change — Issues for Time-Series Comparison
For reference, the chart below shows public list ADR and YoY change for major cities as of March 2026, just before the stratification change. Note again that this is OTA public list price data, not the transaction values and actual guest counts targeted by JTA statistics. We do not assert any causal relationship between OTA price trends and the stratification change.
Source: Compiled by MetroEngines Research and HotelBank Editorial Team (March 2026, average public list prices for surveyed facilities)
As of March 2026, public list ADR YoY changes in major cities were highest in Kyoto at +18.6%, followed by Tokyo +11.1%, Osaka +9.5%, Okinawa +8.5%, Hokkaido +7.5%, and Fukuoka +2.7%. For JTA’s lodging statistics (transaction-based, actuals), YoY comparisons from January 2026 onward are noted as potentially containing methodological effects due to the stratification change. OTA public list price data is not subject to this methodological change, but prices themselves are pre-sale signals of intent and cannot substitute for occupancy or transaction prices. When reading the two side by side, it is important to recognize that they are different in nature.
7. How Industry Stakeholders, Investors, and Hotel Operators Should Reinterpret the Data
Drawing on this change, here are five practical considerations for using lodging statistics in operations.
| Stakeholder | Reinterpretation Points |
|---|---|
| Hotel Operators | When using YoY comparisons from January 2026 onward as the basis for management decisions, separate absolute values (occupancy levels, total guest counts in absolute terms) from rates of change. Stratum composition shifts will be especially apparent in regions with many small ryokan and mid-sized business hotels. |
| Investors / REIT Analysts | When comparing REIT monthly operating data (held-property basis) with JTA statistics (whole-market basis), from 2026 onward you must isolate the effect of the stratification change. Individual REIT monthly results are unaffected by the methodology change and thus become more useful as a relative benchmark. |
| Market Researchers | For continuity with past time series, choose between treating December 2025 and earlier as a separate series from January 2026 onward, or waiting for JTA to publish reference values for linking. Cross-validation across multiple metrics (occupancy, ADR, total guest counts) becomes increasingly important. |
| Local Governments | When designing KPIs for tourism promotion, breaking the data down by room-count stratum is recommended. Regions with thick small-scale strata (Kyoto, Okinawa) will benefit more readily from the precision improvement under the new criterion, but ensuring continuity for past comparisons may require local correction. |
| Financial Institutions / Consultants | When using JTA statistics as a benchmark for property valuation or loan underwriting, referring directly to room-count-stratum figures (especially the “20-199 rooms” and “200+ rooms” questionnaire categories) minimizes the impact of the stratification change. |
Conclusion
The methodological revision JTA has introduced from the January Reiwa 8 (2026) survey — switching the stratification variable from number of employees to number of guest rooms — is a direct response to a long-standing concern about the robustness of sample design in lodging statistics. With unmanned front desks, management contracts, and labor efficiency advancing, number of employees has been losing its stability as a proxy for facility scale. The shift to room count, a physical and immutable indicator, is expected to enhance the long-term reliability of JTA statistics.
That said, interpreting data during the transition period (January-December 2026) requires practical care. In particular, in regions with high concentrations of small ryokan (Kyoto, Okinawa) and many mid-sized business hotels (Tokyo, Osaka), shifts in stratum composition will be readily reflected in apparent YoY comparisons. As shown in this article, the shape of scale distributions varies substantially by lodging type and region, so going forward looking at “stratum-level values” rather than “national averages” will become even more important.
Public list price data for surveyed facilities is no substitute for JTA statistics, but it is useful as supplementary information for understanding how the real lodging facility population is distributed along the new “room count” stratification axis. We hope this change will spur the industry to read lodging statistics from a more multifaceted perspective.