

“What were hotel rates in this area last year?” “Has the average rate in the trade area of a property we are evaluating gone up compared with two years ago?” When you want to look up past hotel rates, there are two conclusions to grasp first. First, there is no public statistic that lets you trace room rates themselves far back in time. The Japan Tourism Agency’s Overnight Travel Statistics Survey (宿泊旅行統計調査) is the longest-running lodging statistic, going back to 2007, but what it publishes is room occupancy, capacity occupancy and guest counts — not rates. Second, when you use a monthly rate series, you must not join the settled values of closed months and the estimates based on forward listed prices into a single line. Built around these two points, this article lays out, as a practical procedure, how to pull the public statistics (step by step on e-Stat), how to read a monthly ADR time series, a worked example using 24 months of actual data for Kanazawa, and the other available methods and their limits.
Metric Definitions Used in This Article
- ADR (Average Daily Rate): An estimated settled rate (tax-exclusive equivalent), calculated by applying segment-specific adjustment factors to the lowest-plan price level each property publishes on OTAs (per room, 2 guests per room, tax-inclusive). Checked against property-level results disclosed by listed hotel REITs (91 properties, most recent 3 months), the median error is about 7%. These are estimates and differ from each property’s actual transaction prices and accounting figures. Area-level ADR is the median across covered properties (the level of a typical property in the area). Referred to in the text as “estimated settled ADR.”
- Listed price (all-plan average, tax-inclusive): For published prices across all plans, from room-only to meal-inclusive (per room, 2 guests per room), the daily average is computed for each property, and the area median is averaged over the month. This is a separate metric from ADR.
- Room occupancy rate (Japan Tourism Agency): Rooms occupied ÷ rooms available, as published in the Japan Tourism Agency’s Overnight Travel Statistics Survey. Not a MetroEngines estimate.
- Data sources: MetroEngines Research; Japan Tourism Agency, Overnight Travel Statistics Survey
- — No public statistic publishes room rates. What the Japan Tourism Agency’s Overnight Travel Statistics Survey lets you trace back is occupancy and guest counts; tables up to July 2026 (first preliminary figures) can be downloaded from the “Files” section of e-Stat. Only the 2016 annual final tables can be filtered in the database format.
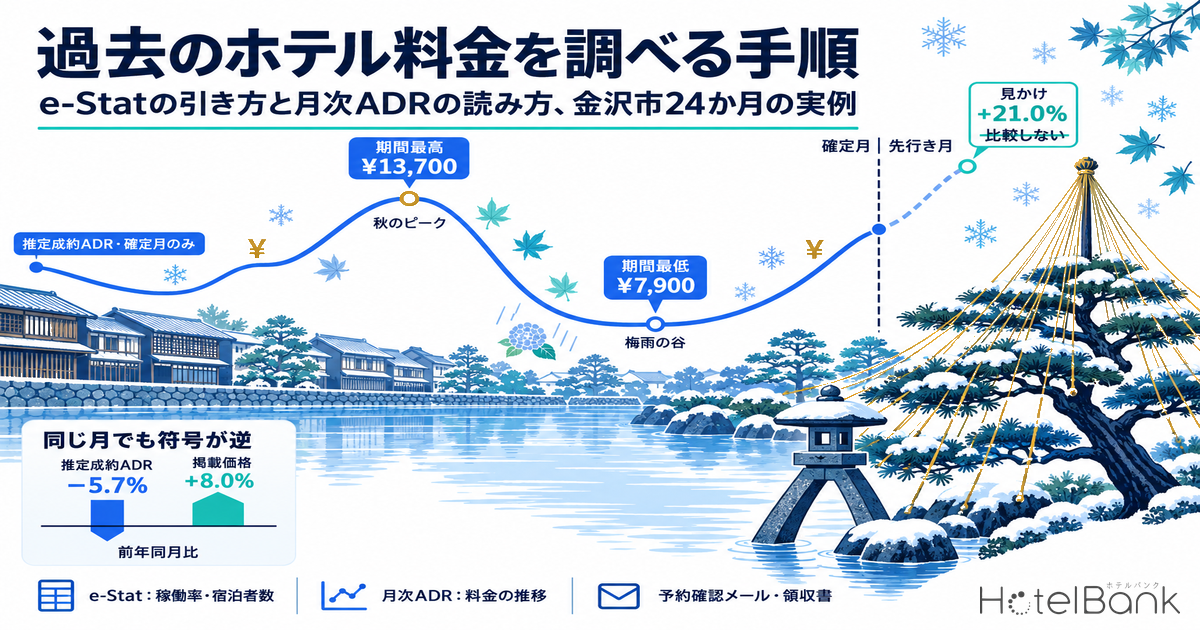
- — Build monthly rate trends from settled months only. Over 24 months (September 2024–August 2026), Kanazawa’s estimated settled ADR peaked at ¥13,700 in November 2025 and bottomed at ¥7,900 in June 2026. Comparing an estimate for a month that has not yet closed with the prior year makes December 2026 look like +21.0%, but the two are calculated on different bases and cannot be compared.
- — The same month can show opposite signs depending on the metric. In Kanazawa in August 2026, estimated settled ADR was −5.7% YoY while the listed price was +8.0%. The rise in the number of properties covered, from 233 to 298, is also moving the listed-price figure.
- — For the rate of a specific booking, the confirmation email and receipt are the primary records. Booking sites generally do not offer a way to search the prices sold for past dates.
- — The step at the seam is not unique to Kanazawa. In all eight cities — adding Toyama, Fukui, Takayama, Matsumoto, Hakodate, Nagasaki and Matsue — the apparent YoY over the next six forward months (average) exceeded the YoY of the latest three settled months (June–August 2026) by 7.2–41.3pt.
First Decide “Whose Rate, and Which Rate” — Primary Sources by Question
“Past hotel rates” can mean very different things, and the sources you need depend entirely on what you want to find out. Is it your own property’s results, a specific other property, or the going rate in an area? If you do not separate these at the outset, you can end up searching for sources that do not exist. The table below sets out, for each question, the source to check first, how far back it goes, and its limits.
| What you want to find | Source to check first | How far back | Limits and caveats |
|---|---|---|---|
| Your own property’s past selling rates and occupancy | PMS (property management system) records; rate-setting history in the channel manager | Since the system was introduced | History is sometimes not carried over when systems are migrated |
| The rate of one stay you booked yourself | Booking confirmation email; receipt or statement issued by the property | As long as you have kept them | Check post-booking changes and cancellation fees via separate notices or statements |
| Past selling prices of a specific other property | Property-level monthly disclosures by listed hotel REITs (owned properties only) | Since each REIT began disclosing | Most properties are not covered. Past-date prices on booking sites generally cannot be viewed |
| Strength of demand in an area (occupancy) | Japan Tourism Agency, Overnight Travel Statistics Survey | From 2007 | Rates are not published. Prefecture level only; no municipal breakdown |
| Trend in an area’s going rate | Monthly ADR aggregates based on OTA and other published prices (e.g., our estimated settled ADR) | From July 2019 | Estimates. Do not join settled and forward months. Accuracy is lower for March 2020–April 2022 |
Source: Compiled by HotelBank Editorial Team from published materials (as of September 28, 2026)
The main listed hotel REITs with monthly disclosures are seven: Ichigo Hotel REIT (いちごホテルリート投資法人, 3463), Invincible Investment (インヴィンシブル投資法人, 8963), Nippon Hotel & Residential Investment (日本ホテル&レジデンシャル投資法人, 3472), Japan Hotel REIT (ジャパン・ホテル・リート投資法人, 8985), Hoshino Resorts REIT (星野リゾート・リート投資法人, 3287), Mori Trust REIT (森トラストリート投資法人, 8961) and Kasumigaseki Hotel REIT (霞ヶ関ホテルリート投資法人, 401A). Whether portfolio-wide totals are published varies by REIT; some disclose only property-level figures. How to read REIT disclosures, and how the public sources compare — including the consumer price index (CPI) for accommodation — are covered in a separate HotelBank article, so this article focuses on the concrete steps for using the public statistics and on how to read a monthly ADR time series.
Tracing Back with Public Statistics — Pulling the Overnight Travel Statistics Survey on e-Stat
The Japan Tourism Agency’s Overnight Travel Statistics Survey compiles guest numbers and occupancy rates every month for lodging facilities nationwide, and can be traced back to 2007. Even if your goal is to look up rate trends, it is worth securing first as evidence of what demand looked like when rates rose. But to repeat: rates (room rates) are not among the published items. What this statistic tells you are “volume” indicators such as room occupancy, capacity occupancy, total guest nights and number of guests.
There are two places to get it: the Japan Tourism Agency website and e-Stat, the portal site for official statistics of Japan. The procedure on e-Stat is as follows.
| Step | Action | Notes |
|---|---|---|
| 1 | On e-Stat’s “Search for statistical data,” search for 宿泊旅行統計調査 (Overnight Travel Statistics Survey) and open the “Files” (ファイル) category | The only tables shown in the “Database” format are the 2016 annual final figures (32 tables); all other years are provided as files |
| 2 | Choose “annual final figures” (年確定値), “second preliminary figures” (第2次速報値) or “first preliminary figures” (第1次速報値), then the year (or the month, for preliminary figures) | As of September 28, 2026, the latest are: annual final figures for 2025, second preliminary figures for June 2026, first preliminary figures for July 2026 |
| 3 | Download the Excel file of “aggregated results” (集計結果) | The 2025 annual final figures come as a single file with 272 sheets |
| 4 | Find the table you need on the “statistical tables (contents)” (統計表(目次)) sheet and open the corresponding sheet | In the annual final figures, Table 2 = total guest nights, Table 6 = capacity occupancy, Table 8 = room occupancy. Each table has an annual-total sheet and sheets for January–December |
| 5 | Read values by row (facility location = 47 prefectures) and column (total, by number of employees, by facility type) | Facility types are six: ryokan, resort hotel, business hotel, city hotel, simple lodging (簡易宿所), and company/group lodging. Preliminary-figure files have a different table structure, so check the contents sheet |
Source: Compiled by HotelBank Editorial Team from the Japan Tourism Agency’s Overnight Travel Statistics Survey and e-Stat
For example, opening Table 8 (annual total) of the 2025 annual final figures shows Ishikawa Prefecture’s room occupancy at 57.1% (national: 61.6%), and by facility type 72.0% for business hotels, 69.7% for city hotels and 35.2% for ryokan. Going through the 12 monthly sheets lets you assemble the monthly trend as well.
When stitching a long time series together, watch for three breaks. The first is the expansion of survey coverage starting with the April–June 2010 survey (adding facilities with 9 or fewer employees); the Japan Tourism Agency itself cautions users about series that span this period. The second is the change in stratification criteria from January 2026 data (from number of employees to number of rooms). The third is revision between preliminary and final figures: the same month’s value can change by publication stage, and HotelBank’s measurements found preliminary figures revised by up to 3.4%. When building a time series, the rule is to align final figures with final figures, and preliminary figures with preliminary figures of the same stage.
Tracing Back Rates (ADR) — Three Rules for Reading a Monthly ADR Series
Since public statistics carry no rates, rate trends have to be filled in with data that aggregates prices published on OTAs and elsewhere. MetroEngines Research’s monthly ADR goes back to July 2019, and HotelBank articles use this data to show trends by area. But this kind of time series comes with reading conventions, and ignoring them easily leads to wrong conclusions. There are three points to keep in mind.
First, do not join “settled months” and “forward months” into a single line. For months whose stay dates have passed and closed (settled months), estimated settled ADR is calculated on a basis grounded in validated history. The current month and later months, by contrast, are estimates derived from a snapshot of selling prices listed on OTAs at the time of the survey. Forward-month values move as the stay date approaches, through price cuts and added plans, and once the month closes they are recalculated on the settled-month basis. Even though both are shown in the same unit (yen), they are calculated on different bases. Therefore, a YoY comparison of “last year’s settled value” against “this year’s forward value” does not hold. As of September 28, 2026, months through August 2026 are settled and September 2026 (the current month) onward are forward months; comparisons across this seam should be avoided.
Second, the listed price is an area “median,” neither an average nor a transaction price. The listed price is computed by taking each property’s daily average across all plans, from room-only to meal-inclusive, and then averaging the area median over the month. Unlike a mean, it is less pulled by a handful of ultra-high-priced properties, but because it includes unsold high-priced plans, it comes out higher than the rates actually sold. In Kanazawa, the listed price ran at 1.86–2.54 times the estimated settled ADR (over 24 months). Separate HotelBank analysis puts this listed-to-settled ratio at 1.7–2.9x across prefectures.
Third, check whether the number of properties covered (N) has changed. A median changes when the mix of properties in the aggregate changes, even if no individual property’s price moves. Always check the property count alongside the monthly values, and exclude months with a sudden jump or drop from before-and-after comparisons, or annotate them. Note also that during the COVID-19 period from March 2020 to April 2022, estimated settled ADR has been found to run higher than REIT-disclosed results, so for long-term comparisons that include this period it is safer to use the listed-price series alongside it.
Worked Example: Kanazawa’s Estimated Settled ADR over 24 Months
Let us now apply these rules to one city: Kanazawa, over the 24 months from September 2024 to August 2026. The period consists entirely of settled months and contains no forward months. Estimated settled ADR covers 112–122 properties (median of 118 across the 24 months), with no months of thin coverage.
Source: MetroEngines Research; compiled by HotelBank Editorial Team (Kanazawa, all segments, estimated settled ADR, settled months only. N=112–122 properties)
Overlaying the years makes the seasonal shape clear. In 2025, January–February was the trough at ¥8,200–8,400, rising to ¥10,700–11,100 in April–May, dipping to ¥8,300 in June, then peaking at ¥12,900 in October and ¥13,700 in November before falling back to ¥8,500 in December. The gap between 2025’s highest and lowest months was about 1.66x. September–December 2024 traced the same shape, showing that the autumn peak and the winter and rainy-season troughs are a pattern that repeats every year. To compare the size of seasonal swings with other cities, see Japan Hotel ADR Swings Up to 4.9x by Season: 633 Municipalities Ranked.
Next, look at the same 24 months in YoY terms. Here, YoY for both estimated settled ADR and the listed price are shown side by side.
Source: MetroEngines Research; compiled by HotelBank Editorial Team (Kanazawa, all segments, September 2025–August 2026; both the prior-year month and the current month are settled months)
From September 2025 to May 2026, estimated settled ADR was up YoY in 8 of 9 months (the only decline was −2.0% in December). Growth was especially strong in October 2025, at +9.9%, and April 2026, at +8.2%. From June to August 2026, however, it turned negative for three straight months, at −4.7%, −4.0% and −5.7%.
What cannot be overlooked is that for the same August 2026, the listed price’s YoY was +8.0% — the opposite sign. The listed price rose from ¥24,300 to ¥26,300, while estimated settled ADR fell from ¥11,200 to ¥10,600. The number of properties covered by the listed price rose from 240 in May 2026 to 284 in June, reaching 298 in August (233 in the same month a year earlier). Because a median moves when the mix of properties changes, the listed price’s YoY may include the effect of properties coming and going. The question “did rates go up or down?” must be answered together with which metric and which population you looked at. This article does not set out to identify the cause of this gap; it is presented purely as an example of how to read the data.
The monthly values and property counts for the 24 months are shown below. YoY figures are calculated from values where both the prior-year month and the current month are settled months.
| Month | Est. settled ADR | YoY | Properties | Listed price (all-plan avg.) | YoY | Properties |
|---|---|---|---|---|---|---|
| Sep 2024 | ¥9,570 | — | 120 | ¥21,501 | — | 239 |
| Oct 2024 | ¥11,695 | — | 121 | ¥23,380 | — | 239 |
| Nov 2024 | ¥12,692 | — | 122 | ¥24,431 | — | 236 |
| Dec 2024 | ¥8,712 | — | 119 | ¥19,584 | — | 231 |
| Jan 2025 | ¥8,364 | — | 118 | ¥19,200 | — | 231 |
| Feb 2025 | ¥8,247 | — | 119 | ¥19,096 | — | 231 |
| Mar 2025 | ¥9,480 | — | 121 | ¥20,774 | — | 234 |
| Apr 2025 | ¥10,721 | — | 122 | ¥22,946 | — | 240 |
| May 2025 | ¥11,134 | — | 122 | ¥23,389 | — | 239 |
| Jun 2025 | ¥8,327 | — | 122 | ¥19,588 | — | 237 |
| Jul 2025 | ¥9,053 | −9.9% | 120 | ¥21,100 | −1.0% | 234 |
| Aug 2025 | ¥11,228 | −1.5% | 119 | ¥24,323 | +4.3% | 233 |
| Sep 2025 | ¥10,240 | +7.0% | 118 | ¥21,902 | +1.9% | 231 |
| Oct 2025 | ¥12,852 | +9.9% | 118 | ¥24,960 | +6.8% | 236 |
| Nov 2025 | ¥13,679 | +7.8% | 112 | ¥25,462 | +4.2% | 234 |
| Dec 2025 | ¥8,535 | −2.0% | 113 | ¥21,142 | +8.0% | 233 |
| Jan 2026 | ¥8,408 | +0.5% | 116 | ¥19,871 | +3.5% | 232 |
| Feb 2026 | ¥8,748 | +6.1% | 118 | ¥20,179 | +5.7% | 236 |
| Mar 2026 | ¥9,896 | +4.4% | 118 | ¥23,535 | +13.3% | 240 |
| Apr 2026 | ¥11,600 | +8.2% | 117 | ¥24,827 | +8.2% | 239 |
| May 2026 | ¥11,528 | +3.5% | 116 | ¥25,479 | +8.9% | 240 |
| Jun 2026 | ¥7,938 | −4.7% | 115 | ¥20,123 | +2.7% | 284 |
| Jul 2026 | ¥8,694 | −4.0% | 116 | ¥21,043 | −0.3% | 294 |
| Aug 2026 | ¥10,590 | −5.7% | 116 | ¥26,273 | +8.0% | 298 |
Source: MetroEngines Research; compiled by HotelBank Editorial Team (Kanazawa, all segments. Estimated settled ADR is a tax-exclusive equivalent; listed price is per room for 2 guests, tax-inclusive)
Combining with public statistics lets you check rate movements from the demand side. The chart below overlays Kanazawa’s estimated settled ADR for 2025 with Ishikawa Prefecture’s room occupancy rate (final figures) published by the Japan Tourism Agency.
Source: Estimated settled ADR = MetroEngines Research (Kanazawa); room occupancy = Japan Tourism Agency, Overnight Travel Statistics Survey, 2025 (Reiwa 7) annual final figures, Table 8 (Ishikawa Prefecture, all facility types); compiled by HotelBank Editorial Team
Ishikawa’s room occupancy hit its annual low of 44.2% in January and its high of 67.4% in November, broadly coinciding with the trough (February) and peak (November) of Kanazawa’s estimated settled ADR. Months with high rates also had high occupancy, confirming that rates move up and down in line with the strength of demand. However, the occupancy rate is for Ishikawa Prefecture as a whole, not Kanazawa alone. Since municipal-level occupancy cannot be obtained from public statistics, this combination is best limited to “confirming direction.”
The Comparison Not to Make — Crossing the Seam Between Settled and Forward Months
Using the same Kanazawa data, here is what happens when a comparison crosses the seam. Values for September 2026 (the current month) onward are estimates based on listed prices at the time of the survey. Placing them next to the prior year’s settled values produces, as in the table below, large apparent increases of +4.3% to +21.0%.
| Target month | Forward estimate | Properties | Prior-year settled value | Apparent difference | Treatment |
|---|---|---|---|---|---|
| Sep 2026 (current month) | ¥10,682 | 115 | Sep 2025 ¥10,240 | +4.3% | Do not compare |
| Oct 2026 | ¥14,611 | 115 | Oct 2025 ¥12,852 | +13.7% | Do not compare |
| Nov 2026 | ¥16,241 | 113 | Nov 2025 ¥13,679 | +18.7% | Do not compare |
| Dec 2026 | ¥10,326 | 109 | Dec 2025 ¥8,535 | +21.0% | Do not compare |
| Jan 2027 | ¥9,149 | 101 | Jan 2026 ¥8,408 | +8.8% | Do not compare |
| Feb 2027 | ¥9,819 | 98 | Feb 2026 ¥8,748 | +12.2% | Do not compare |
Source: MetroEngines Research; compiled by HotelBank Editorial Team (Kanazawa, all segments; estimates based on listings as of September 28, 2026. Prior-year months are settled months)
Reading this gap as “rates this autumn and winter are 20% higher” is wrong. Forward-month values include selling prices that have not yet been cut and settings that have not yet made their last-minute moves. Settled-month values are calculated on a basis that reflects actual conditions in months whose stay dates have passed and closed. Even in the same yen terms, they measure different things, so most of the gap is likely to stem from the difference in basis. In addition, the further out the month, the fewer properties the estimate covers (115 in September 2026 versus 98 in February 2027). Forward months can be compared with one another to contrast listing conditions at the same point in time, but writing them up in articles or materials as YoY against settled months should be avoided.
A common pitfall in practice is building an annual trend chart that joins settled and forward months in the same line without distinguishing them. Only the right end of the chart suddenly jumps up, making it look as if rates are surging right now. When building a monthly chart, draw the line with settled months only; if you include forward months, split the line and state clearly that they are “estimates based on listing levels at the time of the survey.” That is the minimum standard.
Is It the Same in Other Cities? Comparing the Seam Step Across Eight Cities
To check whether the phenomenon seen in Kanazawa — growth looking large once you cross the seam — is specific to this city, we added seven cities under the same conditions: Toyama and Fukui in Hokuriku, plus Takayama, Matsumoto, Matsue, Hakodate and Nagasaki, which likewise depend heavily on tourism demand. In each case, months through August 2026 are settled and September onward are forward months, and the estimated settled ADR for the next six forward months is set against the prior year’s settled values (Table 5). As a yardstick, we use the average YoY of the latest three settled months just before the seam (June–August 2026).
| City | Est. settled ADR properties (24 settled months) | Avg. YoY, latest 3 settled months (Jun–Aug 2026) | Sep 2026 | Oct | Nov | Dec | Jan 2027 | Feb | Forward 6-month avg. − latest 3 settled months |
|---|---|---|---|---|---|---|---|---|---|
| Kanazawa | 112–122 | −4.8% | +4.3% | +13.7% | +18.7% | +21.0% | +8.8% | +12.2% | +17.9pt |
| Toyama | 53–59 | +8.6% | +58.7% | +51.0% | +40.1% | +48.8% | +48.7% | +52.6% | +41.3pt |
| Fukui | 35–38 | +12.4% | +30.1% | +42.5% | +31.5% | +38.1% | +28.0% | +38.5% | +22.4pt |
| Takayama | 119–142 | −5.4% | +7.4% | +8.3% | +11.9% | +7.6% | +1.0% | +9.8% | +13.1pt |
| Matsumoto | 91–109 | −6.4% | +3.4% | +8.4% | −3.4% | −7.0% | +2.5% | +1.0% | +7.2pt |
| Matsue | 51–56 | −1.1% | +18.8% | +21.9% | +5.3% | −6.2% | −2.6% | +38.6% | +13.7pt |
| Hakodate | 80–88 | −7.6% | +4.2% | +16.8% | +2.8% | +19.1% | +24.5% | +49.9% | +27.1pt |
| Nagasaki | 62–65 | −18.8% | −7.3% | +30.6% | +11.1% | +14.2% | +15.8% | +27.4% | +34.1pt |
Source: MetroEngines Research; compiled by HotelBank Editorial Team (each city, all segments, estimated settled ADR. September 2026 onward are estimates based on listings as of September 28, 2026; prior-year months are settled. Shaded cells exceed the YoY of the latest three settled months)
In all eight cities, the average apparent YoY over the next six forward months exceeded the YoY of the latest three settled months. The gap ranged from +7.2pt in Matsumoto to +41.3pt in Toyama, and 45 of the 48 cells (8 cities × 6 months) exceeded the level of the latest three settled months. Even in Hakodate (−7.6%) and Nagasaki (−18.8%), where settled months had shown continued year-on-year declines, “growth” of +19.5% and +15.3% on average appears once you move into forward months. Rather than reading this as a sudden reversal in near-term demand, it is more natural to read it as a step caused by the different calculation bases for settled and forward months, appearing upward regardless of city. The size of the step differs by city and varies from month to month, so forward-month values cannot be restated to the settled-month level with a uniform correction factor either. Note also that in cities with small coverage, such as Fukui (35–38 properties) and Toyama (53–59 properties), even a single property’s pricing can move the value.
The phenomenon of YoY signs flipping depending on the metric is not limited to Kanazawa either. In August 2026, four of the eight cities — Kanazawa, Takayama, Matsumoto and Matsue — showed split signs, with estimated settled ADR negative and the listed price positive (Table 6). The number of properties covered by the listed price increased year on year in all eight cities, rising by 6–47 properties in the single month from May to June 2026. When reading listed-price YoY, you need to check whether the comparison spans this period and interpret it together with the change in property counts.
| City | Est. settled ADR YoY (Aug 2026) | Listed price YoY (Aug 2026) | Sign | Listed-price properties (Aug 2025→Aug 2026) | Listed-price properties (May→Jun 2026) |
|---|---|---|---|---|---|
| Kanazawa | −5.7% | +8.0% | Opposite | 233→298 | 240→284 (+44) |
| Toyama | +13.7% | +10.7% | Same | 75→85 | 78→84 (+6) |
| Fukui | +11.3% | +7.8% | Same | 53→63 | 52→60 (+8) |
| Takayama | −2.4% | +4.0% | Opposite | 230→297 | 248→295 (+47) |
| Matsumoto | −7.2% | +0.1% | Opposite | 151→192 | 164→191 (+27) |
| Matsue | −9.3% | +2.6% | Opposite | 81→101 | 89→97 (+8) |
| Hakodate | −11.9% | −4.9% | Same | 135→174 | 154→169 (+15) |
| Nagasaki | −15.4% | −14.5% | Same | 115→139 | 119→134 (+15) |
Source: MetroEngines Research; compiled by HotelBank Editorial Team (each city, all segments. Both prior-year and current months are settled. Estimated settled ADR is a tax-exclusive equivalent; listed price is per room for 2 guests, tax-inclusive)
Other Methods and Their Limits — Booking-Site Rates Cannot Be Traced Back
Finally, here are the methods other than public statistics and monthly ADR. The first thing many people try is searching a booking site with a past date. But booking-site search is built on the assumption that the stay date is today or later, and a function for searching or viewing selling prices for past stay dates is generally not offered. Selling prices change daily and by plan, and there is no mechanism that stores and publishes past displays, so within publicly available information there are few ways to reconstruct accurately, after the fact, what a given hotel was selling for around this time last year.
On the other hand, if you want to confirm the rate of one specific booking, things are simple. For expense claims, or for disputes over rates with a property or booking operator, the booking confirmation email you received at the time of booking and the receipt or folio issued by the property are the primary records. A confirmation email typically states the rate, plan name, number of guests and cancellation policy agreed at the time of booking, and serves as evidence of the terms at the time of booking even if the displayed price has since changed. If you are claiming an input tax credit through expense reimbursement in Japan, also check the requirements for a qualified invoice issued by the property. If you have deleted the email, you may be able to confirm the amount and date from the booking history on the member page of the site you booked through, or from your credit card statement.
For hotel operators checking their own past rates, PMS records and the channel manager’s rate-setting history are the most reliable sources. To understand competitors’ past selling prices, a paid service that records prices daily can be a means, if you have one in place. However, records exist only for the period since adoption, so it is of no use unless recording started before the point you want to look back to. If an official website’s rate page has been saved in a web archive, you may be able to check the displayed price at a specific point in time, but this is only a single-point fragment and is not suited to tracking trends.
Frequently Asked Questions
Q. Can the Japan Tourism Agency’s statistics tell me past hotel rates?
A. No. The Overnight Travel Statistics Survey publishes room occupancy, capacity occupancy, guest counts and the like, but not rates. Rate trends need to be filled in with data aggregating OTA and other published prices, or with REIT disclosures.
Q. Why can’t I filter the display on e-Stat?
A. Database-format tables for the Overnight Travel Statistics Survey are limited to the 2016 annual final figures. For 2017 onward and for monthly preliminary figures, download the Excel files from “Files” and read them.
Q. Can I compare this month’s or next month’s estimated ADR with the same month last year?
A. Avoid it, because it would compare a settled month with a forward month. Forward-month values are estimates based on listed prices at the time of the survey and are recalculated on the settled-month basis once the month closes. If you compare, compare settled months with settled months.
Q. I want to check the rate I paid at a hotel last year. Where do I look?
A. Check your booking confirmation email, the receipt or folio, the booking history on the site you booked through, and your credit card statement. Searching booking sites for selling prices on past dates is generally not possible.
Q. Does the step between settled and forward months occur outside Kanazawa too?
A. Yes. In all eight cities, adding Toyama, Fukui, Takayama, Matsumoto, Matsue, Hakodate and Nagasaki, the apparent YoY (average) for September 2026–February 2027 exceeded the YoY of the latest three settled months (June–August 2026) by 7.2–41.3pt. Because the size of the step varies by city and month, a uniform correction is not possible either.
Q. Can public statistics tell me room occupancy at the municipal level?
A. The Overnight Travel Statistics Survey is published at the prefecture level, with no municipal room occupancy. In this article’s Kanazawa example, too, what we combined was Ishikawa Prefecture’s overall occupancy, used only to check whether rate movements and the direction of demand line up.
Summary
When looking up past hotel rates, the starting point is deciding “whose rate, and which rate.” Area demand can be traced back to 2007 with the Japan Tourism Agency’s Overnight Travel Statistics Survey, but rates are not included. On e-Stat, download the Excel files of annual final and preliminary figures from “Files,” check the table numbers on the contents sheet, and read the values. Trends in going rates are filled in with a monthly ADR time series, but three rules must be observed: do not join settled and forward months, remember that the listed price is an area median, and check for changes in property counts. In the Kanazawa example, the 24-month trend built from settled months alone showed clear seasonality, with an autumn peak and troughs in winter and the rainy season, while a comparison crossing the seam produced a “+21.0%” increase with no basis in reality. This step appeared in the same direction in seven other cities, including Toyama, Fukui and Takayama, so the principle of drawing the line with settled months only applies regardless of city. For the rate of a specific booking, the confirmation email and receipt are the most reliable records.
⚠ Note on ADR for future dates: The September 2026–February 2027 values shown in this article as “forward estimates” are based on selling prices published on OTAs at the time of the survey (September 28, 2026) and will change as check-in dates approach. Please note that prices currently set high may fall with last-minute discounts. This article does not use these values for comparison with prior-year settled values.
Related Articles
| What Is Hotel ADR? Settled Rates 34-57% of Listed Prices, 2026 |
References and Sources
■ Data Sources
Monthly rate trends are MetroEngines Research’s city-level monthly aggregates (all segments). Estimated settled ADR is the area median of estimates obtained by multiplying each property’s lowest-plan price level by segment-specific factors; the listed price is the monthly average of the area median of all-plan daily averages. Both are values as of September 28, 2026. Coverage: Kanazawa (July 2024–February 2027) and, for comparison, Toyama, Fukui, Takayama, Matsumoto, Matsue, Hakodate and Nagasaki (same period). Demand side: Japan Tourism Agency, Overnight Travel Statistics Survey, 2025 (Reiwa 7) annual final figures, Table 8 (room occupancy, Ishikawa Prefecture, annual total and January–December).
■ Calculation Assumptions
YoY is current month ÷ prior-year month − 1, calculated from unrounded values rather than displayed values. “Settled months” are months whose stay dates have passed and closed (through August 2026); “forward months” are September 2026 onward. In Table 5, “latest 3 settled months” is the simple average of YoY for June–August 2026, and “forward 6-month average” is the simple average of apparent YoY for September 2026–February 2027. The listed price ÷ estimated settled ADR ratio (1.86–2.54x) is the minimum and maximum of the monthly ratios over Kanazawa’s 24 settled months.
■ Limitations and Caveats
Estimated settled ADR is an estimate; checked against results disclosed by listed hotel REITs, the median error is about 7%. Forward-month values are based on listings at the time of the survey and are recalculated on the settled-month basis once the month closes. The further out the month, the fewer properties the estimate covers (Kanazawa: from 115 in September 2026 to 98 in February 2027). The number of properties covered by the listed price increased in June 2026 in all eight cities compared, so listed-price YoY spanning this period may include the effect of properties coming and going. Values for cities with fewer than 60 covered properties, such as Fukui and Toyama, tend to swing. Room occupancy is published at the prefecture level, with no municipal values. Because estimated settled ADR tends to run high for March 2020–April 2022, that period is not included in this article’s comparisons.
■ References
- Japan Tourism Agency, “Overnight Travel Statistics Survey” (宿泊旅行統計調査) (survey overview, 2010 coverage expansion, change in stratification criteria from January 2026 data)
- e-Stat, Portal Site of Official Statistics of Japan: “Overnight Travel Statistics Survey” file list
- e-Stat: “Overnight Travel Statistics Survey (annual final figures) 2025,” aggregated results (Table 8, room occupancy)
- National Tax Agency, “About the Qualified Invoice System” (インボイス制度について)
- MetroEngines Research — Kanazawa estimated settled ADR and listed price (monthly, September 2024–February 2027, as of September 28, 2026), and the same series for the 7 comparison cities (Toyama, Fukui, Takayama, Matsumoto, Matsue, Hakodate, Nagasaki)