

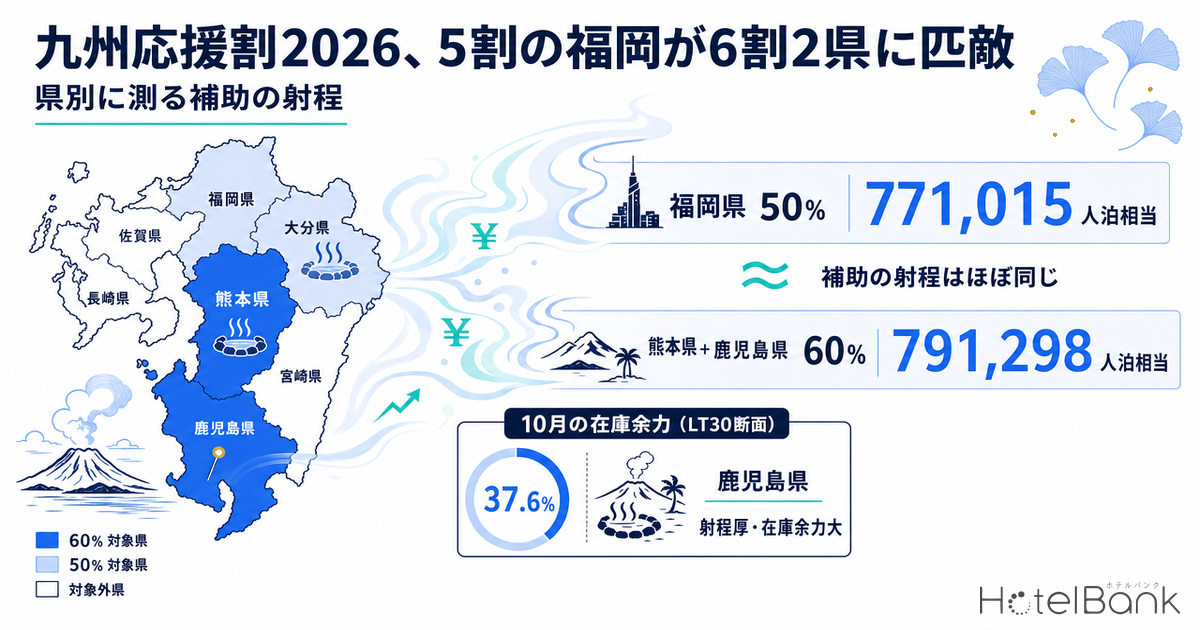
The Kyushu Recovery Support Subsidy (九州ふっこう応援割), announced on 28 August 2026, covers 60% of travel and accommodation charges in Kumamoto and Kagoshima and 50% in the five prefectures of Fukuoka, Saga, Nagasaki, Oita and Miyazaki, rolling out in stages from stays on 1 October. The debate inevitably gravitates toward the headline rate — 60% or 50% — but from a hotel’s perspective the rate is only half the story. How many guest nights that rate can attach to — the size of the denominator — matters just as much.
This article pulls Japanese guest nights by prefecture and month from the Japan Tourism Agency’s Accommodation Survey (宿泊旅行統計調査), weights them by each prefecture’s subsidy rate, and re-ranks the seven prefectures by the resulting “subsidy reach.” Note that the scope of eligible travellers — specifically whether inbound visitors are included — had not been published as of writing. The Japan Tourism Agency’s disaster-information page carries no statement on residency requirements or the treatment of foreign travellers. Both cases are presented side by side below; neither is assumed.
- — Subsidy-weighted guest nights across the seven prefectures total 2,410,538 equivalent guest nights. Fukuoka, at 50%, leads all single prefectures with 771,015 — almost matching the combined 791,298 of 60%-rate Kumamoto and Kagoshima.
- — The Japanese share of guest nights spans 25.3 points, from 67.1% in Fukuoka to 92.4% in Miyazaki. At the same discount rate, the depth of the base the subsidy can attach to differs sharply by prefecture.
- — Kagoshima is the one prefecture combining deep reach with open inventory: reach per room of 33.6 and estimated OCC of 37.6% at the LT30 cross-section (14-day average for check-ins 1–14 October 2026). Fukuoka, with the largest reach, is already 67.0% sold.
- — Whether inbound visitors are eligible had not been published as of writing. If they are, roughly 680,000 equivalent guest nights are added; if not, 1,305,610 guest nights sit outside the programme.
Metric Definitions Used in This Article
- Guest nights: aggregate figures from the Japan Tourism Agency’s Accommodation Survey, counted as guests × nights stayed. Japanese guest nights are derived as total guest nights minus foreign guest nights.
- Subsidy-weighted guest nights (the “reach” used here): Japanese guest nights × that prefecture’s subsidy rate. It is a way of comparing the size of demand a subsidy can attach to, combining both rate and volume. It is not a budget-consumption figure or a record of actual usage.
- ADR (average daily rate): an estimated settled rate (tax-exclusive equivalent) derived by applying category-specific adjustment coefficients to the lowest published plan level each property lists on OTAs and elsewhere (double occupancy, per-room rate, tax-inclusive). Cross-checked against property-level results disclosed by listed hotel REITs (91 properties, most recent three months), the median error is roughly 7%. These are estimates and differ from each property’s actual transacted rates and accounting figures. Area-level ADR is the median of the properties covered (the level of a typical property in the area).
- OCC (occupancy): rooms sold as a share of total rooms in the area (an estimate based on inventory listed on OTAs). It reflects how listed OTA inventory is being absorbed and differs from a property’s true overall occupancy.
- LT (lead time): days remaining until check-in. LT0 is same-day. All inventory comparisons in this article are made at an identical LT cross-section.
- Data sources: Japan Tourism Agency, Accommodation Survey / MetroEngines Research
The ¥20,000 cap barely touches Kyushu’s price range
Start with the shape of the programme. Per the Japan Tourism Agency’s announcement, the subsidy rate is 60% for Kumamoto and Kagoshima and 50% for the other five prefectures. The cap is ¥20,000 for accommodation-only products and for one-night packages including transport, ¥30,000 for transport-inclusive packages of two nights or more, and ¥35,000 for multi-prefecture touring products spanning two or more prefectures. Coverage applies to stays from 1 October 2026 onward, with each prefecture setting its own eligible period and booking-open date.
One practical reading follows immediately. The ¥20,000 cap only starts to bind above a trip price of roughly ¥33,000 at a 60% rate, or ¥40,000 at 50%. Meanwhile, estimated settled ADR for October 2025 across the seven prefectures runs from ¥6,500 in Kagoshima to ¥14,600 in Oita (N=7 prefectures; 147–466 properties covered per prefecture). In other words, for the great majority of accommodation-only products it is the subsidy rate itself, not the cap, that determines the effect. The cap enters the picture only for higher-priced properties, multi-night stays and transport-inclusive packages — this is a market where the rate differential passes through cleanly. The price band at which the ¥20,000 cap starts to bite was covered when the programme design was confirmed, in Kyushu Recovery Subsidy Set: 60%/50% Split, ¥20,000 Cap Hits Top 10%.
The base the subsidy reaches — the Japanese share spans 67.1% to 92.4%
Now the denominator. Taking October out of the Japan Tourism Agency’s Accommodation Survey for January–December 2025 (annual confirmed figures), the seven prefectures recorded 5,862,920 total guest nights, of which 1,305,610 were foreign and 4,557,310 Japanese — a Japanese share of 77.7%. That average, however, smooths over a great deal of prefecture-level variation.
Broken out by prefecture, the highest Japanese share is Miyazaki at 92.4%, followed by Kagoshima at 90.1%, Nagasaki at 89.3% and Saga at 88.0%. Oita (78.0%) and Kumamoto (77.4%) come next, and Fukuoka is lowest at 67.1%. A third of Fukuoka’s October accommodation demand (32.9%) is foreign, against just 7.6% in Miyazaki. Apply the same programme to both, and the share of the total market that the subsidy can reach differs by that much.
Source: Japan Tourism Agency, Accommodation Survey, January–December 2025 (annual confirmed figures), October data; compiled by the HotelBank Editorial Team
This composition is not a one-month accident. For January–June 2026 (second preliminary figures) the ordering is essentially unchanged: Miyazaki 92.8%, Kagoshima 90.1%, Saga 87.5%, Nagasaki 87.9%, Kumamoto 78.7%, Oita 76.4%, Fukuoka 61.8%. Preliminary figures are revised later, so the levels themselves may move, but the rank order between prefectures is stable.
| Prefecture | Rate | Guest nights | Japanese | Japanese share | Foreign | Foreign share |
|---|---|---|---|---|---|---|
| Fukuoka | 50% | 2,299,820 | 1,542,030 | 67.1% | 757,790 | 32.9% |
| Kagoshima | 60% | 744,400 | 670,390 | 90.1% | 74,010 | 9.9% |
| Kumamoto | 60% | 837,470 | 648,440 | 77.4% | 189,030 | 22.6% |
| Nagasaki | 50% | 728,100 | 650,140 | 89.3% | 77,960 | 10.7% |
| Oita | 50% | 717,510 | 559,900 | 78.0% | 157,610 | 22.0% |
| Miyazaki | 50% | 344,360 | 318,120 | 92.4% | 26,240 | 7.6% |
| Saga | 50% | 191,260 | 168,290 | 88.0% | 22,970 | 12.0% |
| Seven-prefecture total | — | 5,862,920 | 4,557,310 | 77.7% | 1,305,610 | 22.3% |
Unit: guest nights. Source: Japan Tourism Agency, Accommodation Survey, October 2025 (annual confirmed figures); compiled by the HotelBank Editorial Team
Ranked by reach, 50% Fukuoka alone matches the two 60% prefectures combined
Multiply rate by volume. Applying each prefecture’s subsidy rate to its Japanese guest nights gives subsidy-weighted guest nights of 2,410,538 across the seven prefectures. The prefecture ranking does not follow the ranking of subsidy rates.
Fukuoka leads at 771,015 equivalent guest nights (32.0% of the total). Its rate is 50%, but a base of 1.54 million Japanese guest nights more than compensates. Kagoshima is second at 402,234 (16.7%) and Kumamoto third at 389,064 (16.1%) — meaning the two 60% prefectures together come to 791,298 equivalent guest nights, nearly the same scale as Fukuoka alone at 771,015. Two high-rate prefectures combined sit level with one low-rate prefecture.
A second divergence shows up between Nagasaki and Kumamoto. Nagasaki is at 50%, but with a Japanese share of 89.3% its reach comes to 325,070 equivalent guest nights — 83.6% of 60%-rate Kumamoto’s 389,064. A 10-point rate gap is largely offset by an 11.9-point gap in Japanese share. Put the other way, Kumamoto has the second-highest foreign share among the seven prefectures (22.6%, behind Fukuoka), so its 60% rate applies to a narrower slice of the total market than Kagoshima’s does (foreign share 9.9%).
Source: Japan Tourism Agency, Accommodation Survey, October 2025 (annual confirmed figures); compiled by the HotelBank Editorial Team
A check against an alternative basis — substituting the January–June 2026 Japanese share
To test whether this ordering depends on the single-month composition of October 2025, reach was recalculated using the same October 2025 guest-night volumes but substituting the Japanese share with the January–June 2026 level (second preliminary figures).
| Prefecture | Base (Oct 2025 share) | Alternative (Jan–Jun 2026 share) | Difference |
|---|---|---|---|
| Fukuoka | 771,015 | 710,644 | −60,371 |
| Kagoshima | 402,234 | 402,423 | +189 |
| Kumamoto | 389,064 | 395,453 | +6,389 |
| Nagasaki | 325,070 | 320,000 | −5,070 |
| Oita | 279,950 | 274,089 | −5,861 |
| Miyazaki | 159,060 | 159,783 | +723 |
| Saga | 84,145 | 83,676 | −469 |
| Seven-prefecture total | 2,410,538 | 2,346,068 | −64,470 |
Unit: equivalent guest nights. Guest-night volumes are October 2025 (annual confirmed figures); the Japanese share in the alternative column is January–June 2026 (second preliminary figures). Source: Japan Tourism Agency, Accommodation Survey; compiled by the HotelBank Editorial Team
The ranking of the seven prefectures does not change between the two bases. Fukuoka still leads among single prefectures, followed by Kagoshima, Kumamoto and Nagasaki. What does change is the distance between Fukuoka and the two 60% prefectures combined. On the base measure it was 97.4% (771,015 against 791,298); on the alternative it widens to 89.1% (710,644 against 797,876). That is the direct effect of Fukuoka’s Japanese share falling from 67.1% to 61.8%. The Nagasaki–Kumamoto relationship narrows likewise, from 83.6% to 80.9%.
So the reading that “50% Fukuoka matches the two 60% prefectures” moves within a band of roughly 90% to just under 100%, depending on the share basis. The ordering and the structure are robust, but the size of the gap depends on which period the Japanese share is taken from — in practice it is safer to substitute your own prefecture’s and property’s recent results. And since preliminary figures are revised later, the alternative column is best treated as a directional check.
How full is October inventory right now (LT45–LT30 cross-sections)
Reach measures the size of demand; it says nothing about how much room is left to receive it. For that, internal data on October inventory progression. Estimated OCC for the 14 days of check-ins from 1 to 14 October 2026 was compared across the seven prefectures, averaged at identical lead-time cross-sections (a fixed cohort of properties listing at least 30% of total rooms on OTAs; 2,167 properties and 88,874 rooms across the seven prefectures, with 132–431 properties observed at each LT).
At the LT30 cross-section, estimated OCC is 67.0% in Fukuoka, 66.9% in Nagasaki, 65.5% in Kumamoto, 62.8% in Oita, 62.6% in Saga, 54.9% in Miyazaki and 37.6% in Kagoshima. Fukuoka, with the largest reach, is also the tightest prefecture on inventory. Kagoshima, second on reach, is the only one of the seven still in the 30s, with 104,665 unsold room nights across the 14 days. Kagoshima is therefore the prefecture where depth of reach and slack inventory coincide.
Absorption speed between LT45 and LT30 also differs. Kumamoto moves from 55.5% to 65.5% — 10.0 points in 15 days, the fastest of the seven. Fukuoka follows at 59.2% to 67.0% (+7.8pt) and Kagoshima at 30.6% to 37.6% (+7.0pt). Nagasaki goes from 63.3% to 66.9% (+3.6pt), already high early on and building gradually from there. Where the seven prefectures’ unsold rooms are concentrated was measured earlier in Kyushu Subsidy: Kumamoto & Kagoshima Hold 34.9% of Oct Unsold Rooms.
14-day average for check-ins 1–14 October 2026. Source: MetroEngines Research; compiled by the HotelBank Editorial Team
The seven prefectures reframed: reach × inventory slack
To compare prefectures of differing supply size, divide subsidy-weighted guest nights by OTA-listed room count to get reach per room. Kagoshima is deepest at 33.6, followed by Nagasaki 28.5, Kumamoto 27.8, Fukuoka 26.1, Oita 25.7, Miyazaki 23.5 and Saga 19.5. Fukuoka leads on absolute volume but settles mid-pack once divided by the depth of supply.
Combined with estimated OCC at the LT30 cross-section on the vertical axis, the seven prefectures fall into three groupings. Kagoshima, at lower right, has deep reach and open inventory — the position with the most room for the programme to draw genuinely new bookings. Fukuoka, Nagasaki and Kumamoto, at upper left and upper centre, have reach but are already past 60% sold, so for them the programme is more a question of how the remaining third gets allocated. Miyazaki, Saga and Oita sit in between: Miyazaki has comparatively more inventory slack, while Saga’s smaller reach and supply make the per-property impact easier to read.
Source: Japan Tourism Agency, Accommodation Survey / MetroEngines Research; compiled by the HotelBank Editorial Team
| Prefecture | Rate | Subsidy-weighted guest nights | Share | Reach per room | Est. OCC (LT30) | Unsold rooms (14-day total) | ADR (Oct 2025) |
|---|---|---|---|---|---|---|---|
| Fukuoka | 50% | 771,015 | 32.0% | 26.1 | 67.0% | 135,851 | ¥11,229 |
| Kagoshima | 60% | 402,234 | 16.7% | 33.6 | 37.6% | 104,665 | ¥6,530 |
| Kumamoto | 60% | 389,064 | 16.1% | 27.8 | 65.5% | 67,552 | ¥10,428 |
| Nagasaki | 50% | 325,070 | 13.5% | 28.5 | 66.9% | 52,908 | ¥7,712 |
| Oita | 50% | 279,950 | 11.6% | 25.7 | 62.8% | 56,564 | ¥14,610 |
| Miyazaki | 50% | 159,060 | 6.6% | 23.5 | 54.9% | 42,367 | ¥6,819 |
| Saga | 50% | 84,145 | 3.5% | 19.5 | 62.6% | 22,534 | ¥11,978 |
| Seven-prefecture total | — | 2,410,538 | 100.0% | 27.1 | — | 482,441 | — |
Subsidy-weighted guest nights and reach per room are based on October 2025 results. Estimated OCC and unsold rooms are the LT30 cross-section for check-ins 1–14 October 2026 (2,167 properties and 88,874 rooms across the seven prefectures). ADR is the estimated settled ADR for October 2025. Source: Japan Tourism Agency, Accommodation Survey / MetroEngines Research; compiled by the HotelBank Editorial Team
Circle size = subsidy-weighted guest nights; colour depth = subsidy rate. Source: Japan Tourism Agency, Accommodation Survey / MetroEngines Research; compiled by the HotelBank Editorial Team
Capturing the demand that sits outside the subsidy
This is where the caveat at the top matters. Because the scope of eligible travellers has not been published, whether inbound visitors are covered changes the shape of the market each prefecture is facing.
If they are included, reach in the high-foreign-share prefectures — Fukuoka (32.9%), Kumamoto (22.6%) and Oita (22.0%) — extends beyond the table above. Across the seven prefectures that is 1,305,610 guest nights, or roughly 680,000 equivalent guest nights once weighted by subsidy rate. Multilingual announcement paths, and clear instructions for claiming the discount through travel agencies and booking sites respectively, then translate directly into fewer missed bookings.
If they are not included, those 1,305,610 guest nights sit outside the programme. But this is also demand that holds up without any subsidy. In Fukuoka it is roughly a third of October accommodation demand, and its weight in revenue terms may be larger still. Since subsidised domestic guests will be moving on price during the programme period, it is worth having reasons to be chosen that are not about price for the segment outside it — consecutive-night benefits, bundled food and experiences, flexible check-in times — which becomes a revenue pillar independent of domestic movement. Even in Fukuoka, with 135,851 unsold October room nights, there is no need to assume the entire volume gets filled by subsidised demand alone. How much the weight of inbound guests varies by property type is covered in City Hotels: 45.9% of Guest Nights Are Foreign — Ryokan +3.7%.
In either case, what a hotel can decide in advance is the same. First, work out from the rate-and-cap relationship which of your own price bands receive the full subsidy (up to roughly ¥33,000 at 60%, ¥40,000 at 50%, for accommodation-only products). Second, since each prefecture sets its own booking-open date, know how your own prefecture’s schedule sits relative to neighbouring ones. Third, record your property’s absorption pace at identical LT cross-sections, so that you can separate afterwards what actually moved around the programme’s start.
Conclusion
Read the programme by discount rate alone and attention goes to the 60% in Kumamoto and Kagoshima. Measured from the denominator, however, 50%-rate Fukuoka’s reach on its own (771,015 equivalent guest nights) nearly matches the two 60% prefectures combined (791,298), and 50%-rate Nagasaki reaches 83.6% of 60%-rate Kumamoto. Prefectures with a high Japanese share see the programme’s effect spread across more of the total market; prefectures with a high inbound share leave relatively more demand outside it. That structure shows up directly in the numbers.
Layer inventory on top, and Kagoshima is the prefecture where reach and slack are both large: reach per room of 33.6 and estimated OCC of 37.6% at the LT30 cross-section (14-day average for check-ins 1–14 October 2026). Fukuoka, with the largest reach, is already 67.0% sold. The same programme puts some prefectures in a “draw demand in” phase and others in an “allocate what’s left” phase.
One repetition to close. The scope of eligible travellers — whether inbound visitors are included — had not been published as of writing. This article presents both cases side by side and asserts neither. Confirm it, along with each prefecture’s eligible period and booking-open date, against the official announcements.
⚠ A note on handling the data: In the Japan Tourism Agency’s Accommodation Survey, the 2025 figures are annual confirmed values while the January–June 2026 figures are second preliminary values, and preliminary values are revised later. Take care when comparing figures from different aggregation stages directly. The estimated OCC and unsold-room figures here are estimates based on inventory published on OTAs at the time of observation, and they shift as check-in approaches. ADR is an estimated settled ADR on a confirmed historical basis for October 2025; because that basis differs from estimates for future months, the two are not compared directly.
Related reading
- Kyushu Recovery Subsidy Set: 60%/50% Split, ¥20,000 Cap Hits Top 10%
- Kyushu Subsidy: Kumamoto & Kagoshima Hold 34.9% of Oct Unsold Rooms
- City Hotels: 45.9% of Guest Nights Are Foreign — Ryokan +3.7%
References and sources
■ Government and official announcements
- Japan Tourism Agency, “Kyushu Recovery Support Subsidy” (disaster-related information) — subsidy rates, caps and eligible periods
- Japan Tourism Agency, Accommodation Survey — guest nights and foreign guest nights by prefecture, January–December 2025 (annual confirmed figures) and January–June 2026 (second preliminary figures)
■ Press coverage
- Kyushu recovery travel subsidy to start in October; 60% off in Kumamoto and Kagoshima (Nikkei, 28 August 2026)
- “Kyushu Recovery Support Subsidy”: 60% off in Kumamoto and Kagoshima, 50% off in Fukuoka and four other prefectures, from October (Nishinippon Shimbun)
■ Market data
- MetroEngines Research — OTA-listed inventory progression for October 2026 check-ins (2,167 properties and 88,874 rooms across the seven prefectures); estimated settled ADR for October 2025 (seven prefectures, 147–466 properties each)