

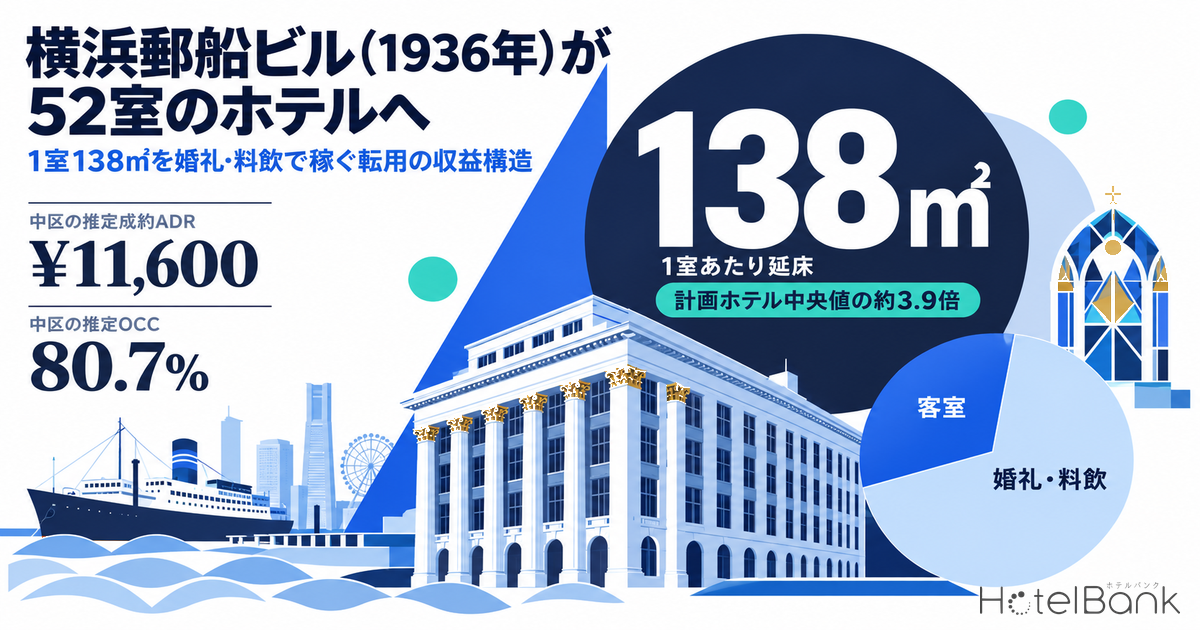
The Yokohama Yusen Building, completed in 1936 on Kaigan-dori in Yokohama, is scheduled to reopen at the end of January 2027 as THE MARITIME HOTEL YOKOHAMA BAY, a 52-room hotel. Dividing its 7,163.25㎡ of gross floor area by 52 rooms gives roughly 138㎡ per room — about 3.9 times the median (35.0㎡) for hotels currently in the planning pipeline. This article examines how that oversized floor plate is meant to be filled with wedding, banquet and food & beverage (F&B) revenue, drawing on estimated settled ADR and estimated OCC for Naka Ward, Yokohama, and on location data from the Ministry of Land, Infrastructure, Transport and Tourism (MLIT) — zoning, flood risk, land prices and station ridership.
Metric Definitions Used in This Article
- ADR (Average Daily Rate): An estimated settled rate (tax-exclusive equivalent), calculated by applying a segment-specific adjustment factor to the lowest published plan rate each property lists on OTAs and similar channels (per room, two guests per room, tax-inclusive). Checked against property-level results disclosed by listed hotel REITs (91 properties, most recent 3 months), the median error is about 7%. These are estimates and differ from each property’s actual transaction prices and accounting figures. Area-level ADR is the median of the properties covered (the level of a typical property in the area).
- OCC (Occupancy): The share of rooms sold relative to total rooms in the area (an estimate based on OTA sales inventory). Because it reflects how inventory sold through OTAs and similar channels is being absorbed, it differs from each property’s actual overall occupancy.
- LT (Lead Time): Days until check-in. The booking curves in this article use only the LT45–LT1 range.
- Data source: MetroEngines Research & Consulting (as of September 29, 2026)
The bottom line first. Under this article’s assumptions, room revenue for the 52 rooms falls in a range of ¥332 million to ¥607 million a year. A reference case that uses the same floor area at limited-service floor efficiency (35㎡ per room) yields room revenue of about ¥697 million, so rooms alone cannot close the gap. Once weddings (100–200 a year) and F&B plus general banqueting are layered on, total revenue reaches ¥815 million to ¥1.54 billion, with rooms accounting for only about 40%. In other words, this conversion is better understood not as “a 52-room hotel” but as “a wedding- and F&B-led complex with guest rooms attached.” The key to a design that reconciles preservation with profitability lies in the floor space outside the guest rooms.
- — 137.8㎡ of floor area per room: 7,163.25㎡ divided by 52 rooms, about 3.9x the 35.0㎡ median for pipeline hotels (hotel-only primary use, 50+ rooms, N=29).
- — Room revenue of ¥332M–¥607M a year: Three scenarios with ADR of ¥25,000–¥40,000 and assumed full-year OCC of 70–80%. None reaches the reference case of using the same floor area as a limited-service hotel (about ¥697M).
- — Total revenue of ¥815M–¥1.54B, about 40% from rooms: Our estimate layering 100–200 weddings a year plus F&B and general banqueting; even the conservative scenario exceeds the reference case.
- — Wedding volume is the biggest variable: From the base scenario (¥1.161B), 50 fewer weddings cuts total revenue by 12.9%, ADR −10% by 3.9%, and OCC −5pt by 2.6%.
- — Naka Ward’s estimated settled ADR is ¥11,600 (+4.5% YoY): Average for Sep 2025–Aug 2026. The top five properties within 1.5km run ¥22,000–¥33,000; estimated OCC was 80.7% in August 2026.
The Conversion Facts — Timeline from 1888 to 2027 and Building Specifications
According to a news release from NYK Line (Nippon Yusen Kabushiki Kaisha) dated May 9, 2025, the subject is the Yokohama Yusen Building at 3-9-1 Kaigan-dori, Naka Ward, Yokohama, with a site area of 5,507.14㎡, four floors above ground and a gross floor area of 7,163.25㎡. Completed in 1936 to commemorate the company’s 50th anniversary, the building features 16 Corinthian columns across its façade. Construction began on May 7, 2025 and is scheduled for completion in autumn 2026, with design by JP Properties, construction by Iwata Chizaki, and hotel operation by Plan・Do・See. As part of the Kaigan-dori district redevelopment (from 2023), the plan converts the interior to a hotel while retaining the building’s historical, architectural and townscape value.
Details of the hotel were announced from December 2025 onward. According to Yokohama City’s official tourism site and the Kanko Keizai Shimbun, the hotel will be named THE MARITIME HOTEL YOKOHAMA BAY and is scheduled to open at the end of January 2027, with 52 rooms across seven types, all 38㎡ or larger. Rooms are named after NYK’s former scheduled shipping routes. Facilities include an all-day dining restaurant and a bar, three banquet rooms, and a chapel with natural light and stained glass; advance wedding bookings opened on December 23, 2025. The investment amount has not been disclosed.
| Date | Event |
|---|---|
| 1888 | NYK establishes a base on this Kaigan-dori site (Yokohama City tourism information) |
| 1936 | The current Yokohama Yusen Building is completed (commemorating the company’s 50th anniversary; 16 Corinthian columns) |
| 2003 | The NYK Maritime Museum relocates to and opens on the building’s first floor |
| April 2023 | The museum closes due to the Kaigan-dori district redevelopment |
| May 7, 2025 | Hotel conversion works begin |
| December 23, 2025 | Advance wedding bookings open |
| Autumn 2026 | Scheduled completion of works |
| January 2027 | Scheduled completion of the new Yokohama Building next door (NYK Maritime Museum on the 2nd floor, opening spring 2027 or later) |
| End of January 2027 | Scheduled opening of THE MARITIME HOTEL YOKOHAMA BAY (52 rooms) |
A 138㎡-per-Room Floor Plan — Why Non-Room Revenue Is Essential
Dividing 7,163.25㎡ of gross floor area by 52 rooms gives 137.8㎡ per room. For comparison, we calculated floor area per room for the 29 pipeline hotels in MLIT’s Statistics on Building Construction Starts whose primary use is hotel only and that have 50 or more rooms: the median is 35.0㎡, the first quartile 18.3㎡ and the third quartile 65.0㎡. The Yokohama Yusen Building is more than double the third quartile, using its floor space in a completely different way from a typical new-build hotel.
The difference comes from the floor area allocated to uses other than guest rooms. Using the minimum room size of 38㎡, the 52 rooms occupy about 1,980㎡, or roughly 28% of gross floor area; even with generous room sizes, the share stays in the 30% range. The rest is taken up by the chapel, three banquet rooms, all-day dining and bar, plus atrium-like public spaces with the colonnade and back-of-house areas. As long as the 1936 structure and exterior are preserved, there is limited scope to subdivide the floors into more rooms. That is precisely why the revenue plan rests on a design that makes non-room floor space earn — in other words, on appointing an operator strong in weddings, banqueting and F&B. Japan’s Building Standards Act also offers a separate route for turning historic buildings into lodging, via municipal exemption ordinances under Article 3.
This floor configuration means a different yardstick applies than for a lodging-led office conversion. In the general case of judging office-to-hotel conversions by revenue per tsubo (3.3㎡), room density is decisive; here, however, each guest room carries roughly four times the floor area, so the design does not rely on room rates alone to recover the cost of the floor space. Below, we first check the level of room rates and occupancy, and then set out scenarios that add weddings and F&B.
Naka Ward’s Estimated Settled ADR and OCC — The Price Band for 38㎡+ Rooms
According to MetroEngines Research, the estimated settled ADR (area median) for Naka Ward, Yokohama averaged ¥11,600 over the 12 months from September 2025 to August 2026 (49–52 properties). That is up 4.5% from ¥11,100 in the prior-year period (September 2024–August 2025). By month, April 2026 was the highest at ¥14,700, pointing to a tendency for rates to rise in spring. Limited to the city-hotel segment, the 12-month average was ¥22,000 (7–8 properties), up 7.2% year on year — faster growth than the market as a whole.
For rooms of 38㎡ and up, the relevant price band is that of the top properties rather than Naka Ward’s median. Among full-service, upper-tier properties in Naka Ward within 1.5km of the site, estimated settled ADR (12-month average) ranges from the low ¥20,000s to the low ¥30,000s: Hyatt Regency Yokohama (ハイアット リージェンシー 横浜) at ¥32,700, Hotel New Grand (ホテルニューグランド, opened 1927) at ¥28,700, THE GATE HOTEL Yokohama by HULIC (ザ・ゲートホテル横浜 by HULIC, opened 2025) at ¥24,700, Rose Hotel Yokohama (ローズホテル横浜) at ¥22,700 and Citadines Harbour Front Yokohama (シタディーンハーバーフロント横浜) at ¥21,700. With the distinctive value of a historic building and generously sized rooms, the 52-room hotel is positioned to set its pricing against this upper tier.
| Property / segment | Rooms | Est. settled ADR (12-month avg.) | Notes |
|---|---|---|---|
| Hyatt Regency Yokohama | 315 | ¥32,743 | Opened May 2020 |
| Hotel New Grand | 238 | ¥28,749 | Opened 1927 |
| THE GATE HOTEL Yokohama by HULIC | 111 | ¥24,712 | Opened February 2025 |
| Rose Hotel Yokohama | 184 | ¥22,685 | Chinatown area |
| Citadines Harbour Front Yokohama | 242 | ¥21,705 | Opened 2023 |
| Naka Ward, city-hotel segment (median) | 7–8 properties | ¥22,034 | Area median |
| Naka Ward, all properties (median) | 49–52 properties | ¥11,605 | Area median |
Plotting the 41 properties within 1.5km for which estimates could be calculated by room count and estimated settled ADR, all six properties at ¥25,000 or above have 146 rooms or more, and only one property with 80 rooms or fewer exceeds ¥20,000 (a 34-room property at about ¥25,000). The small-scale, high-rate band remains thin in this catchment. A 52-room scale is consistent with a positioning that combines small weddings with longer-stay leisure lodging, rather than competing head-on with large hotels for banquets and weddings.
On occupancy, Naka Ward’s estimated OCC was 78.0% in July 2026 (48 properties / 9,962 rooms, based on listings on major booking sites) and 80.7% in August (49 properties / 9,971 rooms, same basis). The business-hotel segment ran higher, at 84.1% in July and 84.3% in August (29 properties / 5,437 rooms, same basis). By day of week, August averaged 85.1% on Saturdays and 79.7% Monday–Thursday, indicating that both weekday business travel and weekend leisure and wedding-related demand are filling rooms.
It is also worth checking how bookings build up. Comparing estimated OCC from LT45 to LT1 for the stay dates of Saturday, September 12 and Wednesday, September 16, 2026, Saturday rose from 50.1% at LT45 to 81.8% at LT1, and Wednesday from 47.8% to 84.1% (both 50 properties / 9,972 rooms, based on listings on major booking sites). The pattern of about 20pt being filled in the final two weeks differs little between weekends and weekdays. Since weddings are generally booked with far longer lead times than lodging, this is a market where a two-layer structure is easy to build: weddings lock in weekend rooms early, while last-minute individual bookings fill weekdays.
Simple Scenarios: Room Rate × Occupancy × Wedding Volume — Rooms Are About 40% of Revenue
Here we layer three revenue streams — rooms, weddings, and F&B (restaurant, bar and general banqueting other than weddings) — with the assumptions stated explicitly. Because the investment amount has not been disclosed, we do not calculate yields or payback periods. This is a simple model for understanding the revenue mix, not the operator’s plan.
| Item | A. Conservative | B. Base | C. Upside |
|---|---|---|---|
| ADR (estimated settled basis) | ¥25,000 | ¥32,000 | ¥40,000 |
| OCC (assumed full-year) | 70% | 75% | 80% |
| RevPAR | ¥17,500 | ¥24,000 | ¥32,000 |
| Room revenue | ¥332M | ¥456M | ¥607M |
| Weddings / revenue | 100 / ¥300M | 150 / ¥450M | 200 / ¥600M |
| F&B and general banqueting revenue | ¥183M | ¥256M | ¥329M |
| Total revenue | ¥815M | ¥1,161M | ¥1,536M |
| Room revenue share | 40.8% | 39.2% | 39.5% |
| Revenue per ㎡ of floor area | ¥114,000 | ¥162,000 | ¥214,000 |
In all three scenarios, rooms consistently account for about 40% of revenue. On room revenue alone, even the upside scenario’s ¥607 million falls short of the limited-service reference case (about ¥697 million, or ¥97,000 per ㎡ of floor area). Once weddings and F&B are added, however, even the conservative scenario reaches ¥815 million in total revenue, above the reference case. In terms of revenue per unit of floor area, too, the conservative scenario’s ¥114,000/㎡ compares with ¥97,000/㎡ for the reference case — so if non-room floor space generates revenue, keeping the preserved building low-rise is entirely viable on floor-efficiency grounds as well.
We also tested sensitivity. From the base scenario, 50 fewer weddings brings total revenue to ¥1,011 million; a 10% lower ADR to ¥1,115 million; a 5pt lower OCC to ¥1,131 million; and 50 fewer weddings combined with a 10% lower ADR to ¥965 million. Swings in wedding volume affect total revenue more than swings in room rate or occupancy. Wedding sales capability is the single variable with the largest impact on this property’s earnings. Note that 200 weddings a year in a single chapel, if handled on weekends only, implies a pace of about two weddings per day, so the upside scenario’s wedding count is best read as a ceiling dependent on the operator’s sales capability.
| Change from base scenario (B) | Total revenue | vs. base |
|---|---|---|
| Base scenario | ¥1,161M | — |
| ADR −10% (¥28,800) | ¥1,115M | −3.9% |
| OCC −5pt (70%) | ¥1,131M | −2.6% |
| Weddings −50 (100) | ¥1,011M | −12.9% |
| Weddings −50 and ADR −10% | ¥965M | −16.8% |
We also checked what happens when two variables move at once. Holding full-year OCC at 75% and F&B and general banqueting at ¥700,000 per day, and laying out total revenue by combination of ADR and wedding count, a change of 25 weddings a year moves total revenue by ¥75 million — more than a one-step change in ADR (¥3,200–¥4,000), which moves it by ¥46–¥57 million. Even the harshest combination, ADR of ¥25,000 with 100 weddings, yields total revenue of ¥911 million, above the limited-service reference case (about ¥697 million).
| ADR \ Weddings (per year) | 100 | 125 | 150 | 175 | 200 |
|---|---|---|---|---|---|
| ¥25,000 | 9.11 | 9.86 | 10.61 | 11.36 | 12.11 |
| ¥28,800 | 9.65 | 10.40 | 11.15 | 11.90 | 12.65 |
| ¥32,000 | 10.11 | 10.86 | 11.61 | 12.36 | 13.11 |
| ¥36,000 | 10.68 | 11.43 | 12.18 | 12.93 | 13.68 |
| ¥40,000 | 11.25 | 12.00 | 12.75 | 13.50 | 14.25 |
Weddings and banquets are among the most seasonal of a hotel’s non-room revenue streams, concentrated in autumn and spring. Because this coincides with Naka Ward’s estimated settled ADR peaking in spring (April), the alignment of peak seasons for rooms and weddings is an upside for pricing. If overnight stays by wedding guests can be captured as a source of room demand, there is also room to push weekend room rates higher.
Location — Commercial Zoning with 400% FAR, Walking Distance to Bashamichi and Nihon-odori Stations
Checking the urban planning information for the site (3-9 Kaigan-dori) in MLIT’s Real Estate Information Library, the zoning is a Commercial District with a designated building coverage ratio of 80% and a designated floor area ratio (FAR) of 400%. Against a site of 5,507.14㎡, gross floor area is 7,163.25㎡, only about 1.3 times the site area. The four-story preserved building uses only about a third of the designated FAR, so for the owner, how to value this “unused floor area” becomes a key issue when weighing preservation against redevelopment.
| Storm surge inundation | 0.5m to under 1m |
| Tsunami inundation | 1m to under 2m |
| River flooding (maximum assumed) | Outside zone |
The site falls within assumed inundation zones of 0.5m to under 1m for storm surge and 1m to under 2m for tsunami. It is not within the assumed flood zone (maximum scale) of the Ooka River. For a harborfront location on Kaigan-dori, these depths are not exceptional; the real issue is less the depth itself than equipment placement — on which floors to put power receiving and transforming equipment, kitchens, and banquet sound and lighting systems. Facilities centered on weddings and banqueting in particular tend to concentrate equipment and food storage in the basement and on the ground floor, so the ability to build upper-floor equipment placement and flood-barrier operations into the conversion design will underpin business continuity.
Land prices continue to rise. The official land price point closest to the site (Yokohama Naka 5-17, about 150m away) stood at ¥1.40 million per ㎡ as of January 1, 2026, up 16.7% year on year — about 1.44 times its 2023 level of ¥972,000 in three years. Nearby, Yokohama Naka 5-19 (about 300m) was ¥2.48 million (+18.1%) and Yokohama Naka 5-2 (about 360m) ¥1.97 million (+12.6%); commercial land across the Kannai–Bashamichi area has posted double-digit gains for three consecutive years.
For transport access, Bashamichi Station (41,286 daily passengers in 2023) and Nihon-odori Station (26,788) on the Minatomirai Line are within walking distance. Bashamichi has nearly recovered to its 2019 level of 41,627, and JR Kannai Station has rebounded to 100,954. Within 1km there are 7,220 establishments and 127,000 employees, 31.2% of them office-type, providing a deep base for weekday lodging, business dining and banquet demand.
On supply, there are 62 properties with 13,358 rooms within 1km of the site for which room counts are available, of which only 13 properties (413 rooms) have 60 rooms or fewer. Within 1.5km, we confirmed 7 openings with 743 rooms since January 2025. In the former city hall block in Minato-cho 1-chome, a hotel (about 280 rooms) opened in April 2026, and in Kitanaka-dori 6-chome a 272-room hotel with attached apartments is scheduled for completion in May 2027. Amid a continuing flow of large new-build supply, the 52-room historic building occupies a position that overlaps with neither in scale nor in character.
Implications for Owners of Historic Buildings — Three Conditions for Reconciling Preservation and Profitability
1. Make non-room floor space earn
In a building with roughly four times the floor area per room of a new build, rooms account for only about 40% of total revenue. Appointing an operator capable in weddings, banqueting and F&B is the starting point for the revenue plan of a preservation conversion.
2. Target the empty small-scale, high-rate band
Within 1.5km of the site, only one property with 80 rooms or fewer has an estimated settled ADR above ¥20,000. Rather than competing with large hotels on scale, the property can position itself around small weddings combined with longer-stay lodging.
3. Factor unused floor area and equipment placement into valuation
Gross floor area is about 1.3 times the site area, leaving headroom against the designated 400% FAR. When assessing the value of choosing preservation, put the treatment of unused floor area and the cost of equipment placement suited to the inundation risk in the same table.
The Yokohama Yusen Building conversion is a case of turning a nearly 90-year-old building into a hotel not by “packing in rooms to earn” but by “earning from its generous floor space through weddings and F&B.” Naka Ward’s estimated settled ADR averaged ¥11,600 over 12 months, up 4.5% year on year, while top properties achieve rates from the low ¥20,000s to the low ¥30,000s. In this market environment, a design that pairs 52 rooms, all 38㎡ or larger, with weddings held in a historic colonnaded space offers one model for reconciling preservation with profitability.
For operating companies and real estate firms that own aging or historic buildings, the starting point is not to judge conversion feasibility on room rates alone. Decide first what share of floor area will go to non-room uses and who will fill that space with which business, and only then layer in room rates and occupancy when building the P&L — that sequence makes it easier to see a path to turning a preserved building’s value into revenue. From the standpoint of regional banks’ real estate finance as well, adding wedding-volume sensitivity to the underwriting criteria alongside room RevPAR should improve the accuracy of evaluating deals of this kind.
Related Articles
- Yokohama Minatomirai Luxury Hotel Pipeline Investment Analysis: Price Tiers & Mixed-Use Upside
- Banquet Floors to Guestrooms: 20 Markets Clear the ¥9,600 ADR Line
References and Sources
■ Data sources
Estimated settled ADR, estimated OCC, booking curves and surrounding supply are from MetroEngines Research & Consulting (Naka Ward, 49–52 properties per month; 41 properties within 1.5km; as of September 29, 2026). Building specifications and opening plans are from NYK news releases, Yokohama City tourism information and the Kanko Keizai Shimbun; location conditions from MLIT’s Real Estate Information Library; and floor area and room counts for pipeline hotels from MLIT’s Statistics on Building Construction Starts.
■ Estimation assumptions
Room revenue = 52 rooms × ADR × OCC × 365 days (ADR of ¥25,000, ¥32,000 and ¥40,000; OCC of 70%, 75% and 80% as assumed full-year values). Weddings assume ¥3.0 million in venue revenue per wedding × 100–200 weddings a year; F&B and general banqueting assume ¥500,000–¥900,000 per day. Because the investment amount has not been disclosed, yields, payback periods and NOI are not calculated.
■ Limitations
Estimated settled ADR and estimated OCC are estimates based on inventory listed on OTAs and similar channels and differ from each property’s actual results. The room rates, wedding volume and F&B revenue for the 52-room hotel are this article’s assumptions, not the operator’s plan; wedding spend is extrapolated from the Tokyo metropolitan average and will vary with the property’s price positioning. The comparison with pipeline hotels is based on building confirmation applications, and the distribution may change as further applications are filed.
■ Market data
- MetroEngines Research & Consulting — Estimated settled ADR (Naka Ward, 49–55 properties per month; 41 properties within 1.5km), estimated OCC (Naka Ward, 49 properties / 9,971 rooms and others, based on listings on major booking sites), booking curves (LT45–LT1), surrounding supply
■ Government statistics and public data
- MLIT Real Estate Information Library — Zoning, official land prices (2023–2026), storm surge / tsunami / flood inundation zones, passengers by station
- MLIT, Statistics on Building Construction Starts (floor area and room counts of pipeline hotels)
- Ministry of Internal Affairs and Communications / Ministry of Economy, Trade and Industry, Economic Census for Business Activity (2021) (e-Stat)
■ Company and industry materials
- NYK Line, “Start of Conversion Works to Turn the Yokohama Yusen Building into a Hotel” (May 9, 2025, Japanese)
- NYK Line, “NYK Maritime Museum to Reopen Next Spring” (April 6, 2026, Japanese)
- Recruit, Zexy Wedding Trend Survey 2024: Tokyo Metropolitan Area (Japanese)
- Zexy, “Wedding Costs: Regional Averages Nationwide” (Japanese)
- Hyatt Hotels of Japan, press materials (April 2026)
■ News and tourism information