

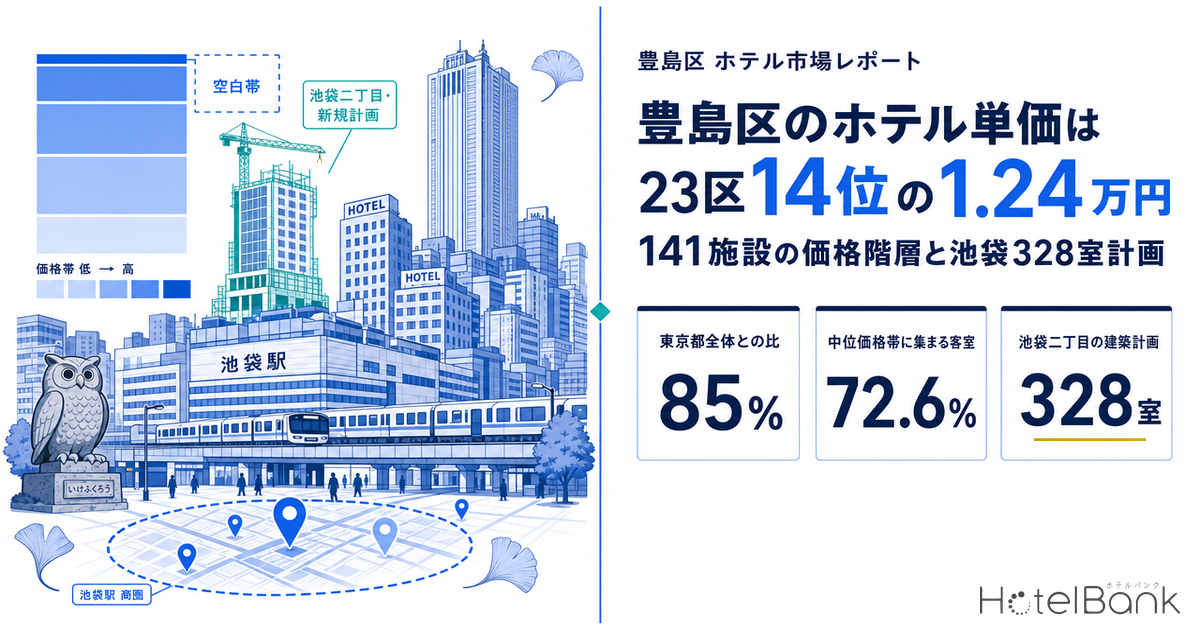
Ikebukuro Station is the busiest station on the Tokyo Metro network, with 518,135 daily passengers in FY2024, and also the busiest on the Seibu Railway network, with 428,121. Yet hotel rates in Toshima Ward, where the station sits, do not rank as high as that depth of demand would suggest. When the 23 wards are ranked by MetroEngines Research’s estimated settled ADR, averaged over the 12 months from September 2025 to August 2026, Toshima comes in 14th at ¥12,400, just 85% of the level for Tokyo as a whole (¥14,500). This article focuses on Toshima Ward alone. It maps the ward’s price tiers (how many hotels and rooms fall into each estimated settled ADR band), then sets them against the residential and workforce catchment around Ikebukuro Station and a 328-room building project nearing completion in Ikebukuro 2-chome.
ADR (Average Daily Rate) = an estimated settled rate (tax-exclusive equivalent), calculated by applying a format-specific adjustment factor to the lowest plan price each property publishes on OTAs (per room, two guests per room, tax included). Checked against property-level results disclosed by listed hotel REITs (91 properties, most recent three months), the median error is about 7%. These are estimates and differ from each property’s actual settled prices and accounting figures. Area-level ADR is the median of the properties covered (the level of a typical property in the area). In this article it is referred to as “estimated settled ADR.”
Listed price = the area median of the average of all plans published on OTAs and similar channels (per room, two guests per room, tax included, from room-only to meal-inclusive plans). It is a separate metric from estimated settled ADR.
OCC (Occupancy rate) = the share of rooms sold out of total rooms in the area (an estimate based on OTA sales inventory). It reflects how quickly inventory sold on OTAs is taken up and differs from a property’s actual overall occupancy.
Price band = five bands based on each property’s estimated settled ADR (average of monthly values from September 2025 to August 2026): under ¥8,000 / ¥8,000–12,000 / ¥12,000–20,000 / ¥20,000–30,000 / ¥30,000 and above.
Data sources = MetroEngines Research & Consulting; Ministry of Land, Infrastructure, Transport and Tourism (MLIT) National Land Numerical Information and Real Estate Information Library; Ministry of Internal Affairs and Communications / Ministry of Economy, Trade and Industry Economic Census for Business Activity; figures published by each railway operator.
- — 14th of 23 wards at ¥12,400 — Toshima’s estimated settled ADR (12-month average) is 85% of the Tokyo-wide level. It rose 4.8% YoY, almost the same pace as Tokyo overall (+5.9%)
- — 72.6% of rooms sit in the ¥8,000–20,000 range — of the 65 properties and 10,204 rooms assigned a price band, 7,401 rooms fall into these two bands. In Shinjuku Ward the same two bands account for 54.4%
- — Only 2 hotels and 139 rooms (1.4%) at ¥30,000+ — versus 27.6% in Shinjuku. Mid-sized hotels (100–299 rooms) at ¥20,000+ number just 3 with 388 rooms, the thinnest layer in the ward’s price structure
- — 155,000 residents and 169,000 workers — the residential population within 1.5 km of Ikebukuro Station is 1.57 times that around Shinjuku Station on the same basis, and is projected to be 6.7% higher in 2040 than in 2020. The catchment combines business demand with a deep residential base
- — 328 rooms = 2.9% of existing stock — the Ikebukuro 2-chome project (14 floors, announced to open in December 2026) is larger on its own than all 237 rooms that opened in the ward in 2024–2026 (based on confirmed OTA listings)
Toshima Ranks 14th of 23 Wards by Estimated Settled ADR — 85% of the Tokyo-Wide Level
We start with rate levels by ward. The chart below ranks the 23 wards by MetroEngines Research’s estimated settled ADR, averaged over the 12 months from September 2025 to August 2026. Shibuya is highest at ¥25,300, followed by Chuo (¥19,100) and Minato (¥17,700), the central wards with dense business and tourism activity. Toshima ranks 14th at ¥12,400, between Shinagawa (¥12,900) and Ota (¥12,200). Wards such as Setagaya, Nakano and Nerima, where fewer than 10 properties are covered by the estimated settled ADR calculation, can shift sharply in rank on the value of a single property, so they are shown in a lighter color. Limited to the 16 wards with 10 or more properties covered, Toshima ranks 13th.
Rate growth, on the other hand, is not much different from Tokyo overall. Toshima’s 12-month average rose 4.8% from the prior-year period (September 2024–August 2025, ¥11,800), while Tokyo as a whole rose 5.9%, from ¥13,700 to ¥14,500. In other words, Toshima’s rates are not “failing to grow.” They are rising at almost the same pace as the city as a whole while holding at around 85% of its level.
| Area | Est. settled ADR 12-month avg | YoY | Aug 2026 est. settled ADR | Aug 2026 listed price | Properties covered (monthly median) |
|---|---|---|---|---|---|
| Shibuya | ¥25,269 | +12.8% | ¥20,600 | ¥29,883 | 33 |
| Chuo | ¥19,082 | +9.5% | ¥14,188 | ¥27,025 | 151 |
| Minato | ¥17,666 | +7.1% | ¥13,888 | ¥25,959 | 132 |
| Shinjuku | ¥16,039 | +8.7% | ¥12,425 | ¥22,411 | 98 |
| Taito | ¥14,403 | +4.2% | ¥11,579 | ¥21,287 | 171 |
| Shinagawa | ¥12,858 | +3.0% | ¥10,716 | ¥21,227 | 35 |
| Toshima | ¥12,375 | +4.8% | ¥10,437 | ¥17,592 | 62 |
| Ota | ¥12,202 | +5.2% | ¥10,063 | ¥16,940 | 58 |
| Kita | ¥10,508 | +3.9% | ¥8,989 | ¥16,714 | 20 |
| Tokyo overall | ¥14,531 | +5.9% | ¥11,810 | ¥21,799 | 1,133 |
Looking at August 2026 alone, Toshima’s listed price (the ward median of the all-plan average) was ¥17,600 and its estimated settled ADR ¥10,400. Because the listed price includes every plan, from room-only to meal-inclusive and premium room types, it runs higher than the settled level. On a 12-month average, this ratio (estimated settled ADR ÷ listed price) is 0.63 for Toshima, higher than Shibuya (0.57), Shinjuku (0.55) and Tokyo overall (0.57). This suggests Toshima is a market where the range of published plan prices is relatively narrow, with a small gap between the cheapest plan and the all-plan average. The more a ward’s supply is weighted toward high-priced plans and room types, the lower this ratio falls.
Monthly Trend — Peaks in Spring and Autumn; Summer Below Prior Year, as Across Tokyo
Overlaying Toshima’s estimated settled ADR year by year reveals a clear seasonal shape. Rates peak in April (¥15,700 in 2026) and November (¥14,500 in 2025), with troughs in January and June–August. In 2026, January–May ran +1.4% to +7.6% YoY, before falling below the prior year in summer: −6.0% in June, −5.1% in July and −12.9% in August. This is not unique to Toshima, however: Tokyo as a whole moved in the same direction, at −3.9% in June, −4.8% in July and −9.2% in August. Toshima’s seasonal swings are simply somewhat larger.
Price Tiers — 72.6% of Rooms in the ¥8,000–20,000 Range, 1.4% at ¥30,000+
So how are the ward’s hotels distributed across price bands? Of the 139 properties and 11,491 rooms in the ward whose listed prices were observed in early August 2026, we took the 65 properties and 10,204 rooms in formats covered by the estimated settled ADR calculation (business, city, ryokan and capsule) and assigned each a price band based on its 12-month average estimated settled ADR. The remaining 74 properties and 1,287 rooms, including adults-only properties (34), hostels (15), guesthouses (12) and vacation rentals (10), fall outside the scope of estimated settled ADR and are excluded from the price-band analysis. For comparison, we applied the same procedure to Shinjuku Ward (117 properties, 17,993 rooms).
| Price band (est. settled ADR) | Toshima properties | Toshima rooms | Toshima share of rooms | Of which 100–299-room properties (rooms) | Shinjuku share of rooms |
|---|---|---|---|---|---|
| Under ¥8,000 | 6 | 430 | 4.2% | 2 (297) | 5.4% |
| ¥8,000–12,000 | 26 | 3,332 | 32.7% | 9 (1,525) | 5.5% |
| ¥12,000–20,000 | 25 | 4,069 | 39.9% | 18 (3,164) | 48.9% |
| ¥20,000–30,000 | 6 | 2,234 | 21.9% | 2 (281) | 12.6% |
| ¥30,000+ | 2 | 139 | 1.4% | 1 (107) | 27.6% |
| Total | 65 | 10,204 | 100% | 32 (5,374) | 17,993 rooms |
In Toshima, 72.6% of rooms are concentrated in two bands: ¥8,000–12,000 (32.7%) and ¥12,000–20,000 (39.9%). In Shinjuku the same two bands account for 54.4%, while ¥30,000+ makes up 27.6%. Toshima’s ¥20,000–30,000 band looks substantial at 21.9%, but 84% of those rooms (1,885 of 2,234) belong to two large city hotels of roughly 1,000 and 800 rooms. These two properties anchor the ward’s banquet, MICE and tourism demand and effectively carry Toshima’s upper price tier.
Put the other way around, mid-sized hotels (100–299 rooms) at ¥20,000+ number just 3, with 388 rooms, and there are only 2 hotels with 139 rooms at ¥30,000+. This is the thinnest layer in the ward’s price structure, and in this article we call it the “whitespace band.” Given that about 5,000 of Shinjuku’s 18,000 rooms are priced at ¥30,000+, Toshima’s upper price tiers appear to have room still unfilled, even though Ikebukuro is a terminal of comparable standing.
Positioning — Crowded at “~¥12,000 × Under 300 Rooms,” Empty at “¥20,000+ × Mid-Sized”
Plotting each property’s room count against its estimated settled ADR makes the structure clearer. Most points cluster in the band of under 300 rooms and ¥8,000–20,000, where 48 properties compete. By size, the median estimated settled ADR is ¥10,800 for the 28 properties with under 100 rooms, ¥13,900 for the 32 with 100–299 rooms, and ¥12,100 for the 5 with 300 or more. The 300+ tier consists of two city hotels and three large limited-service hotels, showing that large limited-service properties underpin the depth of the ward’s room stock.
The ward’s main battleground, with 48 properties. Mostly limited-service business hotels, which increasingly differentiate on station proximity, large public baths and breakfast. New entrants will be compared directly against existing hotels.
Only 2 hotels with 281 rooms. There is room for “upper-midscale limited-service” or lifestyle-oriented mid-sized hotels serving business and leisure travelers from central Tokyo. In Shinjuku this price band accounts for 12.6% of rooms.
2 hotels with 139 rooms (1.4%). Options include small-to-mid-sized extended-stay properties with multi-occupancy rooms for groups and families, or concepts tied to entertainment demand. Such hotels would also help bridge the step between price bands.
The map below shows 134 properties in the ward (those whose room count and location could be confirmed), color-coded by price band. The ¥8,000–20,000 bands are densely packed on both the east and west sides of Ikebukuro Station, while ¥20,000+ properties are scattered among the large city hotels in Higashi-Ikebukuro, parts of the station’s west and north exits, and the area around Otsuka Station. Small gray circles are formats outside the scope of estimated settled ADR (adults-only, hostels, etc.), which are concentrated from the north to the east of the station.
Catchment — A Location with 155,000 Residents and 169,000 Workers
Next, we check the catchment around Ikebukuro Station using public statistics. According to MLIT’s National Land Numerical Information future population estimates by 250 m mesh, the residential population within a 1.5 km radius of the Ikebukuro Station area is 154,711 (2025 estimate), of which 73.6% are of working age (15–64) and 18.1% are aged 65 or over. The 2040 estimate is 161,739, up 6.7% from 2020 (151,576), so the population here is still growing. On the same basis, the area around Shinjuku Station has 98,430 residents, with 2040 only 1.8% above 2020. Ikebukuro is a terminal with 1.57 times Shinjuku’s residential population.
On the employment side, we aggregated a 1 km radius from the Economic Census for Business Activity (2021) by the Ministry of Internal Affairs and Communications and the Ministry of Economy, Trade and Industry. The Ikebukuro Station area has 9,535 establishments and 169,412 workers, of whom 47,753 (28.2%) are in office-type industries such as information and communications, finance and professional services (17 town/block areas, with good data coverage). Business concentration is about half that around Shinjuku Station (319,191 workers, 32.5% office-type), but the location captures both weekday business travel and weekend shopping and entertainment demand.
| Indicator | Ikebukuro Stn. area | Shinjuku Stn. area | Source |
|---|---|---|---|
| Residential population (1.5 km radius, 2025 est.) | 154,711 | 98,430 | National Land Numerical Information |
| Working-age share | 73.6% | 74.7% | National Land Numerical Information |
| Share aged 65+ | 18.1% | 17.3% | National Land Numerical Information |
| 2040 population (vs. 2020) | +6.7% | +1.8% | National Land Numerical Information |
| Establishments (1 km radius) | 9,535 | 12,279 | Economic Census (2021) |
| Workers (1 km radius) | 169,412 | 319,191 | Economic Census (2021) |
| Office-type worker share | 28.2% | 32.5% | Economic Census (2021) |
| Tokyo Metro average daily passengers (FY2024) | 518,135 (+3.5%) | ― | Tokyo Metro |
| Seibu Railway average daily passengers (FY2024) | 428,121 (+2.1%) | ― | Seibu Railway |
Because each railway operator counts passengers differently, we do not combine the figures. Still, Ikebukuro is the busiest station on both the Tokyo Metro and Seibu networks, and JR East and Tobu Railway traffic comes on top of that. By station usage, residential population and working population alike, Toshima Ward has one of the strongest demand bases in Tokyo. Its 14th-place rate ranking is best read not as a sign of thin demand, but as a reflection of a price structure in which supply is concentrated in the ¥8,000–20,000 range.
Land Prices and Zoning — Commercial Land Prices Up a Median 15.6%
Now to the cost of location. In the official land price survey (as of January 1, 2026) in MLIT’s Real Estate Information Library, the 20 commercial sites in Toshima Ward around Ikebukuro Station posted a median year-on-year change of +15.6% (range +10.6% to +18.9%), up from a median of +12.7% the previous year (2025). A site in Higashi-Ikebukuro 1-chome, by the station’s east exit, is valued at ¥18.8 million per ㎡ (floor area ratio 900%), while a site in Ikebukuro 2-chome (250 m from the station, FAR 800%) is ¥2.38 million, up 18.4%. The median for 11 residential sites is also high at +12.5%.
While land prices are rising around 15% a year, estimated settled ADR is growing at 4.8% a year. When land acquisition costs rise faster than room rates, the more rooms a developer stacks on the same site in the ¥8,000–20,000 range, the heavier the burden of recovering land cost per room becomes. Targeting the whitespace band of mid-sized hotels at ¥20,000+ is therefore not just about choosing a less competitive niche; it means designing a rate tier that can keep pace with rising land prices. The same logic can be run in reverse, working back from room rates to the maximum land price at which a hotel project still pencils out.
To test how much this gap between land-price growth and rate growth affects development economics, we ran a simplified sensitivity analysis. Assuming three years from land acquisition to opening, and that land prices and estimated settled ADR each keep growing at a constant rate, the table below shows “land cost per room ÷ room rate” as an index with today = 100. If the 2026 land price change (median +15.6%) and Toshima’s rate growth (+4.8%) continue, the index reaches 134 at opening: the land cost that must be recovered at the same room rate is more than 30% heavier. Even matching Shinjuku’s rate growth (+8.7%) only brings it down to 120. The index falls below 100 only when land prices grow more slowly than rates.
| Land price change (annual) \ Est. settled ADR growth (annual) | ±0% | +2.5% | +4.8% (Toshima actual) | +5.9% (Tokyo actual) | +8.7% (Shinjuku actual) |
|---|---|---|---|---|---|
| +5.0% | 116 | 107 | 101 | 97 | 90 |
| +10.0% | 133 | 124 | 116 | 112 | 104 |
| +12.7% (2025 median) | 143 | 133 | 124 | 121 | 111 |
| +15.6% (2026 median) | 154 | 143 | 134 | 130 | 120 |
| +20.0% | 173 | 160 | 150 | 145 | 135 |
| Zoning around Ikebukuro Station (designations within surrounding tiles) | Floor area ratio | Building coverage ratio | Hotel use |
|---|---|---|---|
| Commercial zone (next to station) | 600–900% | 80% | Permitted |
| Commercial zone (outer station area) | 400–500% | 80% | Permitted |
| Neighborhood commercial zone | 300–400% | 80% | Permitted |
| Category 1 residential zone | 300–400% | 60–80% | Permitted up to 3,000㎡ |
| Category 1 medium-to-high-rise exclusive residential zone | 200–300% | 60% | Not permitted |
Next to the station, commercial zones with floor area ratios of 600–900% make mid- and high-rise hotels relatively easy to plan. Further from the station, residential zones such as Category 1 medium-to-high-rise exclusive residential zones spread out, where hotels cannot be built. In Category 1 residential zones, hotel floor area is capped at 3,000㎡, so sites for mid-sized or larger projects are limited to the commercial and neighborhood commercial zones around the station.
Supply — Ikebukuro 2-chome’s 328 Rooms Equal 2.9% of the Ward’s Existing Stock
Finally, we look at the new floor space entering this market. The building-plan data in MLIT’s Building Construction Statistics lists a hotel project at 2-8-1 Ikebukuro, Toshima Ward, with 328 rooms, 14 floors above ground and about 6,000㎡ of total floor area, scheduled for completion on September 10, 2026. In an announcement on March 21, 2025, APA Hotel Co., Ltd. said it plans to open “APA Hotel Ikebukuro-Ekimae (アパホテル〈池袋駅前〉)” (328 rooms, with large public bath and open-air bath) at the same address (Ikebukuro 2-8-1/2) in December 2026. A new 300-plus-room hotel with a large public bath will thus join the market in a prime location within walking distance of Ikebukuro Station.
| Item | Details |
|---|---|
| Location (building plan) | 2-8-1 Ikebukuro, Toshima-ku, Tokyo |
| Rooms / floors | 328 rooms / 14 floors above ground (total floor area approx. 6,000㎡) |
| Scheduled completion (building plan) | September 10, 2026 |
| Scheduled opening (operator announcement) | December 2026 (APA Hotel Ikebukuro-Ekimae, announced March 21, 2025) |
| Share of ward’s existing rooms | 2.9% (328 ÷ 11,491 rooms; 139 properties with listed prices observed in August 2026) |
| Share of stock within 1.5 km of Ikebukuro Station | 3.6% (328 ÷ 9,023 rooms, as of 2026) |
| New openings in the ward (2024–2026, based on confirmed OTA listings) | 10 properties / 237 rooms |
The 328 rooms equal 2.9% of the ward’s existing rooms, a scale that will be absorbed into the current supply-demand balance. Yet new openings in the ward identifiable from confirmed OTA listings totaled 10 properties and 237 rooms over the three years 2024–2026, so this single building exceeds all of them combined. Room stock within 1.5 km of Ikebukuro Station grew 30.4% in 11 years, from 6,922 rooms in 2015 to 9,023 in 2026, and this project adds another 3.6% on top. For the full picture of new supply relative to existing stock across all 23 wards, see Tokyo 23 Wards Supply Pressure 2026.
In terms of price bands, if the 328 rooms enter the ward’s largest band, ¥8,000–12,000, rooms in that band would rise 9.8%; if they enter the ¥12,000–20,000 band, 8.1%. Which band the hotel lands in depends on the operator’s pricing, and we do not draw a conclusion here. This is currently the only building plan identifiable in the ward, so how the whitespace of mid-sized hotels at ¥20,000+ gets filled will depend on future projects.
| Band the 328 rooms enter | Rooms in band (current) | Rooms in band (if added) | Band increase | Band share of rooms (current → if added) | Share of rooms at ¥20,000+ |
|---|---|---|---|---|---|
| Under ¥8,000 | 430 | 758 | +76.3% | 4.2% → 7.2% | 22.5% |
| ¥8,000–12,000 | 3,332 | 3,660 | +9.8% | 32.7% → 34.8% | 22.5% |
| ¥12,000–20,000 | 4,069 | 4,397 | +8.1% | 39.9% → 41.7% | 22.5% |
| ¥20,000–30,000 | 2,234 | 2,562 | +14.7% | 21.9% → 24.3% | 25.6% |
| ¥30,000+ | 139 | 467 | +236.0% | 1.4% → 4.4% | 25.6% |
As for transactions in existing stock, MetroEngines Research’s J-REIT holdings data (as of September 14, 2026) identifies two J-REIT-owned hotels in the ward: “the b ikebukuro (the b 池袋)” held by Japan Hotel REIT Investment Corporation (8985) (175 rooms, acquisition price ¥6,520 million, about ¥37.3 million per room), and “Flexstay Inn Sugamo (フレックステイイン巣鴨)” held by Invincible Investment Corporation (8963) (104 rooms, acquisition price ¥1,192 million, about ¥11.5 million per room). Differences in acquisition timing and building age make a direct comparison impossible, but the fact that a limited-service hotel right by Ikebukuro Station was valued in the ¥30-million-per-room range offers a benchmark for how investors value lodging assets near the station.
Supporting Demand Indicator — Tokyo OCC Holds at 87–91% Even in Summer
Ward-level OCC swings widely because of the small number of properties, so here we refer to Tokyo-wide OCC by category (estimated from OTA listed inventory) as a supporting indicator. In August 2026, Tokyo overall was at 88.2% (792 properties / 103,904 rooms, based on listings on major booking sites), business hotels at 88.8% (529 properties / 77,776 rooms) and city hotels at 87.2% (53 properties / 17,248 rooms). June was 90.5% (780 properties / 103,314 rooms) and July 91.1% (804 properties / 104,099 rooms): even in summer, when rates fell below the prior year, inventory continued to sell through at a high level.
| Tokyo (2026) | June | July | August | August coverage |
|---|---|---|---|---|
| All properties | 90.5% | 91.1% | 88.2% | 792 properties / 103,904 rooms |
| Business hotels | 90.9% | 91.7% | 88.8% | 529 properties / 77,776 rooms |
| City hotels | 89.8% | 89.5% | 87.2% | 53 properties / 17,248 rooms |
High occupancy, but rates at only 85% of the Tokyo-wide level. This combination suggests that demand in Toshima is ample in terms of volume, and that the room to lift rates lies in the ward’s price structure.
Implications by Reader — Development, Acquisition, Repositioning
A project targeting the whitespace band of ¥20,000+ × 100–299 rooms in the commercial zones next to the station (FAR 600–900%) would not overlap with the ward’s existing price tiers. Given the pace of land price increases (+15.6%), there is good reason to plan for an upper rate tier from the rate-design stage.
Although the ward’s rates are 85% of the Tokyo-wide level, their growth (+4.8%) is close to the city average and occupancy is high. In a catchment deep in both residents and workers, the demand stability of existing limited-service hotels is easy to underwrite. The 328-room pipeline equals 2.9% of existing stock.
The ward has 32 existing hotels with 100–299 rooms, totaling 5,374 rooms. Converting some rooms to multi-occupancy or premium types to offer rooms in the ¥20,000s is one way to capture whitespace demand. It also pairs well with widening the price range of published plans.
Conclusion
Toshima Ward has Ikebukuro Station, one of Tokyo’s major terminals, and a catchment of 155,000 residents and 169,000 workers, yet its estimated settled ADR ranks 14th of the 23 wards at 85% of the Tokyo-wide level. The reason is not thin demand but a price structure in which 72.6% of rooms are concentrated in the ¥8,000–20,000 range. Mid-sized hotels at ¥20,000+ number just 3 with 388 rooms, and ¥30,000+ hotels just 2 with 139 rooms; compared with Shinjuku, there is ample room left in the upper price tiers. The 328-room hotel scheduled to open in Ikebukuro 2-chome in December 2026 adds new floor space equal to 2.9% of existing stock and deepens the ward’s lodging capacity another notch. With land prices rising around 15% a year, anyone planning the next project should ask how to fill the whitespace in the ward’s price tiers; that is likely to be the key to lifting Toshima’s rate level.
Related Articles
- Hotel Development Capacity 2026: Zoning, FAR & Land Price in 5 Markets
- Tokyo 23 Wards Supply Pressure 2026: Arakawa 16.0%, Minato Just 4.5%
- Tokyo 2026: 2,055 New Rooms, 55.6% Business Hotels, ADR Turns Negative
References and Sources
■ Data sources
MetroEngines Research & Consulting (estimated settled ADR, listed prices, OCC, room counts by property, new openings, room stock within 1.5 km, J-REIT holdings data); MLIT Building Construction Statistics (building plans); MLIT National Land Numerical Information (future population estimates by 250 m mesh); MLIT Real Estate Information Library (official land prices, zoning); MIC/METI Economic Census for Business Activity (2021); passenger counts by station from Tokyo Metro and Seibu Railway (FY2024); APA Hotel Co., Ltd. press release.
■ Calculation assumptions
(1) Ward-level estimated settled ADR is the monthly median of covered properties, simply averaged over the 12 months from September 2025 to August 2026. (2) Each property’s price band is assigned based on the average of its monthly estimated settled ADR values (up to 12 months). (3) Supply ratios divide the planned room count (328) by the total rooms of the 139 properties in the ward whose listed prices were observed in early August 2026 (11,491 rooms), and by the 2026 room count within 1.5 km of Ikebukuro Station (9,023 rooms). (4) Increases by price band are mechanical calculations assuming all 328 rooms fall into a single band. (5) Acquisition price per room is the acquisition price divided by room count, unadjusted for differences in acquisition timing or building age.
■ Limitations and caveats
(1) Estimated settled ADR is a model-based estimate with a median error of about 7% against REIT-disclosed results, and differs from individual properties’ actual settled prices. (2) The price-band analysis is limited to 65 properties in covered formats (business, city, ryokan, capsule) and excludes 74 properties (1,287 rooms) such as adults-only properties, hostels and guesthouses. (3) Estimated settled ADR from September 2026 onward comes from a separate estimation series based on listing snapshots, so this article uses closed months only (through August 2026). Listed levels at the time of the survey may change. (4) New openings and room stock based on confirmed OTA listings may rise for recent years as more listings appear. (5) Building plans are based on confirmation applications as of the survey date, and the count is expected to grow as further applications are filed. Scheduled completion and opening dates differ by source and are stated as each source reports them. (6) Zoning shows the distribution of zones designated within the surrounding tiles, not the designation of any specific site. (7) Residential population is a census-based estimate, not transit or visitor population.
■ Market data
- MetroEngines Research & Consulting — estimated settled ADR and listed prices (Tokyo 23 wards, September 2024–August 2026), price bands by property (65 in Toshima, 117 in Shinjuku), estimated OCC (792 properties in Tokyo), new openings and room stock (based on confirmed OTA listings), J-REIT holdings data (as of September 14, 2026)
■ Government statistics and public data
- MLIT National Land Numerical Information, “Future Population Estimates by 250 m Mesh”
- MLIT Real Estate Information Library (official land prices, zoning)
- MIC/METI, Economic Census for Business Activity (2021)
- MLIT, Building Construction Statistics (building plans)
■ Railway operator figures
- Tokyo Metro, “Passenger Ranking by Station (FY2024)” (Japanese)
- Seibu Railway, “FY2024 Passengers by Station (Daily Average)” (Japanese)
■ REITs and press releases