

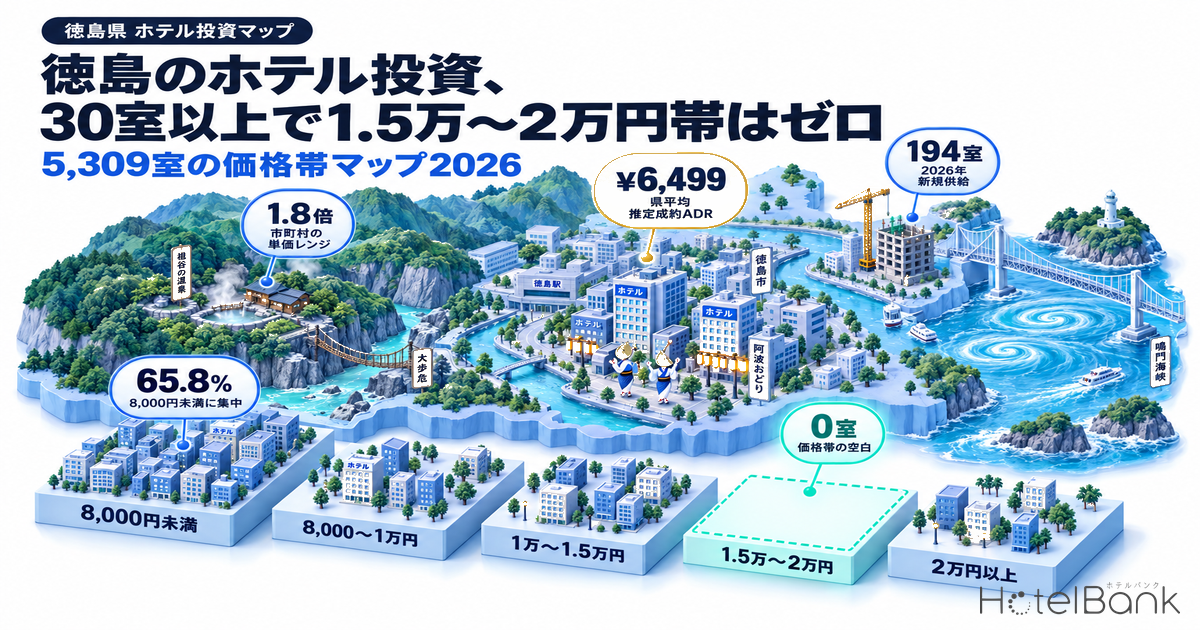
Tokushima’s hotel market is usually treated as “small and cheap” in the statistics. Lay out the property-level measurements, though, and the question for investors turns out not to be the absolute rate level. It is how unevenly room supply is spread across rate bands. MetroEngines Research & Consulting assigned estimated settled ADR for September 2025–August 2026 to the 61 properties in the prefecture with 30 or more rooms (5,309 rooms). 3,491 rooms (65.8%) sit below ¥8,000, while not a single property falls in the ¥15,000–20,000 band.
This article quantifies the hotel investment environment in Tokushima Prefecture in five steps: (1) rate tiers by municipality, (2) gaps in the price bands and evidence of demand for them, (3) the new-supply pipeline, (4) how land prices, zoning and disaster scenarios split location conditions, and (5) model calculations for three investment scenarios. It is written for hotel investors, developers and regional financial institutions.
Metric Definitions Used in This Article
- ADR (Average Daily Rate): An estimated settled rate (tax-exclusive equivalent), calculated by applying a segment-specific adjustment factor to the lowest-plan rate each property publishes on major booking sites (per room, 2 guests per room, tax included). Checked against property-level results disclosed by listed hotel REITs (91 properties, most recent 3 months), the median error is about 7%. It is an estimate and differs from each property’s actual settled prices and accounting figures. Area-level ADR is the median of the properties covered (the level of a typical property in the area).
- Listed price: The published price averaged across all plans (from room-only to meal-inclusive), per room for 2 guests, tax included. Because its basis differs from estimated settled ADR, the two are never mixed in this article.
- OCC (Occupancy rate): Rooms sold as a share of total rooms in the area (an estimate based on inventory sold through major booking sites). It differs from a property’s actual overall occupancy.
- GOP (Gross Operating Profit): Profit at the property-operation level, i.e. total revenue from rooms, F&B, etc., less departmental costs and SG&A. In this article, GOP yield = assumed GOP ÷ total investment (after construction-cost inflation). It excludes depreciation, interest, taxes and FF&E reserves.
- LT (Lead time): Days before check-in. LT0 = the day of stay. Early sell-out LT = the lead time at which remaining inventory first reached 0 rooms (a larger value means the property sold out earlier).
- Data sources: MetroEngines Research & Consulting (based on major booking-site listings) / MLIT Real Estate Information Library / MLIT National Land Numerical Information / MIC & METI Economic Census
- — Zero rooms in the ¥15,000–20,000 band — Sorting the 61 properties with 30+ rooms (5,309 rooms) by estimated settled ADR puts 3,491 rooms (65.8%) below ¥8,000, with nothing to absorb demand in the upper band.
- — Lowest rate in Shikoku, fastest growth — The prefecture’s average estimated settled ADR is ¥6,499 (Sep 2025–Aug 2026), 81.2% of Kagawa’s level. Its +7.0% YoY growth, however, is the highest of the four Shikoku prefectures.
- — There is demand in the gap — On a normal weekend, 57.1% of properties in the ¥10,000–15,000 band sold out 15+ days before the stay date, far above 11.1% in the sub-¥8,000 bands.
- — New builds hardly pencil out at current rates — A 40-room new build yields a 3.9% GOP yield. Reaching 8% requires an estimated settled ADR of about ¥31,100, consistent with zero hotel construction plans in the prefecture.
- — Repositioning existing stock is the realistic play — At ¥9.87 million per room, the GOP yield is 10.7%. The ADR needed for 8% is about ¥9,000 at 75% occupancy, falling to about ¥7,900 at 85%.
Rate Tiers by Municipality — Inland Onsen Areas at 1.4x the Prefecture Average
Start with the prefecture-wide level. Estimated settled ADR for September 2025–August 2026 averaged ¥6,499 per month, +7.0% over the prior-year period (¥6,077). Listed prices (all-plan average, tax included) for the same period averaged ¥15,648, +4.6% YoY, so the settled-rate basis, which is closer to actual transactions, grew faster. This suggests that price increases are reaching the rates actually sold, not only how listed prices are presented.
Position Among the Four Shikoku Prefectures — Lowest Rate, Highest Growth
The prefecture’s own level alone is no benchmark for an investment decision. Lining up the four Shikoku prefectures on the same period and definition, Tokushima has the lowest estimated settled ADR of the four, but the highest YoY growth. The investment question here is less that rates are low in absolute terms than how much room is left for them to close the gap.
| Prefecture | Est. settled ADR | Prior-year period | YoY | Listed price | Properties covered (monthly avg.) |
|---|---|---|---|---|---|
| Kagawa | ¥8,004 | ¥7,735 | +3.5% | ¥22,286 | 156 |
| Kochi | ¥7,936 | ¥7,579 | +4.7% | ¥19,316 | 120 |
| Ehime | ¥6,985 | ¥6,634 | +5.3% | ¥17,878 | 209 |
| Tokushima | ¥6,499 | ¥6,077 | +7.0% | ¥15,648 | 141 |
Tokushima’s estimated settled ADR stands at 81.2% of Kagawa’s and 81.9% of Kochi’s. If it rose to Kochi’s ¥7,936, that would add ¥1,437 per room-night across the 5,309 rooms at properties with 30+ rooms in the prefecture. This ¥1,437 is what funds the existing-stock repositioning scenario discussed later in this article. Having the fastest growth of the four prefectures indicates that this upside has already started to move.
Broken down by municipality, the prefecture’s rates fall into three tiers: inland onsen/gorge destinations, coastal resorts, and business-oriented areas around the prefectural capital and the airport. At the top is Miyoshi City at ¥9,004, driven by the onsen ryokan of Oboke and Iya. Next come Mima City at ¥8,355 and Naruto City at ¥7,968. The capital, Tokushima City, is at ¥6,364, just below the prefecture average.
The key point here is not to bring municipalities with few covered properties into the rate comparison. Tsurugi Town (estimated settled ADR ¥11,709) and Kamikatsu Town (¥11,136) look like the prefecture’s highest on paper, but only one property per month on average is covered for estimated settled ADR. The price of a single kominka inn or a single onsen inn becomes the municipality’s representative value, so the figure measures property mix rather than the local price level. These municipalities are best treated as reference values on a listed-price basis.
| Municipality | Listed properties | Listed price (all-plan avg.) | Est. settled ADR | Properties covered for est. settled ADR | Treatment |
|---|---|---|---|---|---|
| Miyoshi City | 30 | ¥17,943 | ¥9,004 | 16.3 | Used for comparison |
| Mima City | 10 | ¥23,497 | ¥8,355 | 5.8 | Used for comparison |
| Naruto City | 24 | ¥26,655 | ¥7,968 | 19.2 | Used for comparison |
| Naka Town | 6 | ¥23,390 | ¥6,904 | 5.0 | Used for comparison |
| Tokushima City | 60 | ¥13,624 | ¥6,364 | 50.3 | Used for comparison |
| Anan City | 22 | ¥14,974 | ¥5,956 | 14.0 | Used for comparison |
| Yoshinogawa City | 7 | ¥14,359 | ¥5,025 | 5.8 | Used for comparison |
| Matsushige Town | 8 | ¥9,667 | ¥4,947 | 7.9 | Used for comparison |
| Kaiyo Town | 13 | ¥18,999 | (¥9,875) | 2.9 | Reference only |
| Tsurugi Town | 7 | ¥24,927 | (¥11,709) | 1.0 | Reference only |
| Kamikatsu Town | 1 | ¥29,106 | (¥11,136) | 1.0 | Reference only |
| Komatsushima City | 3 | ¥13,994 | (¥5,691) | 3.0 | Reference only |
Price-Band Map — None of the 61 Properties with 30+ Rooms Sits in the ¥15,000–20,000 Band
What matters for an investment decision is less the municipal average than which price bands have capacity, and at what room scale. Narrowing to properties with 30+ rooms, a scale that matters operationally, we sorted the prefecture’s 61 properties (5,309 rooms) into estimated settled ADR bands.
The distribution is clearly polarized. Below ¥8,000 sit 46 properties with 3,491 rooms (65.8% of rooms). This band is lined with limited-service chains such as Toyoko Inn, Route Inn and HOTEL AZ, forming a thick, stable base that absorbs the prefecture’s business and leisure demand. Above ¥20,000, by contrast, there are just two properties with 247 rooms, Aoawo Naruto Resort (208 rooms) and Naruto Grand Hotel Kaigetsu (39 rooms), both coastal resorts in Naruto.
In between, ¥8,000–10,000 has 6 properties with 867 rooms and ¥10,000–15,000 has 7 properties with 704 rooms. And the ¥15,000–20,000 band has not a single property with 30+ rooms. In the capital, Tokushima City, only one property of about 19 rooms among 42 properties (3,085 rooms) exceeds ¥15,000, and none exceeds ¥20,000.
Crowded Under ¥8,000 × Large scale
46 properties, 3,491 rooms (65.8%)
Limited-service chains are stacked deep here, an established band that absorbs everyday business and leisure demand. Opportunities for new entrants remain largely in the higher bands.
Gap 1 ¥10,000–15,000 × 30+ rooms
7 properties, 704 rooms (13.3%)
Of these, 457 rooms belong to two large city/business hotels in Tokushima City. Even widening to 15+ rooms, ryokan and resorts that sell the stay experience account for only 7 properties and 243 rooms in this band.
Gap 2 ¥15,000–20,000 × 30+ rooms
0 properties, 0 rooms
Widening to 15+ rooms adds 4 properties with 95 rooms, all under 30 rooms (24 rooms on average). No operator has yet combined economies of scale with upper-band rates here.
Is There Demand in the Gap? — Testing with Inventory Sell-Through on a Normal Weekend
An empty price band alone is no reason to invest. We checked whether demand is arriving there using inventory sell-through based on remaining rooms. For September 4–6, 2026, a closed, normal weekend with no events, we measured the lead time at which each property’s remaining inventory first reached 0 rooms (early sell-out LT). Only properties whose public allotment on major booking sites is at least 30% of total rooms were included; 118 of 611 properties met this condition.
| Est. settled ADR band | Properties | Sold out 15+ days before stay | Share |
|---|---|---|---|
| Under ¥6,000 | 10 | 2 | 20.0% |
| ¥6,000–8,000 | 18 | 2 | 11.1% |
| ¥8,000–10,000 | 6 | 2 | 33.3% |
| ¥10,000–15,000 | 7 | 4 | 57.1% |
| ¥15,000 and above | 7 | 3 | 42.9% |
The sample is small, but the pattern is consistent. In the ¥10,000–15,000 band, 4 of 7 properties (57.1%) reached 0 remaining rooms 15+ days before the stay date, far above 11.1% in the ¥6,000–8,000 band. Higher-rate bands filling faster is consistent with supply in this band being thin relative to demand.
The seasonal peak points the same way. Over the four days of the Awaodori festival, August 12–15, 2026, 64 of the 65 qualifying properties sold out on at least one day, and the top properties were at 0 remaining rooms from 45+ days before the stay date. Awaodori, however, is a four-day outlier in the year; for a year-round investment case, sell-through speed on normal weekends and weekdays matters more. Inventory progress during Awaodori itself is analyzed in detail in Awaodori 2026: 98.8% Sold 45 Days Out.
| Month | Properties | Rooms | All properties OCC | Business | Ryokan |
|---|---|---|---|---|---|
| Jun 2026 | 75 | 3,519 | 79.6% | 83.4% | 68.1% |
| Jul 2026 | 79 | 3,658 | 79.7% | 80.6% | 73.0% |
| Aug 2026 | 77 | 3,585 | 87.4% | 88.2% | 82.6% |
Business hotels at around 80% and ryokan at 68–83% are solid levels for a regional prefecture. Ryokan in particular moved 14.5 points, from 68.1% in June to 82.6% in August, showing wide seasonal swings. Put the other way, off-season rate design is an area with room to grow.
Supply Pipeline — 318 New Rooms in 40 Properties over Three Years, 125 of Them in One Project
Whether there is room to enter the gap depends on what supply is doing. Within MetroEngines Research & Consulting’s coverage, Tokushima Prefecture has 521 lodging properties with 9,892 rooms (confirmed via major booking-site listings). New openings over the last three years are as follows.
| Year opened | Properties | Rooms | Per property | Projects with 20+ rooms |
|---|---|---|---|---|
| 2024 | 14 | 86 | 6.1 | None |
| 2025 | 13 | 38 | 2.9 | None |
| 2026 | 13 | 194 | 14.9 | COZY COMFORTS HOTEL (125 rooms, Tokushima City) |
The three-year total is 40 properties with 318 rooms, just 3.2% of the existing 9,892-room stock, and most are small properties of a few rooms each, such as vacation rentals, minshuku and guesthouses. Of the 194 rooms in 2026, 125 come from a single project, COZY COMFORTS HOTEL, which opened in central Tokushima City in August. According to a Tokushima Shimbun report, the project uses the prefecture’s lodging facility investment promotion subsidy.
To look further down the pipeline, we also queried building-plan data based on MLIT’s Building Construction Statistics, and found zero hotel construction plans in Tokushima Prefecture (89 nationwide). An important caveat applies: building-permit applications are usually filed one to two years before opening, so this zero does not mean future supply will vanish. It is only the lower bound of the confirmed pipeline as of the survey date, and the count is expected to rise as new applications are filed.
Even so, 318 rooms over three years on an actual basis, with only one project of 20+ rooms in that time, shows that Tokushima’s hotel investment market is fought mainly over reshaping existing stock, not over new builds. Annual supply of 1–2% against 9,892 existing rooms means little competitive pressure, which works in favor of repositioning existing properties. For when regional cities’ existing stock was built, 226k Hotel Rooms in 32 Regional Cities examines the room for renewal.
Location Assessment — A 6.7x Land Price Gap and Tsunami Scenarios Split Conditions Between Coastal and Inland Business Locations
Investment conditions in Tokushima differ sharply between business-oriented properties in the capital and resort properties on the coast and in the gorges. Start with land cost. According to MLIT’s Real Estate Information Library, 2026 official land prices for commercial land in central Tokushima City have a median of ¥157,000 per ㎡ across 11 sites, with the highest at ¥377,000 in Ichibancho 3-chome (+1.3% YoY). Commercial land in Naruto City, by contrast, is ¥56,300 (−0.9%), and in Ikeda Town, Miyoshi City, ¥46,200 (−2.1%). The gap between Tokushima City’s highest site and Naruto’s commercial land reaches 6.7x.
| Tokushima City commercial (median of 11 sites) | ¥157,000 |
| Highest site (Ichibancho 3-chome) | ¥377,000 +1.3% |
| Tokushima City residential (median of 12 sites) | ¥104,650 +1.0% |
| Naruto City commercial | ¥56,300 −0.9% |
| Anan City commercial (median of 2 sites) | ¥64,700 −0.4% |
| Ikeda Town, Miyoshi City commercial | ¥46,200 −2.1% |
| Around Tokushima Station | Commercial zone, FAR 400–600% / BCR 80% |
| Around Naruto Station | Commercial 400%, neighborhood commercial 300% / BCR 80% |
| Tokushima Sta.: establishments | 2,798 |
| Employees / office-type share | 25,459 / 24.7% |
| Naruto Sta.: establishments | 696 |
| Employees / office-type share | 5,662 / 8.9% |
The employment data show the depth of business demand around Tokushima Station. Within a 1km radius there are 2,798 establishments and 25,459 employees, with an office-type share of 24.7%, ample as a base for weekday business demand. Around Naruto Station there are 696 establishments and 5,662 employees, with an office-type share of 8.9%, pointing to a structure that relies more on leisure demand than business demand. Note that the area around Naruto Park (the center of Onaruto Bridge and whirlpool sightseeing) is not included in the Economic Census small-area data, so employment data for that area are not used as evidence of demand.
Resident population is shrinking in both areas. According to MLIT’s National Land Numerical Information future population estimates by 250m mesh, the resident population within 1.5km of Tokushima Station is projected to fall 16.4%, from 31,635 in 2025 to 27,523 in 2040, with a 33.1% share of seniors in 2025. Within 1.5km of Naruto Station, it falls 24.0%, from 14,632 to 11,782 (34.9% seniors), an even faster decline. This matters when setting assumptions for F&B and banquet revenue that depend on local spending.
Disaster conditions are the biggest factor separating the investment assumptions for coastal and inland locations. Under the Tokushima Prefecture tsunami inundation scenario published in March 2025, the maximum-class Nankai Trough scenario puts the inundated area at 57.5㎢ in Tokushima City and 35.3㎢ in Naruto City (Naruto’s inundated area is about 21.0% smaller than in the FY2012 scenario). In addition, MLIT Real Estate Information Library landform data classify 24 of the 25 meshes around Tokushima Station as “delta and coastal lowland,” a category prone to liquefaction. In storm-surge inundation scenarios, the most common depth band around Tokushima Station is 3m to under 5m, and around Naruto Station 0.5m to under 1m.
| Investment type | Representative area | Rate level | Land cost | Demand structure | Key considerations |
|---|---|---|---|---|---|
| Inland business | Central Tokushima City | Est. settled ADR ¥6,364; thin upper bands | Commercial median ¥157,000/㎡ (rising) | Weekday demand from 2,798 establishments and 25,459 employees | Liquefaction and storm-surge scenarios; using FAR of 400–600% |
| Coastal resort | Naruto City | Est. settled ADR ¥7,968; two properties above ¥20,000 | Commercial ¥56,300/㎡ (flat to slightly down) | Leisure demand from the whirlpools and Onaruto Bridge; thin on weekdays | Tsunami inundation of 35.3㎢; high-ground and upper-floor evacuation plans |
| Inland gorge | Miyoshi City / Mima City | Est. settled ADR ¥9,004 / ¥8,355 (highest in prefecture) | Commercial ¥46,200/㎡ (declining) | Touring demand for Iya and Oboke; strong inbound affinity | Access, staffing, high fixed-cost ratio due to small scale |
Three Scenario Models — New Builds Need ¥31,000 ADR, Repositioning Yields 10%+
Using the measurements so far, we model three investment scenarios plausible in Tokushima City and Naruto City. The bottom line: filling the gap with a new build hardly pencils out at current rate levels, and repositioning existing stock is far more favorable.
■ Model Assumptions
- Land cost: 2026 official land price median for commercial land in Tokushima City, ¥157,000/㎡ (MLIT Real Estate Information Library, 11 sites). Site area assumed at 600㎡.
- Construction cost (2025 actuals): Steel frame ¥2.405 million/tsubo, RC ¥2.026 million/tsubo. ¥2.4 million/tsubo adopted for a mid to upper-midscale hotel.
- Construction-cost inflation: +5.3% in 2026, +5.0% in 2027, +4.5% in 2028 (Turner & Townsend construction cost forecast), compounded to the construction midpoint. Scenario A assumes a 2029 opening (midpoint 2028, cumulative +15.5%); B and C assume a 2028 opening (midpoint 2027, cumulative +10.6%).
- Room size and efficiency: 25㎡ per room, guestroom share 60% (gross floor area = rooms × 25㎡ ÷ 0.6).
- Occupancy: 75% for the new build and the renovated existing hotel, 60% for the ryokan. Set as conservative first-year values, using our estimated June–August 2026 occupancy for Tokushima (79.6–87.4% for all properties) as an upper reference.
- GOP margin: 35% for the new midscale build, 32% for the renovated limited-service hotel, 30% for the ryokan. Conservative values reflecting regional and first-year conditions, with the 38.9% GOP margin disclosed by Invincible Investment Corporation for 91 MHM-operated properties (FY ended December 2024) as an upper reference.
- ADR assumptions: Set within the price bands measured in this article (estimated settled ADR basis). ¥15,000 for the new build, ¥12,000 after renovation and ¥20,000 for the ryokan are all levels that exist in the prefecture.
- Exclusions: Pre-opening costs, working capital, FF&E reserves and interest are not included. This is a simplified model; actual investment decisions require a detailed feasibility study.
| Item | A. New midscale build (Tokushima City) | B. Existing-hotel repositioning Recommended | C. Upgrading a small ryokan |
|---|---|---|---|
| Rooms | 40 | 50 | 20 |
| Assumed ADR (est. settled basis) | ¥15,000 | ¥6,500 → ¥12,000 | ¥20,000 |
| Assumed occupancy | 75% | 80% → 75% | 60% |
| Land / acquisition cost | ¥94 million | ¥300 million | ¥100 million |
| Construction / renovation cost (2025 prices) | ¥1.210 billion | ¥175 million | ¥120 million |
| Same, after construction-cost inflation | ¥1.398 billion | ¥193 million | ¥133 million |
| Total investment (after inflation) | ¥1.492 billion | ¥493 million | ¥233 million |
| Investment per room | ¥37.31 million | ¥9.87 million | ¥11.63 million |
| Assumed annual revenue (rooms only) | ¥164 million | ¥95 million → ¥164 million | ¥88 million |
| Assumed GOP | ¥57 million | ¥30 million → ¥53 million | ¥26 million |
| GOP yield | 3.9% | 10.7% | 11.3% |
| Payback period (GOP basis) | 26.0 years | 9.4 years | 8.9 years |
Scenario A is a 40-room new build targeting ¥15,000, the empty band. For a gross floor area of 1,667㎡ (504 tsubo), construction costs ¥1.210 billion at 2025 prices, or ¥1.398 billion after construction-cost inflation. Against a total investment of ¥1.492 billion including land, GOP is ¥57 million, and GOP yield is just 3.9%. Even if the prefecture’s lodging facility investment promotion subsidy (capped at ¥100 million) could be applied in full, the yield would only reach 4.1%. Moreover, under the published FY2025 requirements, the subsidy requires 50+ new rooms or capacity for 100+ new guests, ¥500 million+ in fixed-asset investment, an average room size of 20㎡+ (15㎡+ for corporations or sole proprietors headquartered in the prefecture), and 5+ new local hires, so a 40-room plan does not meet the room-count requirement in the first place. Working backward, a new build of this size needs an estimated settled ADR of about ¥31,100 to secure an 8% yield, above even the Naruto coastal resort (¥27,089) that ranks highest among properties with 30+ rooms in the prefecture. This figure explains why there are zero construction plans in Tokushima.
Scenario B, by contrast, assumes acquiring an existing 50-room limited-service hotel at ¥6 million per room and spending ¥3.5 million per room on renovation to lift ADR from the ¥6,500 band to the ¥12,000 band. Against a total investment of ¥493 million (¥9.87 million per room), GOP is ¥53 million, a 10.7% yield. Annual GOP rises by ¥22 million, and it achieves the same revenue level as the new build for about one-third of the investment. Investment per room is only 26% of the new build’s.
Scenario C assumes acquiring a 20-room small ryokan in Miyoshi, Naruto, Kaiyo or similar areas and spending ¥6 million per room to lift it into the ¥20,000 band. Total investment is ¥233 million, for a 11.3% yield. Only two properties with 247 rooms exceed ¥20,000 in the prefecture, so thin competition translates into pricing freedom.
| Sensitivity | Base case | ADR −10% | Occupancy −5pt | Both |
|---|---|---|---|---|
| A. New midscale build (40 rooms) | 3.9% | 3.5% | 3.6% | 3.2% |
| B. Existing-hotel repositioning (50 rooms) | 10.7% | 9.6% | 9.9% | 8.9% |
| C. Small ryokan (20 rooms) | 11.3% | 10.2% | 10.4% | 9.3% |
In the sensitivity analysis, both B and C hold yields of around 9% even if a 10% ADR drop and a 5pt occupancy drop happen at the same time. The gap with the new build (3.9%) is structural and does not reverse even if the assumptions shift somewhat.
Two-Way Sensitivity of ADR × Occupancy — Where the Recommended Scenario Holds
Single-variable sensitivity does not show which combinations the model can withstand. For recommended Scenario B (existing 50-room limited-service hotel, total investment ¥493 million, 32% GOP margin), the table below shows GOP yield across both estimated settled ADR and occupancy. The shaded cell is the base assumption in the text (ADR ¥12,000, occupancy 75%).
| Occupancy \ ADR | ¥10,000 | ¥11,000 | ¥12,000 | ¥13,000 | ¥14,000 |
|---|---|---|---|---|---|
| 65% | 7.7% | 8.5% | 9.2% | 10.0% | 10.8% |
| 70% | 8.3% | 9.1% | 10.0% | 10.8% | 11.6% |
| 75% | 8.9% | 9.8% | 10.7% | 11.5% | 12.4% |
| 80% | 9.5% | 10.4% | 11.4% | 12.3% | 13.3% |
| 85% | 10.1% | 11.1% | 12.1% | 13.1% | 14.1% |
Read as a surface, Scenario B secures a yield of 8% or more in 24 of the 25 combinations. The estimated settled ADR needed for 8% is about ¥9,000 at 75% occupancy, falling to about ¥7,900 at 85%, which is not far from Tokushima City’s current ¥6,364. In contrast, new-build Scenario A needs an estimated settled ADR of about ¥31,100 to reach the same 8%, above even the prefecture’s top-ranked Naruto coastal resort at ¥27,089. For the same 8% hurdle, the required ADR differs by 3.5x, and that is what underpins this article’s conclusion.
Investment Summary — From “Filling the Gap with New Builds” to “Lifting Existing Stock into the Gap”
Here is Tokushima’s hotel investment environment, summarized from the measurements in this article.
Opportunity 1: Upgrading existing limited-service hotels
3,491 rooms are concentrated below ¥8,000, while in the ¥10,000–15,000 band 57.1% of properties sold out 15+ days before the stay date on a normal weekend. The upside of lifting existing stock into this band can be quantified as a 10.7% yield on an investment of ¥9.87 million per room.
Opportunity 2: Scaling up in the ¥15,000–20,000 band
Zero rooms among properties with 30+ rooms, and only 4 properties with 95 rooms (24 rooms on average) even when widened to 15+ rooms. No operator yet serves this band with 30–50 rooms, leaving a first-mover advantage for whoever combines economies of scale with upper-band rates.
Opportunity 3: Off-season rate design
Estimated ryokan occupancy moves 14.5 points, from 68.1% in June 2026 to 82.6% in August (estimates based on OTA-listed inventory). There is room to reduce reliance on the four days of Awaodori and refine rate design for normal weekends and weekdays.
| Risk factor | Details | How to reflect it in the investment decision |
|---|---|---|
| Construction costs | ¥2.405 million/tsubo (steel frame) in 2025 actuals; forecast to rise 4.5–5.3% a year in 2026–2028 | Squeezes new-build economics, but also restrains new supply and eases competition for existing properties |
| Disaster scenarios | Maximum-class Nankai Trough scenario inundates 57.5㎢ in Tokushima City and 35.3㎢ in Naruto City; the Tokushima Station area is on liquefaction-prone landforms | Reflect evacuation routes to upper floors, emergency power and insurance costs in the business plan |
| Catchment population | Population within 1.5km of Tokushima Station falls 16.4% by 2040, and 24.0% within 1.5km of Naruto Station | Reduce reliance on banquets and local F&B; shift toward a rooms-driven revenue structure |
| Demand seasonality | Estimated ryokan occupancy differs by 14.5 points between June and August | Build off-season product and rate design into the plan and test yields on an annual average |
| Market size | 521 properties with 9,892 rooms in the prefecture, of which 61 properties with 5,309 rooms have 30+ rooms; limited supply of assets | Acquisition opportunities are few; continuous sourcing of candidate properties is a prerequisite |
In short, Tokushima is not “a market to fill the gap with new builds” but “a market to lift existing stock into the gap.” The new 40-room build modeling at a 3.9% yield and needing ¥31,100 ADR is consistent with there being zero construction plans. Repositioning existing stock, on the other hand, holds yields around 9% even in the sensitivity analysis, and requires about one-third of the investment of a new build.
A realistic sequence of next steps is: (1) sourcing aged limited-service hotels with 30–60 rooms and ryokan in coastal and gorge areas, (2) testing each candidate’s room for rate increases by checking its estimated settled ADR against its inventory sell-through record, and (3) scrutinizing renovation specifications and costs in light of tsunami and liquefaction scenarios.
⚠ About the model figures: The investment scenarios in this article are simplified models based on the conditions listed in “■ Model Assumptions.” Actual investment decisions require property-specific due diligence and a detailed feasibility study. Estimated settled ADR is estimated from information listed on major booking sites and differs from each property’s actual settled prices and accounting figures.
Related Reading
- 226k Hotel Rooms in 32 Regional Cities: 42.7% Built Before 1996
- Awaodori 2026: 98.8% Sold 45 Days Out — 39.4pt Over Normal Weekends
References and Sources
■ Data Sources
Listings on major booking sites are collected daily, and estimated settled ADR and inventory sell-through metrics are calculated from each property’s daily listed prices and remaining rooms. The period covered is the 12 months from September 2025 to August 2026 (all past, closed months). In Tokushima Prefecture, the monthly average number of properties covered is 218 on a listed-price basis and 141 on an estimated settled ADR basis. The price-band map is built on 100 properties (6,167 rooms) with estimated settled ADR for 6+ of the last 12 months, narrowed by room count to 61 properties (5,309 rooms) with 30+ rooms. Inventory sell-through covers August 12–15, 2026 (Awaodori) and September 4–6 (a normal weekend), counting only properties whose public allotment is at least 30% of total rooms.
■ Model Assumptions
Assumptions for the investment scenarios (land cost, construction cost, construction-cost inflation, room size, occupancy, GOP margin, assumed ADR, exclusions) are listed under “■ Model Assumptions” in the text. GOP yield = rooms × ADR × occupancy × 365 days × GOP margin ÷ total investment (after construction-cost inflation); payback period = total investment ÷ assumed GOP. The sensitivity analysis and the two-way sensitivity table use the same formula, recalculated by varying only ADR and occupancy. Interest, taxes, pre-opening costs, working capital and FF&E reserves are excluded.
■ Limitations and Caveats
Estimated settled ADR is estimated from listing information and differs from each property’s actual settled prices and accounting figures (median error of about 7% against property-level disclosures by listed hotel REITs). Occupancy is an estimate based on listed inventory in the area and differs from a property’s actual overall occupancy. Among municipal rates, municipalities with fewer than 5 properties covered for estimated settled ADR (Tsurugi Town, Kamikatsu Town and others) are not used for rate comparison, because the figures would measure property mix rather than the local price level; they are treated as reference values on a listed-price basis. Building-plan data are a lower bound based on permit applications, and zero in the prefecture does not mean there will be no future supply. The four-prefecture Shikoku comparison is a relative comparison on the same definition and period, and does not adjust for differences in each prefecture’s property mix (segment and location breakdown).
■ Market Data
- MetroEngines Research & Consulting — Estimated settled ADR and listed prices (Tokushima Prefecture N = 242 properties / 30+ rooms N = 61 properties, 5,309 rooms), inventory sell-through analysis based on remaining-room trends, estimated occupancy, new-opening data (confirmed via major booking-site listings)
- Compiled by MetroEngines Research & Consulting from MLIT “Building Construction Statistics” — building-plan data (0 in Tokushima Prefecture, 89 nationwide)
■ Government and Municipal Statistics
- MLIT Real Estate Information Library — Official land prices and prefectural land price surveys, city planning decisions (zoning), landform classification (liquefaction susceptibility), storm-surge inundation zones, flood inundation zones
- MLIT National Land Numerical Information “Future Population Estimates by 250m Mesh (FY2024 National Policy Bureau estimates)”
- MIC & METI “Economic Census for Business Activity (2021)” / boundaries = 2020 Census small areas (e-Stat Statistical GIS)
- Tokushima Prefecture “Publication of the Tokushima Prefecture Tsunami Inundation Scenario” (March 2025)
- Naruto City “Damage Estimates for a Nankai Trough Megathrust Earthquake”
■ Basis for Investment Assumptions
- MLIT “Building Construction Starts Statistics” — hotel construction cost per tsubo (2025 actuals: steel frame ¥2.405 million/tsubo, RC ¥2.026 million/tsubo)
- Turner & Townsend construction cost forecast — +5.3% in 2026, +5.0% in 2027, +4.5% from 2028
- Invincible Investment Corporation disclosures — 38.9% GOP margin for 91 MHM-operated properties (FY ended December 2024; upper reference for conservative assumptions)
- Hojyokin Portal “Tokushima Prefecture Lodging Facility Investment Promotion Subsidy (FY2025)” — capped at ¥100 million; requirements include 50+ new rooms or capacity for 100+ new guests and ¥500 million+ in fixed-asset investment
■ News Reports