

Cruise ship port calls in Japan have hit a new record. But there is a clear gap between “more port calls” and “full hotels in port cities.” On a transit call made mid-itinerary, passengers come ashore during the day and return to the ship in the evening to sleep on board. Onshore room demand comes from turnaround calls, where passengers embark and disembark. In this article we look at transport hubs through the lens of seaports — not airports, rail stations or expressway interchanges — and, focusing only on the turnaround function, work backward to estimate in room terms how much pre- and post-cruise lodging demand a single turnaround generates.
To avoid overlap with our other analyses, let us draw the boundaries first. The ports covered in our analysis of extended-stay demand from construction projects are offshore wind base ports, where demand comes from construction workers on long consecutive stays. Here, demand comes from cruise passengers and crew staying one or two nights before or after a voyage. Our piece on international catchments around regional airports covers airline seat supply, and our remote-island resort article covers added flights — both are air hubs. Our earlier article Record 3,117 Cruise Calls: Hotel Capacity at Japan’s Top 10 Ports measured capacity depth by dividing each host city’s total room count by its number of port calls. This article instead uses only turnaround calls as the denominator and builds up pre- and post-cruise room demand from actual passenger counts. We re-measure room stock within a 5km radius of each passenger terminal’s coordinates, and go further into the price-band distribution and the employment and residential makeup around the terminals.
Metric Definitions Used in This Article
- ADR (Average Daily Rate): An estimated settled rate (tax-excluded equivalent), calculated by applying property-type correction factors to the lowest plan price each property publishes on OTAs (per room, 2 guests, tax included). Validated against property-level results disclosed by listed hotel REITs (91 properties, most recent 3 months), the median error is approximately 7%. These are estimates and differ from each property’s actual settled prices and accounting figures. Area-level ADR is the median of the target properties (the level of a typical property in the area).
- Listed price: The average price of all plans published on OTAs (per room, 2 guests, tax included). Because it covers everything from room-only to meal-inclusive plans, it runs higher than the estimated settled ADR. It is treated as a separate metric from ADR.
- OCC (Occupancy Rate): The share of rooms sold relative to total rooms in the area (an estimate based on OTA sales inventory). Used only at the prefecture level.
- Turnaround: A port call at which passengers embark and disembark. On a transit call, passengers sleep on board, so onshore lodging demand generally does not arise.
- Pre/post-stay rate: The share of embarking passengers who stay near the embarkation port the night before or after the cruise. This is an assumed value in this article, not a measured one.
- Data sources: Port calls and passenger numbers = Ports and Harbours Bureau, Ministry of Land, Infrastructure, Transport and Tourism (MLIT) / Yokohama turnaround results = Port and Harbor Bureau, City of Yokohama / Room stock, prices and occupancy = MetroEngines Research & Consulting / Surrounding population = MLIT National Land Numerical Information / Surrounding employment = Ministry of Internal Affairs and Communications and Ministry of Economy, Trade and Industry, Economic Census
Key Takeaways
- Of Yokohama Port’s 143 port calls in 2024, 97.3% were turnarounds, with 400,564 embarking and disembarking passengers (City of Yokohama Port and Harbor Bureau). It is the only major port that publishes its turnaround ratio.
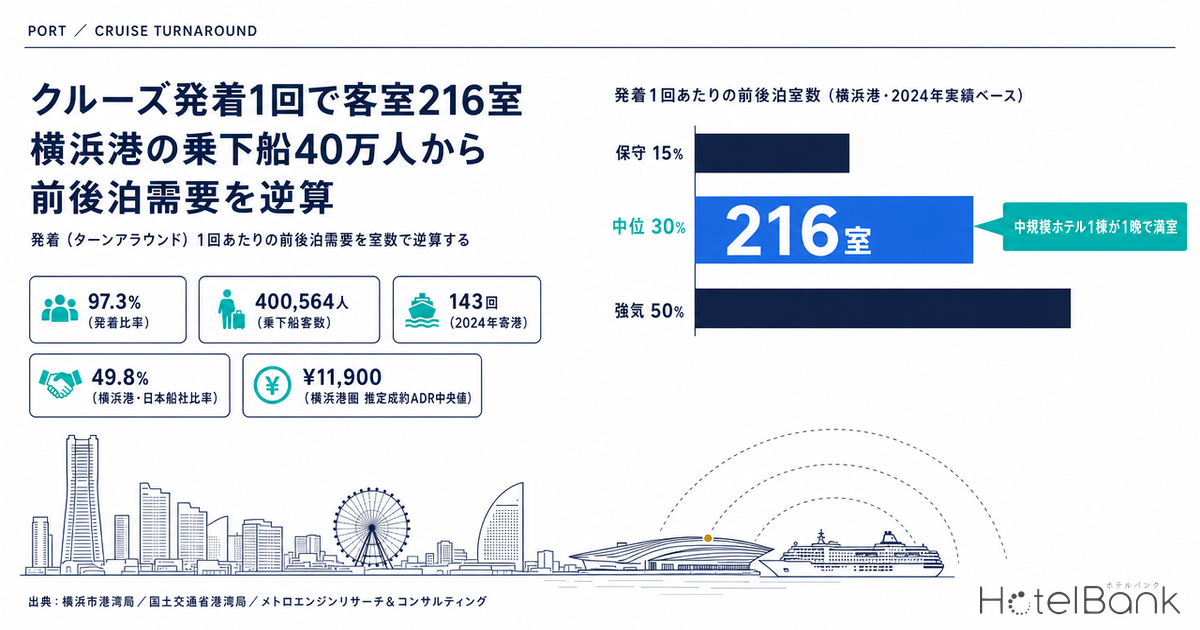
- Working backward from these figures, pre- and post-cruise demand per turnaround is 216 rooms in the mid-case scenario — enough to fill a mid-sized hotel for a night, on every turnaround day.
- Splitting ports by the share of calls by Japanese cruise lines, Yokohama (49.8%) and Kobe (30.3%) are turnaround-type ports, while the remaining eight, at 2.0–8.8%, are transit-type. Even among the “top ports by calls,” the nature of demand differs.
- Room stock within 5km of the terminals at the 10 major ports totals N=2,509 properties and 158,668 rooms. The two turnaround-type ports (Yokohama and Kobe) account for 40,993 rooms.
- The share of properties with an estimated settled ADR of ¥18K or more is 26.5% around Hakata Port and 22.9% around Yokohama Port, versus 0.0% around Sasebo and Shimizu ports. The more a port’s turnaround function grows, the more room there is to grow in the upper price bands.
Port Calls and Turnarounds Are Different Metrics — The Share of Japanese Cruise Lines Splits Ports into Two Groups
According to preliminary 2025 figures published by the MLIT Ports and Harbours Bureau on February 20, 2026, cruise ships made 3,117 calls at Japanese ports (2,352 by ships operated by foreign cruise lines and 765 by ships operated by Japanese cruise lines), inbound cruise passengers numbered 1.767 million, and foreign cruise ships called at 93 ports. However, the 3,117 figure cannot be used as a proxy for lodging demand as it stands, because passengers on transit calls sleep on board.
The published materials do not break down turnaround calls by port. As an external proxy, we therefore use the share of calls made by ships operated by Japanese cruise lines. According to the notes in the same materials, Japanese cruise line ships comprise five vessels — NYK Cruises’ Asuka II and Asuka III, MOL Cruises’ Nippon Maru and MITSUI OCEAN FUJI, and Setouchi Cruise’s guntû — all of which operate primarily on cruises that begin and end in Japan. Ports with a heavy share of Japanese-line calls can thus be read as having a stronger turnaround-port character.
Subtracting foreign-line calls from each port’s total calls to derive Japanese-line calls, Yokohama Port had 104 of 209 calls (49.8%) and Kobe Port 43 of 142 (30.3%). By contrast, the remaining eight ports were all below 10%: Naha 8.8%, Hakata 8.6%, Ishigaki 6.9%, Hiroshima 5.7%, Shimizu 5.7%, Kagoshima 5.4%, Sasebo 4.7% and Nagasaki 2.0%. They all rank among the top 10 by port calls, but in terms of the nature of demand, Yokohama and Kobe form an entirely different market from the other eight.
Source: Compiled by MetroEngines Research & Consulting from MLIT Ports and Harbours Bureau, “Inbound Cruise Passengers and Cruise Ship Port Calls (Preliminary 2025 Figures),” published February 20, 2026
Yokohama Port’s Turnaround Record — Primary Data: 97.3% of 143 Calls, 400,000 Embarking and Disembarking Passengers
One port publishes its own turnaround ratio. “Outlook for Yokohama Port as a Cruise Hub Port,” submitted by the City of Yokohama Port and Harbor Bureau to an MLIT meeting on April 25, 2025, reports Yokohama’s port call record as 143 calls (4th in Japan), of which 97.3% were turnarounds and 2.7% transit calls. The same document’s passenger trend shows 400,564 embarking and disembarking passengers in 2024. That is short of the pre-COVID 527,691 in 2019, but has recovered to above the 369,076 recorded in 2018. The document breaks calls down by pier — Osanbashi Pier 95, Shinko Pier 38 and Daikoku Pier 14 — and the port can berth up to seven ships simultaneously across its three passenger terminals.
Source: Compiled by MetroEngines Research & Consulting from City of Yokohama Port and Harbor Bureau, “Outlook for Yokohama Port as a Cruise Hub Port” (April 25, 2025)
This 97.3% ratio is a defining feature of Yokohama Port compared with other ports. The document cites Yokohama’s advantages: proximity to the mouth of Tokyo Bay, which saves fuel costs and embarkation/disembarkation time; proximity to Haneda Airport, which makes fly-and-cruise viable; and a hinterland market of 40 million people, which enables drive-and-cruise. In addition to Asuka II (passenger capacity 872), which is registered in Yokohama, the document lists Asuka III (52,000 gross tons, passenger capacity approx. 740), scheduled to debut on July 20, 2025 — the capacity for turnarounds itself is growing.
The document also explicitly addresses the link to lodging. Under “initiatives to encourage stays in the city before and after cruises,” it sets out the promotion of overnight stays in Yokohama, noting that the recent wave of international hotel openings around the terminals has made pre- and post-cruise stays more convenient and helps stimulate pre- and post-cruise demand. The Shinko Pier Passenger Terminal was developed as a mixed-use terminal integrated with a hotel. The fact that the port authority has positioned lodging as one of its own policy themes means that, for developers, the preconditions for securing sites and negotiating with the city on hotel attraction are falling into place.
Pre- and Post-Cruise Demand from a Single Turnaround — 216 Rooms in the Mid Case
This is the core of the article. Using Yokohama Port’s actual figures, we convert pre- and post-cruise demand per turnaround into rooms. The procedure is simple: divide the 400,564 embarking and disembarking passengers in 2024 by the number of turnarounds, isolate the embarking side, then convert to rooms using the pre/post-stay rate and guests per room.
1. Turnarounds = 143 calls × 97.3% = 139 turnarounds (2024)
2. Embarking and disembarking passengers per turnaround = 400,564 ÷ 139 = 2,882 passengers
3. Of which embarking (= candidates for a pre-cruise stay) = 2,882 ÷ 2 = 1,441 passengers
4. Pre/post-stay rooms = 1,441 × pre/post-stay rate ÷ 2.0 guests/room × nights
The pre/post-stay rate is an assumption. Embarking and disembarking passengers include a substantial number of Tokyo-area residents who return home the same day, so not everyone stays overnight. Conversely, international visitors who fly to Japan to join a cruise departing from Japan almost certainly stay the night before. According to MLIT, inbound cruise passengers using such Japan-departure cruises reached a record 181,000 in 2025, roughly double the pre-COVID peak. We therefore set three scenarios — conservative 15%, mid 30% and optimistic 50% — and present the results as a range.
| Scenario | Pre/post-stay rate | Per turnaround | Annual room nights (2024, 139 turnarounds) | Daily average | Annual room nights (2025, est. 203 turnarounds) | Daily average |
|---|---|---|---|---|---|---|
| Conservative | 15% | 108 rooms | 15,021 room nights | 41 rooms | 21,939 room nights | 60 rooms |
| Mid | 30% | 216 rooms | 30,042 room nights | 82 rooms | 43,878 room nights | 120 rooms |
| Optimistic | 50% | 360 rooms | 50,070 room nights | 137 rooms | 73,131 room nights | 200 rooms |
Embarking/disembarking passengers and turnaround ratio = City of Yokohama Port and Harbor Bureau (2024 results) / 209 port calls in 2025 = MLIT Ports and Harbours Bureau preliminary 2025 figures. The estimated 2025 turnaround count is a reference value applying the 2024 turnaround ratio of 97.3%. Calculated at 2.0 guests per room and 1 night. Pre/post-stay rates are assumptions. Source: MetroEngines Research & Consulting
It is worth putting the mid-case figure of 216 rooms into perspective. That is enough to fill a mid-sized business hotel for one night on a turnaround day. Averaged over the year, it works out to 82 rooms per day (2024 basis), but because demand concentrates on turnaround days, the height of each individual peak matters more operationally than the smoothed figure. Applying the same turnaround ratio to 2025’s 209 port calls gives an estimated 203 turnarounds, raising annual room-night demand in the mid case to 43,878 room nights, equivalent to a daily average of 120 rooms.
Source: Compiled by MetroEngines Research & Consulting from City of Yokohama Port and Harbor Bureau (2024 embarkation/disembarkation results) / MLIT Ports and Harbours Bureau (preliminary 2025 figures)
Let us check how much the results move depending on the assumptions. The sensitivity table below varies guests per room from 1.8 to 2.2 and length of stay from 1 to 2 nights. In the mid case (30% pre/post-stay rate), the range is 197 to 432 rooms. Uncertainty in the pre/post-stay rate itself is the largest factor; variation in guests per room is relatively small.
| Pre/post-stay rate | 1.8 guests/room, 1 night | 2.0 guests/room, 1 night | 2.2 guests/room, 1 night | 2.0 guests/room, 1.5 nights | 2.0 guests/room, 2 nights |
|---|---|---|---|---|---|
| 15% (conservative) | 120 rooms | 108 rooms | 98 rooms | 162 rooms | 216 rooms |
| 30% (mid) | 240 rooms | 216 rooms | 197 rooms | 324 rooms | 432 rooms |
| 50% (optimistic) | 400 rooms | 360 rooms | 328 rooms | 540 rooms | 721 rooms |
Pre- and post-cruise rooms per turnaround, estimated for 1,441 embarking passengers (derived from Yokohama Port’s 2024 results). Pre/post-stay rate, guests per room and number of nights are all assumptions. Source: MetroEngines Research & Consulting
It also helps to have a benchmark from the ship side. Among Japanese cruise line vessels, Asuka II has a passenger capacity of 872 and Asuka III approx. 740, according to the City of Yokohama Port and Harbor Bureau document. MITSUI OCEAN FUJI, as published by MOL Cruises, carries 458. At a 30% pre/post-stay rate, 2.0 guests per room and 1 night, that converts to 131 rooms for Asuka II, 111 rooms for Asuka III and 69 rooms for MITSUI OCEAN FUJI. Even as ships get smaller, each vessel generates demand of several dozen to more than a hundred rooms.
| Ship | Passenger capacity | Conservative 15% | Mid 30% | Optimistic 50% |
|---|---|---|---|---|
| Asuka II (飛鳥Ⅱ) | 872 | 65 rooms | 131 rooms | 218 rooms |
| Asuka III (飛鳥Ⅲ) | approx. 740 | 56 rooms | 111 rooms | 185 rooms |
| MITSUI OCEAN FUJI | 458 | 34 rooms | 69 rooms | 115 rooms |
Passenger capacity: Asuka II and Asuka III = City of Yokohama Port and Harbor Bureau, “Outlook for Yokohama Port as a Cruise Hub Port” (April 25, 2025); MITSUI OCEAN FUJI = figure published by MOL Cruises. Converted at 2.0 guests per room and 1 night. Capacity figures assume a full ship and differ from actual passenger counts. Source: MetroEngines Research & Consulting
Room Stock Within 5km of the Terminals — 158,668 Rooms Across 10 Ports
With the demand side estimated, we now measure the supply side. Rather than using each host city’s total room count, we re-measured stock within a 5km radius of each passenger terminal’s coordinates. Because proximity to the embarkation port drives the choice of a pre- or post-cruise stay, distance from the port is more meaningful in practice than administrative boundaries. Within 5km of the terminals at the 10 major ports, there are N=2,509 properties and 158,668 rooms, counting only properties with a registered room count in our property master.
| Port | City | 2025 total calls | Foreign lines | Japanese lines | Japanese-line share | Properties within 5km | Rooms within 5km | 100+ rooms | Median est. settled ADR | Pref. OCC Jul 2026 |
|---|---|---|---|---|---|---|---|---|---|---|
| Yokohama | Yokohama | 209 | 105 | 104 | 49.8% | 215 | 24,509 | 84 | ¥11,900 | 85.6% |
| Kobe | Kobe | 142 | 99 | 43 | 30.3% | 160 | 16,484 | 66 | ¥11,600 | 88.7% |
| Naha | Naha | 205 | 187 | 18 | 8.8% | 551 | 29,003 | 95 | ¥10,100 | 91.0% |
| Hakata | Fukuoka | 209 | 191 | 18 | 8.6% | 796 | 48,780 | 181 | ¥13,600 | 91.1% |
| Ishigaki | Ishigaki | 130 | 121 | 9 | 6.9% | 237 | 5,607 | 12 | ¥12,800 | 91.0% |
| Hiroshima | Hiroshima | 106 | 100 | 6 | 5.7% | 150 | 10,289 | 35 | ¥10,300 | 86.8% |
| Shimizu | Shizuoka | 105 | 99 | 6 | 5.7% | 40 | 1,634 | 4 | ¥6,100 | 84.9% |
| Kagoshima | Kagoshima | 129 | 122 | 7 | 5.4% | 145 | 11,497 | 42 | ¥6,400 | 82.0% |
| Sasebo | Sasebo | 128 | 122 | 6 | 4.7% | 45 | 2,361 | 8 | ¥6,900 | 81.7% |
| Nagasaki | Nagasaki | 198 | 194 | 4 | 2.0% | 170 | 8,504 | 32 | ¥8,300 | 81.7% |
| 10-port total | — | 1,561 | 1,340 | 221 | 14.2% | 2,509 | 158,668 | 559 | — | — |
Port calls = MLIT Ports and Harbours Bureau, “Preliminary 2025 Figures.” Room stock = N=2,509 properties, 158,668 rooms (property master as of August 2026; within a 5km radius of passenger terminal coordinates; only properties with a registered room count). Estimated settled ADR for July 2026, sample N=811 properties. OCC is a prefecture-level estimate. Source: MetroEngines Research & Consulting
Looking at the two turnaround-type ports, the 5km radius around Yokohama Port holds 215 properties and 24,509 rooms (84 of them with 100+ rooms), and around Kobe Port 160 properties and 16,484 rooms (66 with 100+ rooms). Together, 40,993 rooms are positioned to serve turnaround demand. Since the previous section put Yokohama Port’s daily average demand at 82–120 rooms in the mid case, total inventory is ample. The issue is not volume but price bands, discussed below, and the concentration of demand on turnaround days.
Among transit-type ports, the 796 properties and 48,780 rooms within 5km of Hakata Port stand out. Fukuoka City combines Kyushu’s business demand with demand as an international flight gateway, so a lodging market independent of cruise calls was already established. The 5km radius around Naha Port is also deep, at 551 properties and 29,003 rooms. By contrast, the areas around Shimizu Port (40 properties, 1,634 rooms) and Sasebo Port (45 properties, 2,361 rooms) are compact relative to their call records (105 calls at Shimizu, 128 at Sasebo). As these ports take on turnaround functions or products involving pre- and post-cruise stays, there is room for growth on the supply side as well.
Circle size = rooms within a 5km radius of the terminal; color intensity = share of calls by Japanese cruise lines (proxy for turnaround type). Source: MLIT Ports and Harbours Bureau, “Preliminary 2025 Figures” / MetroEngines Research & Consulting, CartoDB (map tiles)
Price-Band Distribution — The Gap Is in the ¥18K+ Band
Measuring supply by room count alone misses important information. Travelers who fly in for a fly-and-cruise and stay one or two nights before boarding are a segment with room to accept a correspondingly higher rate. We therefore looked at the distribution of estimated settled ADR in July 2026, by price band, for properties within 5km of each port.
Property-level distribution of estimated settled ADR (tax-excluded equivalent) for July 2026. Sample N=811 properties (within 5km of each port’s terminal, where an estimated settled ADR could be calculated). Source: MetroEngines Research & Consulting
| Port | Under ¥8K | ¥8K–12K | ¥12K–18K | ¥18K–25K | ¥25K+ | ¥18K+ share | Sample |
|---|---|---|---|---|---|---|---|
| Yokohama | 14.5% | 36.1% | 26.5% | 10.8% | 12.0% | 22.8% | 83 |
| Kobe | 13.2% | 43.4% | 27.6% | 7.9% | 7.9% | 15.8% | 76 |
| Naha | 28.7% | 31.3% | 20.7% | 14.7% | 4.7% | 19.4% | 150 |
| Hakata | 5.6% | 29.7% | 38.2% | 16.5% | 10.0% | 26.5% | 249 |
| Ishigaki | 22.7% | 18.2% | 36.4% | 13.6% | 9.1% | 22.7% | 44 |
| Hiroshima | 29.2% | 43.8% | 14.6% | 10.4% | 2.1% | 12.5% | 48 |
| Shimizu | 69.2% | 15.4% | 15.4% | 0.0% | 0.0% | 0.0% | 13 |
| Kagoshima | 78.3% | 14.5% | 4.3% | 1.4% | 1.4% | 2.8% | 69 |
| Sasebo | 70.0% | 20.0% | 10.0% | 0.0% | 0.0% | 0.0% | 20 |
| Nagasaki | 47.5% | 28.8% | 13.6% | 6.8% | 3.4% | 10.2% | 59 |
Share of properties by estimated settled ADR (July 2026, tax-excluded equivalent). Sample N=811 properties. Listed prices (all-plan average, tax included) run higher than this (sample N=1,545 properties). Source: MetroEngines Research & Consulting
By share of properties in the ¥18K+ band, the top ports are Hakata (26.5%), Yokohama (22.9%), Ishigaki (22.7%) and Naha (19.3%). By contrast, Sasebo and Shimizu are at 0.0%, Kagoshima at 2.9% and Nagasaki at 10.2%, with supply concentrated in the mid-price band and below. This mirrors each port’s current demand mix. At ports dominated by transit calls, spending by day-trip visitors ashore is the core of cruise demand, while lodging is supported by local business and leisure demand. It is natural to read these price bands as optimized for current demand.
That said, if these ports take on turnaround functions or pre- and post-cruise products, the upper price bands remain largely untapped. Nagasaki Port ranks first in Japan with 194 calls by foreign cruise lines, and Sasebo Port is tied for fourth with 122. If these call records can be linked to turnarounds and pre- and post-cruise stays, there is room to push the price range of rooms serving that demand higher than it is today. From a developer’s standpoint, avoiding the bands where existing stock is thick and building new rooms positioned at ¥18K+ close to the terminal can be framed as a position with little competition.
The Character of Terminal Surroundings — Business-District vs. Dedicated-Pier Types Change How to Read a Site
From a site development perspective, what kind of neighborhood surrounds a terminal determines how much weekday demand beyond pre- and post-cruise stays a hotel can capture. Cruise turnaround days number 139–203 a year (in Yokohama’s case), and how the remaining days are filled determines project viability. Looking at employment data within a 1km radius of the passenger terminals, the 10 ports fall clearly into two types.
Within a 1km radius of passenger terminal coordinates. Source: Compiled by MetroEngines Research & Consulting from Ministry of Internal Affairs and Communications and Ministry of Economy, Trade and Industry, Economic Census for Business Activity (2021) / Boundaries = 2020 Census small areas (e-Stat Statistical GIS). Shizuoka City (Shimizu Port) is excluded from the chart because the relevant area is not included in this dataset (this does not mean employment is zero).
The business-district type comprises three ports: Yokohama (3,919 establishments, 55,282 employees, 26.3% office-type), Hakata (2,309; 32,888; 27.3%) and Nagasaki (1,862; 19,436; 28.1%). These terminals adjoin central business districts, so a single hotel can capture both weekday business demand and pre- and post-cruise stays. Yokohama’s Osanbashi Pier is a 7-minute walk from Nihon-odori Station and 15 minutes from Kannai Station, while the Shinko Pier terminal is a 10–12 minute walk from Bashamichi and Minatomirai stations. These location conditions are the premise that made a hotel-integrated mixed-use terminal viable.
The other type has terminals on dedicated piers with thin employment clusters around them: Kobe (295 establishments, 2.8% office-type), Hiroshima (410; 5.3%) and Ishigaki (388; 6.9%). Kobe’s Port Terminal sits on an artificial island, and residential population within a 1.5km radius is limited to 15,531. For this type, designs built around pre- and post-cruise and leisure demand are a better fit. In between are Naha (11.2%), Sasebo (10.8%) and Kagoshima (10.3%).
Now the residential side. Residential population within a 1.5km radius of the passenger terminals (2025 estimate) ranks Kagoshima (51,190), Hakata (44,573), Yokohama (36,849) and Nagasaki (31,034). In projected change to 2040, Hakata is the only port with an increase (+3.7%), followed by Kobe roughly flat (0.0%), Yokohama (-2.5%) and Ishigaki (-3.4%). The map below shows the mesh distribution around Yokohama Port’s Osanbashi Pier.
Source: MLIT National Land Numerical Information (future population estimates by 250m mesh, 2024 National Land Policy Bureau estimates), CartoDB (map tiles). Figures are residential population (Census-based), not daytime or transient population.
Because the Osanbashi area faces the sea, mesh population is skewed inland. Within a 1.5km radius there are 36,849 residents, with a 23.4% share of seniors and a projected decline of only -2.5% to 2040. Central business districts in Kannai, Bashamichi and Nihon-odori sit within walking distance alongside mixed residential and commercial areas in Yamashita-cho and Motomachi. The ability to capture three layers of demand — weekday business, weekend leisure and pre- and post-cruise stays — from a single location defines this port’s character as a hotel site.
Conclusion — Matching Supply-Side Growth Potential to Expanding Turnaround Functions
To summarize: First, cruise lodging demand tracks turnarounds, not port calls. By share of Japanese cruise line calls, only two of the 10 major ports are turnaround-type — Yokohama (49.8%) and Kobe (30.3%) — while the other eight, at 2.0–8.8%, are transit-type. Second, working backward from the 97.3% turnaround ratio and 400,564 embarking and disembarking passengers (2024) published by the City of Yokohama Port and Harbor Bureau, pre- and post-cruise demand per turnaround is 216 rooms in the mid case, and falls within a range of 197–432 rooms even across the sensitivity cases. That is the equivalent of a mid-sized hotel filling up on every turnaround day.
Third, the areas within 5km of the terminals at the 10 major ports hold 158,668 rooms of inventory, so there is ample depth in volume. The growth potential lies in price bands: the share of properties with an estimated settled ADR of ¥18K+ is 26.5% around Hakata and 22.9% around Yokohama, but only 10.2% around Nagasaki and 0.0% around Sasebo, even though both rank near the top nationally for foreign cruise calls. Fourth, employment around the terminals splits into a business-district type (Yokohama, Hakata, Nagasaki) and a dedicated-pier type (Kobe, Hiroshima, Ishigaki), which changes how weekday demand can be captured.
For site development and acquisitions, this comes down to three decision criteria. (1) Will the target port’s turnaround function grow? Japanese cruise lines are adding ships, and one more ship registered in Yokohama shows up as additional turnarounds. (2) Can a site within walking or short-distance access of the terminal be secured? Proximity to the embarkation port drives the choice of a pre- or post-cruise stay. (3) Can the surrounding employment cluster supply weekday demand? With around 200 turnaround days a year, occupancy planning for the remaining days determines viability. A site with an advantage on any of these three criteria is well placed to take a position with thin competition, given the current price-band distribution.
From the perspective of regional banks and shinkin banks assessing business viability, and of municipalities promoting their ports, it is useful to set turnarounds and embarking/disembarking passengers as separate metrics alongside port call targets when forecasting lodging demand. The City of Yokohama Port and Harbor Bureau’s ongoing publication of its turnaround ratio and passenger counts offers a format other ports can follow. The same document estimates the economic ripple effect within the city per cruise ship at approx. ¥325 million for a world cruise (50,000-gross-ton class) and approx. ¥175 million for an Asia cruise (110,000-gross-ton class). How much of that effect lodging can capture depends on what kind of rooms are available around the terminal.
About the estimates: Pre- and post-cruise demand in this article is an estimate combining Yokohama Port’s published results with assumed values for the pre/post-stay rate, guests per room and number of nights; it is not a measured figure. The pre/post-stay rate is a provisional share of embarking and disembarking passengers who stay overnight, and actual rates vary by route, season and customer segment. The 2025 turnaround count is a reference value obtained by applying the 2024 turnaround ratio of 97.3% to 2025 port calls. Port-level call counts are preliminary figures and may be revised.
Related Articles
- Record 3,117 Cruise Calls: Hotel Capacity at Japan’s Top 10 Ports
- Hotel Pricing on Cruise Port Days: ADR Premium Analysis for Yokohama, Kobe & Naha
- Winter Schedule Oct 25: Do 20 Regional Airports Have Enough Rooms?
- Fukuoka Hotel Supply 2026-2028: ~1,000 Rooms/Year in Hakata & Tenjin
- Naniwasuji & Haneda Access Lines 2031: Hotel Investment Timelines
References and Sources
■ Government Statistics and Public Materials
- MLIT Ports and Harbours Bureau, “Inbound Cruise Passengers and Cruise Ship Port Calls (Preliminary 2025 Figures)” (February 20, 2026) (port-level call counts are based on the PDF attachment to this press release; Japanese)
- City of Yokohama Port and Harbor Bureau, “Outlook for Yokohama Port as a Cruise Hub Port” (April 25, 2025; published by MLIT; Japanese)
- MLIT National Land Numerical Information, “Future Population Estimates by 250m Mesh (2024 National Land Policy Bureau Estimates)” — residential population within a 1.5km radius of passenger terminals
- Ministry of Internal Affairs and Communications and Ministry of Economy, Trade and Industry, “Economic Census for Business Activity” (2021) / Boundaries = 2020 Census small areas (e-Stat Statistical GIS) — establishments and employees within a 1km radius of passenger terminals
■ Market Data
- MetroEngines Research & Consulting — Room stock (N=2,509 properties, 158,668 rooms; property master as of August 2026), estimated settled ADR and listed prices (July 2026; sample N=811 / N=1,545 properties), estimated OCC (May–August 2026)
■ Operator Publications
- MOL Cruises, “MITSUI OCEAN FUJI” ship specifications (passenger capacity 458)
- Asuka II (passenger capacity 872) and Asuka III (52,000 gross tons, passenger capacity approx. 740) = as stated in the City of Yokohama Port and Harbor Bureau document