

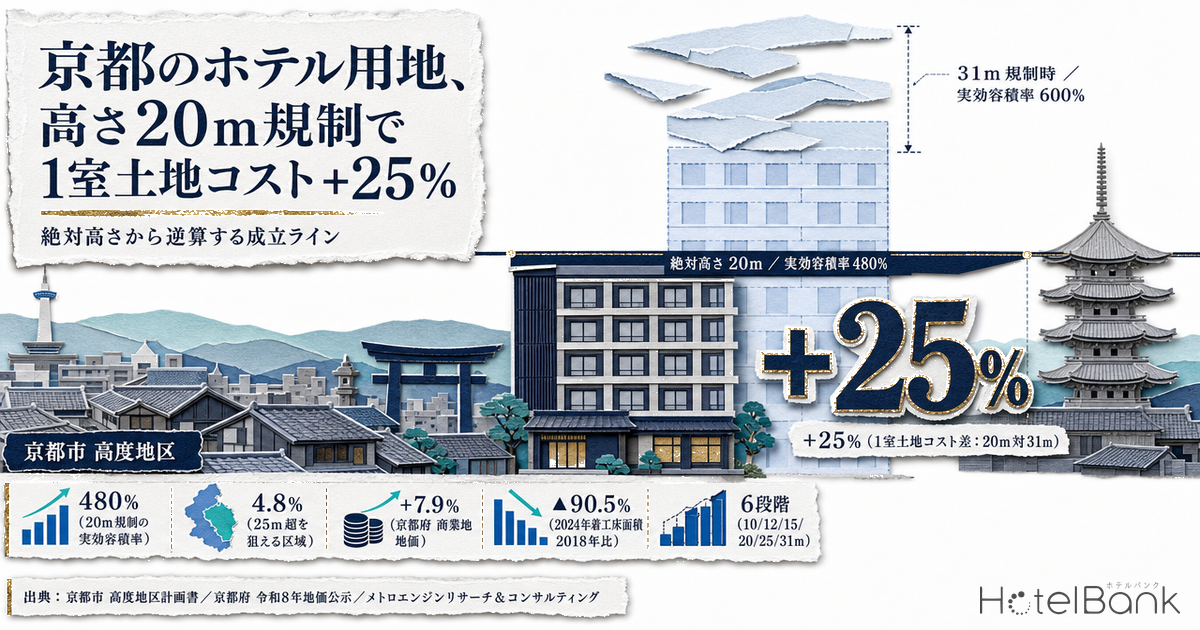
Hotel development textbooks teach that floor area ratio (FAR) determines project scale. In landscape-preservation cities such as Kyoto, Kamakura, Kanazawa and Nara, that premise does not hold. Even with 600% of FAR still available, an absolute height district capped at 20m allows only six floors, and the achievable gross floor area tops out at an effective 480%. The 20% you cannot build does not simply disappear — it is passed through into the land cost per room.
This article establishes the absolute height tiers and their designated areas from Kyoto City’s Height District Plan (a primary source), then works backwards from height to floor count to room count to land cost per room. On the revenue side, it cross-references the FY2026 (Reiwa 8) Official Land Price Survey for Kyoto Prefecture with MetroEngines Research & Consulting’s estimated settled ADR and estimated occupancy, and presents a sensitivity table showing how high land cost per room can go before a project stops penciling. Height limits in Kamakura, Kanazawa and Nara are lined up alongside, based on each city’s published materials.
Metric Definitions Used in This Article
- ADR (average daily rate) = an estimated settled rate (tax-excluded equivalent) calculated by applying property-type correction factors to the lowest publicly listed plan level on OTAs (double occupancy, per-room rate, tax included). Cross-checked against property-level results disclosed by listed hotel REITs (184 property-months, April–May 2026), the median error is approximately 7%. These are estimates and differ from each property’s actual transaction prices and accounting figures. Area-level ADR is the median across the properties covered (the level of a typical property in the area).
- OCC (occupancy rate) = sold rooms as a share of total rooms in the area (an estimate based on OTA-listed inventory). This article uses it only at the prefecture level; occupancy for individual properties is not calculated.
- Absolute height = the maximum building height set by a height district under Article 9 of the City Planning Act. Separate from setback (diagonal-line) restrictions and shadow regulations, it imposes a uniform ceiling across each district.
- Effective FAR = the lesser of (a) the floor count derived from the absolute height multiplied by the building coverage ratio and (b) the designated FAR. This is our own definition, used in this article.
- Data sources = MetroEngines Research & Consulting (ADR, estimated occupancy) / Kyoto City, Kamakura City, Kanazawa City, Nara City (height districts) / Kyoto Prefecture (official land prices) / Ministry of Land, Infrastructure, Transport and Tourism, Building Construction Starts Statistics.
- — Kyoto City’s height districts run in six tiers from 10m to 31m. For lodging facilities that cannot satisfy the land-use conditions, the area where more than 25m is achievable is 684ha — just 4.8% of the built-up area.
- — At 80% building coverage and a 3.3m floor-to-floor height, a 20m absolute height cap yields an effective FAR of 480%. That is 80% of the designated 600%; only at 31m does FAR, rather than height, become the binding constraint.
- — On identical land at an identical price, land cost per room differs by 25% between 20m and 31m, and by 87.5% between 15m and 31m.
- — In the FY2026 land price survey, commercial land in Kyoto’s Minami Ward rose a median +21.2% year on year. But the 31m allowance opened up in southern Kyoto Station requires offices or research facilities to occupy at least half the gross floor area — a lodging-only scheme cannot use it.
- — In Shimogyo Ward, a project pencils at 20m on median-priced land (¥8.70m per room against an allowable ¥13.13m), but on upper-quartile land 31m is the dividing line between viable and not.
Kyoto’s six height tiers: hotels can exceed 25m on just 4.8% of the built-up area
Kyoto City comprehensively rebuilt its height regulations under the New Landscape Policy that took effect in September 2007. The current Height District Plan (as of April 2026) sets maximum building heights in six tiers: 10m, 12m, 15m, 20m, 25m and 31m. In addition, a city planning amendment on 25 April 2023 created roughly 38ha of a new “space-creation type” height district — a category with no maximum height where specified conditions are met.
The breakdown of designated areas maps the structure of the city clearly. The 15m height district is the largest at 4,694ha (32.9%), followed by 20m at 3,755ha (26.3%) and 10m at 3,554ha (24.9%). Those three account for 84% of the built-up area. By contrast, the 31m height district covers 1,405ha (9.8%) and the 25m tier only 61ha (0.4%).
Source: Kyoto City, “Height District Plan” (as of April 2026); compiled by MetroEngines Research & Consulting
It would be a mistake, however, to read the 31m district’s 1,405ha as “9.8% of the city can build to 31m.” The 31m height district is subdivided into eleven categories, from Type 1 through Type 11, and every category from Type 2 onward is conditional. Where the conditions are not met, the maximum height reverts to 20m (25m for Type 6 only).
The substance of those conditions varies considerably by category. Types 5 and 6 in southern Kyoto Station, and Type 2 along Gojo-dori, all require that at least half the gross floor area be devoted to “offices or research facilities.” The city’s own published explanatory materials state that the purpose of Types 5 and 6 in southern Kyoto Station is “to form a cluster of office and laboratory functions” (for Type 2 on Gojo-dori, “to concentrate offices and similar uses”). A lodging-only scheme cannot satisfy this condition.
By contrast, Type 7 around Umekoji-Kyotonishi Station (conditional on designated uses on the ground floor), Type 8 along the Outer Ring Road in the eastern part of the city (conditional on roadside open space plus designated uses on the first and second floors), and the space-creation type (conditional on 3m of roadside open space, designated uses on the first and second floors, a 2m wall setback, and landscape certification) list only housing, apartment buildings, dormitories, parking and warehouses as excluded uses. Lodging counts as a designated use. In other words, a hotel can satisfy these conditions.
| Category | Target area | Area | Height if conditions unmet | Nature of the condition | Reachable for lodging? |
|---|---|---|---|---|---|
| 31m Type 1 | Parts of neighborhood commercial, commercial, quasi-industrial and industrial zones | 549ha | — (unconditional) | None | Reachable |
| 25m | Part of the commercial zone | 61ha | — (unconditional) | None | Reachable (25m) |
| 31m Type 7 | Around Umekoji-Kyotonishi Station | 11ha | 20m | Designated use on the ground floor | Reachable |
| 31m Type 8 | Outer Ring Road frontage (south of the Meishin Expressway) | 25ha | 20m | Roadside open space + designated uses on floors 1–2 | Reachable |
| Space-creation type | Outer Ring Road frontage (north of the Meishin Expressway) | 38ha | 31m | 3m roadside open space + designated uses + wall setback + landscape certification | Reachable (no ceiling) |
| 31m Type 2 | Gojo-dori frontage | 6.2ha | 20m | Offices/research facilities ≥1/2 of gross floor area | Not on its own |
| 31m Type 5 | Southern Kyoto Station | 21ha | 20m | Offices/research facilities ≥1/2 of gross floor area | Not on its own |
| 31m Type 6 | Southern Kyoto Station | 21ha | 25m | Offices/research facilities ≥1/2 of gross floor area | Not on its own |
| 31m Types 3 & 4 | Parts of the industrial zone | 310ha | 20m | Factory and similar uses | Not on its own |
| 31m Types 9, 10 & 11 | Industrial zones in the western built-up area | 462ha | 20m | Factories, offices, apartment buildings etc. + soundproofing and environmental performance | Not on its own |
Source: Kyoto City, “Height District Plan” and “Explanation of Height Districts (31m and Space-Creation Type)” (April 2023); compiled by MetroEngines Research & Consulting. “Reachable for lodging” is our own reading of each category’s land-use conditions as applied to a lodging-only scheme; feasibility for any individual project depends on consultation with the relevant city department
Aggregating that reading by area, the zones where lodging can exceed 25m come to 25m (61ha) + 31m Type 1 (549ha) + Type 7 (11ha) + Type 8 (25ha) + space-creation type (38ha) = 684ha. Against the 14,274ha total designated as height districts, that is 4.8%. Put the other way, across the remaining 95.2%, lodging is held to 20m or below.
A 20m cap means an effective FAR of 480% — topping out at 80% of the designated 600%
The path by which absolute height drives project scale is simple. Dividing the height ceiling by the floor-to-floor height fixes the maximum floor count; multiplying that floor count by the building coverage ratio fixes the achievable gross floor area, i.e. the effective FAR. If the designated FAR is the smaller of the two, FAR binds; if the height-derived figure is smaller, height binds.
Under conditions typical of a commercial zone (80% building coverage, 600% designated FAR) and a 3.3m floor-to-floor height on guest room floors, the arithmetic runs as follows.
| Absolute height | Max floors | Floors × coverage | Effective FAR | Binding constraint | Share of designated FAR used |
|---|---|---|---|---|---|
| 15m | 4 floors | 320% | 320% | Height | 53% |
| 20m | 6 floors | 480% | 480% | Height | 80% |
| 25m | 7 floors | 560% | 560% | Height | 93% |
| 31m | 9 floors | 720% | 600% | FAR | 100% |
| 45m (reference: Kanazawa) | 13 floors | 1,040% | 600% | FAR | 100% |
Source: MetroEngines Research & Consulting estimates. A simplified calculation assuming each floor’s area equals the building footprint; in practice upper floors shrink under road setback rules, shadow regulations, setbacks and similar constraints
Source: MetroEngines Research & Consulting estimates
At 20m you can use 80% of the designated FAR; at 15m, only a little over half. Only at 31m does FAR take over as the binding constraint. That is the pivot point.
A second point often overlooked in practice is the granularity of floor height. Absolute height is continuous but floor count is an integer, so a marginal change in floor-to-floor height can cost an entire floor. In a 20m zone, a 3.3m floor height yields six floors (6 × 3.3m = 19.8m, just inside 20m), but a 3.5m floor height yields only five (17.5m). A change in the MEP design or ceiling-height specification translates directly into a 16% reduction in room count.
| Absolute height | 3.0m floors | 3.3m floors | 3.5m floors | 3.8m floors |
|---|---|---|---|---|
| 15m | 5 | 4 | 4 | 3 |
| 20m | 6 | 6 | 5 | 5 |
| 25m | 8 | 7 | 7 | 6 |
| 31m | 10 | 9 | 8 | 8 |
Source: MetroEngines Research & Consulting estimates. Kyoto City’s Height District Plan provides a limited allowance where rooftop structures occupy no more than one-eighth of the building footprint, and actual designs have room to work that allowance in
Treating “3m equals one floor” is not an arbitrary assumption on our part. In its policy for expanding height district designations, Kamakura City explicitly frames its absolute height values as “15m = up to roughly five storeys (3m × 5),” “20m = roughly six to seven storeys,” and “31m = roughly ten storeys (3m × 10).” The municipality itself translates absolute height into floor counts when designing the rules.
FY2026 land prices: a ¥1.19m/sqm median across Kyoto’s five core wards, +22.0% in southern Kyoto Station
Before turning to the revenue side, the denominator — land price — needs to be pinned down from a primary source. For the procedure that connects official land prices to investment decisions, see our analysis of land prices in Hakodate and southern Hokkaido. In the FY2026 (Reiwa 8) Official Land Price Survey (as of 1 January 2026), the average commercial land price in Kyoto Prefecture was ¥1,006,700/sqm, up 7.9% year on year — third nationally behind Tokyo (+12.2%) and Osaka (+8.5%). Kyoto Prefecture had ranked second nationally in the prior-year FY2025 survey.
Aggregating the 66 commercial standard sites in central Kyoto City (21 in Shimogyo, 22 in Nakagyo, 12 in Higashiyama, 6 in Minami, 5 in Kamigyo) by ward gives the following.
| Ward | Sites | Median | Lower quartile | Upper quartile | Ward high | Median YoY |
|---|---|---|---|---|---|---|
| Shimogyo | 21 | 1,160,000 | 719,000 | 1,770,000 | 11,500,000 | +10.2% |
| Nakagyo | 22 | 1,450,000 | 841,000 | 2,850,000 | 6,200,000 | +10.1% |
| Higashiyama | 12 | 1,250,000 | 1,020,000 | 1,860,000 | 5,300,000 | +15.2% |
| Minami | 6 | 576,000 | 453,000 | 2,170,000 | 5,430,000 | +21.2% |
| Kamigyo | 5 | 560,000 | 555,000 | 594,000 | 825,000 | +10.0% |
Source: Kyoto Prefecture, “FY2026 Official Land Price Survey: Standard Site Price List”; compiled by MetroEngines Research & Consulting (N=66 sites, commercial only). Minami and Kamigyo have few sites, so their medians carry a wide margin of representativeness
Minami Ward is the one to watch. It has only six commercial sites, but its median year-on-year gain of +21.2% is the highest of the five wards. Looking at individual sites, 52 Higashi-Kujo Kamitonoda-cho in southern Kyoto Station came in at ¥5,430,000/sqm (from ¥4,450,000, +22.0%), and 41-1 in the same district at ¥2,170,000/sqm (from ¥1,790,000, +21.2%) — both above 20%. This is precisely the area where the 2023 city planning amendment raised FAR to 600% and designated the 31m Type 5 and Type 6 height districts.
In Shimogyo Ward too, the gains cluster around the station: 734 Higashi-Shiokoji-cho on Karasuma-dori south of Shichijo at ¥8,870,000/sqm (+15.2%) and 614 Higashi-Shiokoji-cho on Shiokoji-dori west of Karasuma at ¥7,700,000/sqm (+13.9%). The ward’s highest price is ¥11,500,000/sqm (+9.5%) on Shijo-dori east of Teramachi.
Working back to land cost per room: a 20m cap costs 25% more than 31m
The regulatory figures above now need translating into the unit an investor actually decides on. Land cost per room can be written as an identity.
The point is that site area drops out of the equation. We apply the same form of reverse calculation to the maximum supportable ground rent when a project is structured on leased land rather than owned land, across nine markets. Whether the site is large or small, the land cost allocated to each room is determined by just three variables: land price, effective FAR and gross floor area per room. And it is absolute height that governs the effective FAR.
Gross floor area per room is set at 36sqm, assuming a mid-market, room-led format (22sqm guest room plus common areas and back of house). Substituting each ward’s median land price under 80% coverage, 600% designated FAR and a 3.3m floor height gives the following.
| Ward | Land price level | ¥/sqm | 15m | 20m | 25m | 31m |
|---|---|---|---|---|---|---|
| Shimogyo | Median | 1,160,000 | 1,305 | 870 | 746 | 696 |
| Shimogyo | Upper quartile | 1,770,000 | 1,991 | 1,328 | 1,138 | 1,062 |
| Shimogyo | Ward high (Shijo-dori/Teramachi) | 11,500,000 | 12,938 | 8,625 | 7,393 | 6,900 |
| Nakagyo | Median | 1,450,000 | 1,631 | 1,087 | 932 | 870 |
| Nakagyo | Upper quartile | 2,850,000 | 3,206 | 2,137 | 1,832 | 1,710 |
| Higashiyama | Median | 1,250,000 | 1,406 | 937 | 804 | 750 |
| Higashiyama | Ward high (Shijo-dori/Gion) | 5,300,000 | 5,962 | 3,975 | 3,407 | 3,180 |
| Minami | Median | 576,000 | 648 | 432 | 370 | 346 |
| Minami | Ward high (Higashi-Kujo Kamitonoda-cho) | 5,430,000 | 6,109 | 4,072 | 3,491 | 3,258 |
Source: MetroEngines Research & Consulting estimates based on Kyoto Prefecture, “FY2026 Official Land Price Survey: Standard Site Price List.” A simplified calculation resting on stated assumptions, not a valuation for investment decisions
On the same land at the same price, land cost per room changes by 25% depending on whether the cap is 20m or 31m — the inverse ratio of a 480% effective FAR to 600%. Between 15m and 31m the gap is 87.5%. At the land price level of southern Kyoto Station (52 Higashi-Kujo Kamitonoda-cho, ¥5,430,000/sqm), the land burden per room is ¥40.72m at 20m and ¥32.58m if 31m can be built. The land costs the same; what differs is how many rooms can sit on it, and therefore how much land cost each room carries.
According to Kyoto City’s published city planning amendment, in southern Kyoto Station — the Aburanokoji-dori, Karasuma-dori, Takeda-kaido and Kawaramachi-dori frontages around Kujo-dori and Jujo-dori — the previous neighborhood commercial, category-2 residential and quasi-industrial zones became a commercial zone, building coverage went from 60–80% to 80%, FAR from 200–400% to 600%, and the height district from 20m Types 2, 3 and 4 to 25m and 31m Types 5 and 6. Planning capacity expanded nearly threefold, but the land-use condition for using the 31m allowance is offices and research facilities.
The allowable line from the revenue side: Shimogyo pencils at 20m on median land, not on upper-quartile land
Next, working from the revenue side to establish how much can be paid per room. This framework — judging viability from the ADR a project requires — is the same one we used for hotel conversions of former department store sites. The figures come from MetroEngines Research & Consulting’s ward-level data for Kyoto City.
Estimated settled ADR is the average of monthly values over the trailing twelve months (August 2025 – July 2026). Coverage — the number of properties aggregated each month — was stable throughout the period, with no thin months mixed in. Estimated occupancy is calculated only at the prefecture level (Kyoto Prefecture); the all-property average of 86.6% for May–August 2026 is applied as a common assumption across all wards. Ward-level occupancy is not calculated.
| Ward | Estimated settled ADR | Properties aggregated (N) | Listed properties | Notes |
|---|---|---|---|---|
| Higashiyama | ¥23,800 | 43–49 | 403 | Includes the Gion and Kiyomizu areas |
| Nakagyo | ¥17,100 | 102–112 | 339 | The Karasuma/Kawaramachi city center |
| Shimogyo | ¥15,700 | 157–167 | 536 | North of Kyoto Station, Shijo-Karasuma |
| Minami | ¥14,300 | 54–56 | 232 | South of Kyoto Station, To-ji |
| Kamigyo | ¥16,300 | 8–10 | 100 | Small N; indicative only |
| Sakyo | ¥14,200 | 13–15 | 83 | Small N; indicative only |
Source: MetroEngines Research & Consulting. Kita, Yamashina, Fushimi and Nishikyo wards are not shown because seven or fewer properties were aggregated
For reference, the estimated settled ADR for Kyoto Prefecture as a whole averaged ¥16,600 over the trailing twelve months, against ¥15,900 in the year-earlier period (August 2024 – July 2025) — +4.4% year on year (both compared on a confirmed-month basis).
Source: MetroEngines Research & Consulting. Months from August 2026 onward are estimates based on listed rates at the time of the survey (dotted line)
Estimated occupancy does not vary much by category either. It peaked at 92.0% across all properties in May 2026, then ran 85.8% in June, 83.8% in July and 84.7% in August.
| Category | Properties | Rooms | Estimated occupancy (4-month average) |
|---|---|---|---|
| All properties | 943–1,154 | 52,693–54,928 | 86.6% |
| Business | 285–293 | 31,415–31,849 | 86.6% |
| City | 54–56 | 10,154–10,369 | 88.2% |
| Deluxe | 22–23 | 2,504–2,638 | 86.4% |
| Ryokan | 119–181 | 2,181–3,341 | 86.1% |
Source: MetroEngines Research & Consulting. An estimate based on the take-up of inventory sold on OTAs; it differs from a property’s overall actual occupancy
Assumptions
The allowable land cost is built up in the following order. All of it is a simplified calculation resting on stated assumptions, not intended for investment decisions on individual projects.
| Item | Value | Basis |
|---|---|---|
| GFA per room | 36sqm | Mid-market room-led format (22sqm guest room + common areas and back of house) |
| Estimated occupancy | 86.6% | Kyoto Prefecture, May–August 2026, all-property average (our estimate) |
| Rooms revenue ratio | 92% | Assumed for a room-led format. Total revenue = rooms revenue ÷ 0.92 |
| GOP margin | 35% | A conservative figure below the 38.9% GOP achieved across the 91 MHM-operated properties disclosed by Invincible Investment Corporation (FY ended December 2024) |
| Target NOI yield | 5.0% | Allowable total investment = GOP ÷ 5.0% |
| Construction cost A | ¥24.71m/room | Assumed ¥2.026m per tsubo for a room-led RC-frame build + 12% soft costs (in line with the ¥2.082m/tsubo national average for accommodation and food service use in the 2025 construction starts statistics) |
| Construction cost B | ¥20.15m/room | ¥499,875/sqm planned construction cost for accommodation-use building starts in Kyoto Prefecture in 2024 + 12% soft costs |
Source: Ministry of Land, Infrastructure, Transport and Tourism, “Building Construction Starts Statistics” / Invincible Investment Corporation IR disclosures / MetroEngines Research & Consulting. Construction costs in the starts statistics are the amounts planned at the time of the building confirmation application and tend to come in below actual construction costs
On these assumptions, the allowable land cost is derived from estimated settled ADR and set against the land cost per room from Table 5, which is based on actual land prices.
Source: Kyoto Prefecture, “FY2026 Official Land Price Survey” / MetroEngines Research & Consulting estimates
ViableMedian land × 20m
At Shimogyo’s median land price of ¥1.160m/sqm, land cost per room is ¥8.70m even under a 20m cap — inside the allowable line of ¥13.13m (on construction cost A).
Not viableUpper-quartile land × 20m
At Shimogyo’s upper-quartile price of ¥1.77m/sqm, land cost per room reaches ¥13.28m, marginally above the ¥13.13m allowable line. Building to 31m brings it back to ¥10.62m.
Not viablePrime station-front land
At ¥8.87m/sqm on Karasuma-dori south of Shichijo in front of Kyoto Station, land cost is ¥59.61m per room even at 31m — beyond what a standalone new-build hotel can recover.
Source: MetroEngines Research & Consulting estimates, using construction cost A (¥24.71m/room) and a 5.0% target NOI yield
Sensitivity: the ADR a project needs, by land price level and height
Rewriting the same arithmetic in the other direction — “what ADR does this site at this height need to work?” — makes it more usable in practice. The required ADR is derived by applying the target yield to the allowable total investment (construction plus land). Note that an actual acquisition also carries brokerage fees, real estate acquisition tax and other costs, so the gap between gross and net yield needs to be read alongside this.
| Ward | Land price level | ¥/sqm | 15m | 20m | 25m | 31m | Actual ADR |
|---|---|---|---|---|---|---|---|
| Shimogyo | Median | 1,160,000 | 15,700 | 13,892 | 13,375 | 13,168 | 15,700 |
| Shimogyo | Upper quartile | 1,770,000 | 18,554 | 15,794 | 15,005 | 14,690 | 15,700 |
| Shimogyo | Ward high | 11,500,000 | 64,068 | 46,137 | 41,014 | 38,964 | 15,700 |
| Nakagyo | Median | 1,450,000 | 17,057 | 14,796 | 14,150 | 13,892 | 17,100 |
| Nakagyo | Upper quartile | 2,850,000 | 23,606 | 19,162 | 17,893 | 17,385 | 17,100 |
| Higashiyama | Median | 1,250,000 | 16,122 | 14,173 | 13,616 | 13,393 | 23,800 |
| Higashiyama | Upper quartile | 1,860,000 | 18,975 | 16,075 | 15,246 | 14,915 | 23,800 |
| Minami | Median | 576,000 | 12,969 | 12,071 | 11,814 | 11,712 | 14,300 |
| Minami | Upper quartile | 2,170,000 | 20,425 | 17,042 | 16,075 | 15,688 | 14,300 |
Source: Kyoto Prefecture, “FY2026 Official Land Price Survey” / MetroEngines Research & Consulting estimates. Actual ADR is the trailing-12-month estimated settled ADR from Table 6
Reading it is straightforward. Where the required ADR sits below the actual ADR, the project is in viable territory; where it sits above, it is not. Higashiyama, with an actual ADR of ¥23,800 against a required ¥16,100 at 20m even on upper-quartile land, has ample headroom despite the height constraint. Its rate structure absorbs the land cost.
Shimogyo is the contrast. It works on median-priced land, but on upper-quartile land at 20m the required ADR of ¥15,800 just misses the actual ¥15,700. At 31m the requirement falls to ¥14,700 and the actual rate clears it comfortably. On upper-quartile land in Shimogyo Ward, 20m versus 31m is the line between viable and not. Minami is similar: median-priced land leaves room, but on upper-quartile land — the rising sites in southern Kyoto Station — 20m requires ¥17,000 against an actual ¥14,300.
And in every ward, the top of the price range remains out of reach even at 31m, with required ADR running ¥23,000–¥39,000 — beyond a room-led format. Land like that only works through conversion of an existing building, cost allocation across a mixed-use development, or a luxury format operating at an order-of-magnitude higher rate. That Kyoto’s prime sites are filling with small, high-rate lodging rather than large room-led hotels follows directly from this arithmetic.
Everything above rests on a single set of assumptions: a 35% GOP margin, a 5.0% target NOI yield and construction cost A. All three are variables with a range, so it is worth seeing how far the viability line moves when they are flexed. The base case matches Table 8 exactly, using Shimogyo’s actual ADR of ¥15,700 and estimated occupancy of 86.6% (Kyoto Prefecture, May–August 2026 average).
| Scenario | GOP margin | Target NOI yield | Construction cost | Allowable total investment | Allowable land cost | Shimogyo median × 20m | Shimogyo median × 31m | Minami median × 20m | Minami median × 31m |
|---|---|---|---|---|---|---|---|---|---|
| Optimistic | 38% | 4.5% | Cost B, ¥20.15m/room | 4,565 | 2,550 | Viable | Viable | Viable | Viable |
| Base | 35% | 5.0% | Cost A, ¥24.71m/room | 3,784 | 1,313 | Viable | Viable | Viable | Viable |
| Pessimistic | 32% | 5.5% | Cost A +10%, ¥27.18m/room | 3,145 | 427 | Not viable | Not viable | Not viable | Viable |
Source: MetroEngines Research & Consulting estimates. The base case matches the assumptions in Table 8 (35% GOP margin, 5.0% target NOI yield, construction cost A). The 38% upper bound on GOP margin is the actual result across the 91 MHM-operated properties disclosed by Invincible Investment Corporation (FY ended December 2024); the 32% lower bound is a conservative figure for an overrun in operating costs. Land costs in the viability columns are the actual-land-price figures from Table 5 (Shimogyo median ¥1.160m/sqm, Minami median ¥576,000/sqm)
The range works asymmetrically. In the optimistic case, allowable land cost opens up to ¥25.50m per room and Shimogyo’s median land fits comfortably even at 20m. In the pessimistic case it contracts to ¥4.27m per room, and Shimogyo fails at both 20m and 31m. Minami is the one to note: even in the pessimistic case it stays viable at 31m (¥3.46m per room). At 20m (¥4.32m per room) it sits just ¥50,000 per room above the ¥4.27m allowance — effectively right on the boundary. When assumptions deteriorate, the height ceiling becomes the last variable separating viable from not — a structure that only emerges once the sensitivities are flexed.
Kamakura, Kanazawa and Nara — height ceilings across absolute-height markets
The structure by which absolute height governs project scale is not unique to Kyoto. The ceilings below are drawn from each city’s published height district and landscape regulation materials. Figures that could not be confirmed are not shown.
| City | Height tiers | Maximum | Floor-count guide given by the city itself | Character of the regime |
|---|---|---|---|---|
| Kyoto | 10 / 12 / 15 / 20 / 25 / 31m + space-creation type | 31m | — (no floor-count conversion in the plan) | Comprehensively revised under the New Landscape Policy (September 2007). The amendment decided on 25 April 2023 expanded the 31m categories |
| Kamakura | 15 (Type 1) / 20 (Type 2) / 31m (Types 3 & 4) | 31m | 15m = 5 floors, 20m = 6–7 floors, 31m = 10 floors (all at a 3m floor height) | Height limits across roughly 80% of the urbanization promotion area. A designation-expansion policy shifting from administrative guidance to statutory regulation |
| Kanazawa | 15 / 18 / 20 / 25 / 31 / 45m | 45m | — (no floor-count conversion in published materials) | Applied to residential zones and landscape ordinance areas in April 2005, extended to non-residential zones in April 2009. Last amended 1 December 2021 |
| Nara | 10 / 15 / 15 with setback / 15 with pitched-roof allowance / 20 / 25 / 31 / 40m | 40m | — (no floor-count conversion in published materials) | Eight height district types. Maximums designated across all zones except category-1 and category-2 exclusively low-rise residential zones |
Source: Kyoto City, “Height District Plan” / Kamakura City, “Kamakura City Planning Height District Designation Expansion Policy” / Kanazawa City, “Overview of Height Districts” / Nara City, “Height Districts and Fire Prevention Districts”; compiled by MetroEngines Research & Consulting
Kanazawa’s height districts are instructive because the logic behind the designated zones is published in concrete terms. Commercial zones are 31m as a rule, rising to 45m where FAR is 600%. In neighborhood commercial zones, areas around JR stations (Morimoto, Higashi-Kanazawa, Nishi-Kanazawa) are 31m, frontages on roads at least 16m wide are 25m, frontages on roads under 16m are 15m, and land behind them is 20m. Parts of quasi-industrial and industrial zones are 15–20m where housing is dense and 20–25m where it is sparse. The design allocates height in tiers according to road width and FAR.
That difference feeds straight through to project scale. Comparing at the same land price and site conditions (80% coverage, 3.3m floor height), Kyoto’s 31m (9 floors, 720% effective FAR) and Kanazawa’s 45m in a 600% FAR zone (13 floors, 1,040% effective FAR) both deliver the same 600% of built area, because FAR binds first in the Kanazawa case. In other words, in a 45m zone height is not the bottleneck and FAR can be used in full. The same holds for Nara’s 40m zones.
In Kyoto’s 20m zones, by contrast, even 600% of designated FAR yields an effective 480%. Where Kanazawa and Nara hold pockets of “FAR-determined” market inside the city, more than 95% of Kyoto’s built-up area is a “height-determined” market. That distinction separates the economics of hotel development between cities that are otherwise alike in preserving their landscapes.
Source: Kyoto City, “Revising City Planning Toward a Livable, Attractive and Vibrant City” (published April 2023); compiled by MetroEngines Research & Consulting
Evidence from supply: accommodation building starts in Kyoto are down 90% from 2018 by floor area
To check that this arithmetic squares with actual development behavior, we turn to the Ministry of Land, Infrastructure, Transport and Tourism’s building construction starts statistics. Starts of accommodation-use buildings in Kyoto Prefecture have moved as follows.
Source: Ministry of Land, Infrastructure, Transport and Tourism, “Building Construction Starts Statistics” (e-Stat statistics ID 0003114490); compiled by MetroEngines Research & Consulting
| Year | Buildings | Total floor area | Average per building | Planned construction cost | Unit cost (¥/sqm) |
|---|---|---|---|---|---|
| 2016 | 150 | 117,193sqm | 781sqm | ¥32.2bn | 274,797 |
| 2017 | 254 | 301,983sqm | 1,189sqm | ¥92.8bn | 307,424 |
| 2018 | 265 | 352,406sqm | 1,330sqm | ¥106.2bn | 301,390 |
| 2019 | 195 | 271,475sqm | 1,392sqm | ¥91.2bn | 336,115 |
| 2020 | 110 | 165,153sqm | 1,501sqm | ¥49.0bn | 296,535 |
| 2021 | 21 | 34,771sqm | 1,656sqm | ¥13.0bn | 372,520 |
| 2022 | 44 | 89,589sqm | 2,036sqm | ¥46.2bn | 515,332 |
| 2023 | 24 | 24,745sqm | 1,031sqm | ¥13.2bn | 534,765 |
| 2024 | 89 | 33,538sqm | 377sqm | ¥16.8bn | 499,875 |
Source: Ministry of Land, Infrastructure, Transport and Tourism, “Building Construction Starts Statistics” (e-Stat statistics ID 0003114490, accommodation use, Kyoto Prefecture); compiled by MetroEngines Research & Consulting. Construction costs are the amounts planned at the time of the building confirmation application
The 2018 peak was 265 buildings and 352,406sqm. In 2024 it was 89 buildings and 33,538sqm — down 90.5% from 2018 on floor area. Floor area fell far more steeply than the count of buildings (down 66.4%). As a result, average size per building shrank from 1,330sqm in 2018 to 377sqm in 2024 — to under 30% of its former level.
The composition of starts is shifting from large to small. That movement is consistent with the rational choice for developers in a market where height regulation caps room count and rising land prices push up land cost per room. Large room-led projects become harder to make work, while formats that never depended on stacking height in the first place — machiya renovations, small-scale properties — remain.
The rise in unit costs matters too. Planned construction cost divided by floor area went from ¥301,390/sqm in 2018 to ¥499,875/sqm in 2024 — up 65.9%. When construction costs rise 1.66x in six years, the amount left over for land within the same allowable total investment is cut by exactly that much. Height constraints, land price growth and construction cost inflation all push in the same direction.
Reference: acquisition prices for J-REIT-held properties in Kyoto City
The allowable total investment derived above (¥37.84m/room in Shimogyo, ¥41.23m/room in Nakagyo) can be sanity-checked against actual transaction data. Extracting room-led properties in Kyoto City from the REIT ownership master (a snapshot as of 24 August 2026) gives the following.
| Property | Holding REIT | Rooms | Acquisition date | Acquisition price | Per room |
|---|---|---|---|---|---|
| Smile Hotel Kyoto Shijo (スマイルホテル京都四条) | Ichigo Hotel REIT Investment Corporation (いちごホテルリート投資法人) | 144 | 29 November 2015 | ¥4,480m | ¥31.11m |
| Hotel MyStays Kyoto Shijo (ホテルマイステイズ京都四条) | Invincible Investment Corporation (インヴィンシブル投資法人) | 224 | July 2014 | ¥6,024m | ¥26.89m |
Source: REIT ownership master (N=302 properties, snapshot as of 24 August 2026); compiled by MetroEngines Research & Consulting. Acquisition prices are as disclosed by each REIT at the time of acquisition
Even for acquisitions more than a decade old, the range is ¥26.89m–¥31.11m per room — and that is for existing properties, land and building included. Against that, this article’s estimates put new-build construction alone at ¥20.15m–¥24.71m per room (costs B and A). The structure — ¥13.13m left over for land after subtracting construction cost A of ¥24.71m from the ¥37.84m/room allowable total investment in Shimogyo — is not markedly out of line with the price range for existing properties.
Conclusion — in height-regulated markets, read land price and height as a pair
In markets with absolute height regulation, land price alone cannot tell you whether a site is expensive or cheap. At the same ¥1.16m/sqm, land cost per room is ¥8.70m in a 20m zone and ¥6.96m at 31m. Conversely, land at ¥1.45m/sqm in a 31m zone and land at ¥1.16m/sqm in a 20m zone carry the same burden per room. Land price and the height ceiling should be read as a single paired indicator.
Three points emerge from this reverse calculation.
Point 1Height binds before FAR does
In Kyoto’s commercial zones at 80% coverage and a 3.3m floor height, the designated 600% FAR can only be used in full at 31m or above. At 20m it tops out at 480%, at 15m at 320%. Across 95.2% of the built-up area, lodging is held to 20m or below.
Point 2The relaxation was allocated by land use
Southern Kyoto Station and Gojo-dori, where 31m opened up under the 2023 amendment, carry a condition that offices or research facilities occupy at least half the gross floor area. On the same land, the usable capacity depends on the use.
Point 3ADR sets the viability line
Higashiyama, at an actual ADR of ¥23,800, is viable at 20m even on upper-quartile land. Shimogyo and Minami fall short at 20m on upper-quartile land, making 31m the pivot. A high rate absorbs the height constraint.
Source: MetroEngines Research & Consulting
In early-stage development screening, the practical move is to confirm the site’s height district category from city planning information, then compare the designated FAR against “coverage ratio × (height ceiling ÷ assumed floor height, rounded down)” and determine which is smaller before anything else. In zones where height binds, the floor-height specification translates directly into gaining or losing a floor, so it is worth working the height stack-up in detail from the earliest stage of the MEP design. And in markets like Kyoto, where the 31m categories are subdivided with land-use conditions attached, going mixed-use to reach the ceiling is also worth considering.
Frequently asked questions
A. Not at all. Kamakura City imposes height limits across roughly 80% of its urbanization promotion area, and Kanazawa City designates height districts in both residential and non-residential zones. Nara City has eight height district types. That said, Kyoto’s six tiers from 10m to 31m cover the entire built-up area, and the zones where more than 31m is achievable are limited — so the range over which height binds is unusually broad.
A. It depends on the floor-to-floor height: six floors at 3.0m or 3.3m, five at 3.5m. Kamakura City’s designation-expansion policy offers “20m = roughly six to seven storeys (3m floor height)” as a guide. Note also that Kyoto City’s Height District Plan provides an allowance where rooftop structures occupy no more than one-eighth of the building footprint, and actual designs have room to work that allowance in.
A. As “land price (¥/sqm) × gross floor area per room (sqm) ÷ effective FAR.” Effective FAR is the lesser of the designated FAR and “coverage ratio × maximum floor count.” Site area cancels out of this formula, so sites can be compared regardless of size. This article assumes 36sqm of gross floor area per room (mid-market, room-led).
A. According to Kyoto City’s published explanation of its height districts, the condition for reaching a 31m maximum in the 31m Type 5 and Type 6 districts of southern Kyoto Station is that at least half the gross floor area be devoted to office or research facility use. The city states that the purpose of the district is “to form a cluster of office and laboratory functions.” A lodging-only scheme does not meet the condition, and height stays at 20m (25m in the Type 6 area).
A. No. This is a simplified calculation resting on assumptions — 36sqm of gross floor area per room, 80% building coverage, a 3.3m floor height, a 35% GOP margin and a 5.0% target NOI yield. In practice, road setback rules, shadow regulations, landscape districts, scenic districts, fire prevention rules, site geometry and existing infrastructure all bear on individual projects. The height district category and regulatory conditions applying to a specific site must be confirmed with the relevant city department and verified through a detailed feasibility study.
A. Estimated settled ADR is an estimated transaction rate (tax-excluded equivalent) calculated by applying property-type correction factors to the lowest publicly listed plan level each property shows on OTAs. Cross-checked against property-level results disclosed by listed hotel REITs (184 property-months, April–May 2026), the median error is approximately 7%. Listed price, by contrast, is the average across all plans (double occupancy, per room, tax included); because it includes unsold higher-priced plans, it runs above the settled level. All viability estimates in this article use estimated settled ADR.
Methodology and sources
Regulatory parameters: Kyoto City’s height district tiers and designated areas are taken from the “Height District Plan” (published as of April 2026), and the conditions attached to the 31m and space-creation height districts from the “Explanation of Height Districts” (April 2023, Kyoto City). The content of the 2023 city planning amendment is from a pamphlet published by Kyoto City (April 2023). The city planning decision date was 25 April 2023 (parts took effect on 25 September of the same year). Kamakura City is from the “Kamakura City Planning Height District Designation Expansion Policy,” Kanazawa City from the “Overview of Height Districts” (last amended 1 December 2021), and Nara City from “Height Districts and Fire Prevention Districts.”
Land prices: from Kyoto Prefecture’s “FY2026 Official Land Price Survey: Standard Site Price List” (as of 1 January 2026), 66 commercial standard sites in Kyoto City’s Shimogyo, Nakagyo, Higashiyama, Minami and Kamigyo wards were extracted, and medians, quartiles, maximums and median year-on-year changes were calculated by ward. National rankings and the prefectural average are from Kyoto Prefecture’s “Overview of the FY2026 Official Land Price Survey.”
ADR and occupancy: within the scope MetroEngines Research & Consulting covers, approximately 168,000 properties nationwide are tracked, of which roughly 27,000 properties and 1.26 million rooms with confirmed activity on OTAs form the analysis set. Ward-level estimated settled ADR is the average of monthly values from August 2025 to July 2026, with the number of properties aggregated each month shown in Table 6. Wards with seven or fewer properties aggregated (Kita, Yamashina, Fushimi, Nishikyo) are not shown. Estimated occupancy uses the all-property average for May–August 2026 at the Kyoto Prefecture level.
Building starts: building counts, total floor area and planned construction costs for accommodation-use buildings in Kyoto Prefecture were taken annually from the Ministry of Land, Infrastructure, Transport and Tourism’s “Building Construction Starts Statistics” (e-Stat statistics ID 0003114490). Construction costs are the amounts planned at the time of the building confirmation application and tend to come in below actual construction costs. The ¥2.026m per tsubo used for construction cost A is an assumed figure for a room-led RC-frame build, in line with the 2025 national average for accommodation and food service use in the same statistics (¥1,598.0bn in planned construction cost ÷ 2,537 thousand sqm of floor area = approximately ¥630,000/sqm = approximately ¥2.082m/tsubo).
REIT: room-led properties in Kyoto City were extracted from the REIT ownership master (N=302 properties, snapshot as of 24 August 2026). Properties where the stated acquisition date may in fact be a construction date are excluded.
Related reading
- Leasehold Hotel Development: 1.38x Land Price Reach Across 9 Markets
- Department Store Sites: 6 of 14 Go Hotel, ADR Needs 1.4-3.1x Market
- Hotel Acquisition Costs 7.1%: A 6.5% Gross Yield Becomes 4.65% Net
- Hakodate Station Land +10.3%, Goryokaku Flat: 226 Hotels, 11,449 Rooms
- Station Premium Ends at an 8-Minute Walk: 8 Stations, 1,012 Hotels
References and sources
■ Data sources
Regulatory parameters are from Kyoto City’s “Height District Plan” (as of April 2026) and “Explanation of the Height District Plan for 31m and Space-Creation Height Districts” (April 2023), Kamakura City’s “Height District Designation Expansion Policy,” Kanazawa City’s “Overview of Height Districts” (last amended 1 December 2021), and Nara City’s “Height Districts and Fire Prevention Districts.” Land prices are from Kyoto Prefecture’s “FY2026 Official Land Price Survey: Standard Site Price List” (as of 1 January 2026; 66 commercial standard sites across Kyoto City’s five core wards). Estimated settled ADR and estimated occupancy are from MetroEngines Research & Consulting (ward-level ADR is the monthly average from August 2025 to July 2026; estimated occupancy is the May–August 2026 average at the Kyoto Prefecture level). Building starts are from the Ministry of Land, Infrastructure, Transport and Tourism’s “Building Construction Starts Statistics” (e-Stat statistics ID 0003114490). REIT acquisition prices are from the REIT ownership master (N=302 properties, snapshot as of 24 August 2026).
■ Estimation assumptions
36sqm of gross floor area per room (mid-market room-led: 22sqm guest room plus common areas and back of house), 80% building coverage, 600% designated FAR, a 3.3m floor-to-floor height on guest room floors, no rooftop structure allowance applied. Effective FAR = min(designated FAR, coverage ratio × maximum floor count); maximum floor count = floor(absolute height ÷ floor height). Land cost per room = land price × GFA per room ÷ effective FAR. On the revenue side, the base case uses 86.6% estimated occupancy (Kyoto Prefecture, May–August 2026 average), a 92% rooms revenue ratio, a 35% GOP margin and a 5.0% target NOI yield, flexed into optimistic and pessimistic scenarios (Table 9-2) across a 32–38% GOP margin, a 4.5–5.5% target NOI yield and ¥20.15m–¥27.18m per room in construction cost.
■ Limitations and caveats
Because the calculation simplifies by treating each floor’s area as equal to the building footprint, it does not account for upper-floor losses from road setback rules, shadow regulations, setbacks, landscape districts, scenic districts or fire prevention rules. The “reachable for lodging” column for the 31m height districts is our own reading of each category’s land-use conditions as applied to a lodging-only scheme; feasibility for any individual project depends on consultation with the relevant city department. Land prices are the distribution of standard sites, not transaction prices for individual sites, and the medians for Minami (N=6) and Kamigyo (N=5) carry a wide margin of representativeness given the small number of sites. Estimated occupancy is an estimate based on the take-up of inventory sold on OTAs and is defined differently from a property’s overall actual occupancy. Estimated settled ADR carries a median error of approximately 7% against property-level disclosures by listed hotel REITs (184 property-months, April–May 2026). Planned construction costs are the values at the time of the building confirmation application and tend to come in below actual costs. This article is a simplified estimate and does not recommend any particular investment or acquisition decision.
■ Regulation and city planning (primary sources)
- Kyoto City, “Height Districts” (City Planning Division) — Height District Plan and Explanation of Height Districts (31m and space-creation type)
- Kyoto City, “Kyoto City Planning: Amendment of Height Districts (Kyoto City decision),” Height District Plan (PDF)
- Kyoto City, “Explanation of the Height District Plan for 31m and Space-Creation Height Districts” (April 2023, PDF)
- Kyoto City, “Revising City Planning Toward a Livable, Attractive and Vibrant City (April and November 2023 city planning amendments)”
- Kyoto City, “Revising City Planning,” detailed pamphlet (PDF)
- Kamakura City, “Height Districts” (city planning)
- Kamakura City, “Kamakura City Planning Height District Designation Expansion Policy” (PDF)
- Kanazawa City, “Overview of Height Districts”
- Nara City, “Height Districts and Fire Prevention Districts”
■ Land prices and government statistics
- Kyoto Prefecture, “Land Prices in Kyoto Prefecture (Official Land Price Survey and Land Price Research)”
- Kyoto Prefecture, “Overview of the FY2026 Official Land Price Survey (Kyoto Prefecture)” (PDF)
- Kyoto Prefecture, “FY2026 Official Land Price Survey: Standard Site Price List (Kyoto Prefecture)” (PDF)
- Ministry of Land, Infrastructure, Transport and Tourism, “Official Land Price Survey”
- e-Stat, “Building Construction Starts Statistics” (statistics ID 0003114490, accommodation use, Kyoto Prefecture)
■ Market data
- MetroEngines Research & Consulting — estimated settled ADR (by ward, monthly), estimated occupancy (Kyoto Prefecture, by category), REIT ownership master (snapshot as of 24 August 2026)
- Invincible Investment Corporation, “FY December 2024 Results Presentation” (PDF) — 38.9% GOP across 91 MHM-operated properties (FY ended December 2024)
- Ichigo Hotel REIT Investment Corporation, “Portfolio”