

The FY2025 tax reform, effective 1 April 2025, added a new category to Japan’s SME Management Enhancement Tax System (中小企業経営強化税制): Type E, “business-scale expansion equipment” (経営規模拡大設備等). For the first time, the reform brings the building itself — previously excluded — inside the scope of the relief. For hotels and ryokan, that means the structure that absorbs the bulk of the investment now carries a tax benefit of its own. But focusing on the headline rate misreads the scheme. This article first pins down the rules at the level of the statute and the official guidance, then quantifies first-year cash effect and the reduction in payback period across two models: a 100-room limited-service hotel new build, and a 40-room ryokan renovation.
It is worth separating what this article covers from ground we have already gone over. Our earlier work on labour-saving investment subsidies dealt with subsidies — cash grants, which reduce the investment amount directly. The tax measures here work differently: they are a deferral of taxable income (bonus depreciation) and a direct reduction of tax payable (tax credit). Bonus depreciation does not shrink the investment; it front-loads the timing of tax relief, and the benefit reverses in later years. Separately, hotel fixed asset tax is a holding tax incurred every year, while acquisition costs — which we costed at 7.1% of the price in Hotel Acquisition Costs 7.1%: A 6.5% Gross Yield Becomes 4.65% Net — are a one-off cost at purchase. This article covers investment incentives attaching to acquisition (new build or renovation). All four hit the payback period in completely different ways.
Metric Definitions Used in This Article
- ADR (average daily rate): an estimated realised rate (tax-exclusive equivalent) derived by applying a segment-specific adjustment factor to the lowest published plan rate each property lists on OTA channels (double occupancy, per room, tax-inclusive). Cross-checked against property-level disclosures from listed hotel REITs (91 properties, trailing three months), the median error is approximately 7%. These are estimates and differ from each property’s actual transacted rates and accounting figures. Area-level ADR is the median across the properties covered (the level of a typical property in that area).
- OCC (occupancy): sold rooms as a share of total rooms in the area (an estimate based on OTA sales inventory). In this article it is used as a modelling assumption.
- GOP (gross operating profit): revenue less departmental and administrative costs, before depreciation, interest and tax.
- NOI: in this article, defined as GOP less the FF&E (furniture, fixtures and equipment) reserve.
- Data sources: MetroEngines Research & Consulting (ADR) / SME Agency, National Tax Agency, Ministry of Health, Labour and Welfare, Ministry of Land, Infrastructure, Transport and Tourism (rules and statistics)
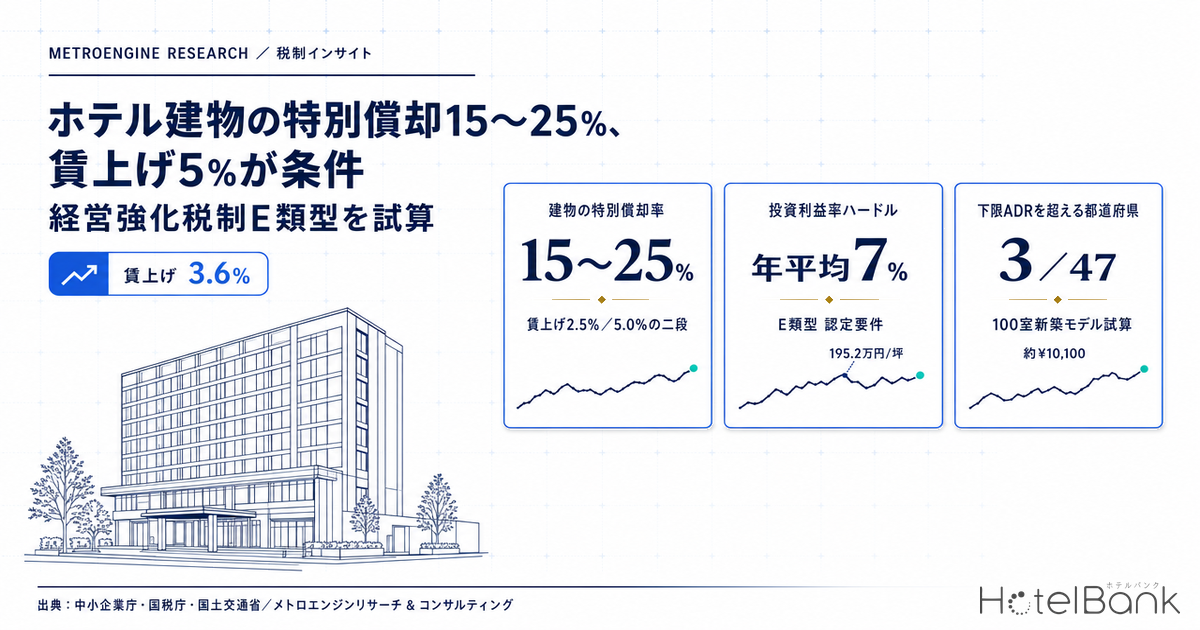
The conclusion first. Hotels and ryokan are explicitly inside the list of eligible industries, and bonus depreciation of 15–25% on the building is genuinely available to them. In practice, though, the bottleneck is neither the depreciation rate nor the payroll condition. It is the entry threshold of “revenue above ¥1bn” and the hurdle of “an average return on investment of 7% or more”. With construction costs now at ¥1.952mn per tsubo (3.31 m²), a 100-room new build needs an estimated realised ADR of roughly ¥10,100 to clear that 7%, and only three of Japan’s 47 prefectures sit above that level. Meanwhile, what a single-property owner can realistically use is not Type E but Type A, which allows immediate expensing of building fixtures from ¥600,000 upward. This is a scheme whose right route forks completely by operator size — that is the reading this article arrives at.
- — The building itself is in scope for the first time. Type E bonus depreciation is 15% where payroll rises 2.5% or more, and 25% where it rises 5.0% or more. Below 2.5%, the building relief is zero.
- — The gate is the entry threshold, not the rate. Revenue above ¥1bn means roughly 430 rooms for a limited-service hotel (220 in Tokyo). Sole proprietors cannot use the scheme at all.
- — The 7% return-on-investment wall. At ¥1.952mn per tsubo, a 100-room new build needs a floor ADR of about ¥10,100. Only Tokyo, Kyoto and Fukuoka clear it.
- — Bonus depreciation is a deferral, not a reduction. Against a first-year effect of ¥178.1mn under the 25% route, the net present-value effect is ¥73.94mn — 2.8% of total investment.
- — For single-property owners, Type A is the real answer. On ¥95mn of renovation capex, immediate expensing is worth ¥32.71mn in total tax effect. The tax credit route delivers only 11.0% of its own headline allowance.
How the scheme is built — lodging is named in the eligible-industry list
Start by pinning down eligibility at the level of the statute and the guidance. The SME Agency’s “Guide to Using Support Measures under the Act on Facilitating Management Enhancement of SMEs (Tax and Finance), 1 April 2026 edition” enumerates the designated businesses for the SME Management Enhancement Tax System, and “lodging business” is named explicitly. Whether hotels and ryokan fall inside the eligible industries is therefore not a matter for inference.
The exclusions deserve more attention. The same guide lists electricity, water supply, railways, air transport, banking and entertainment (excluding cinema) as outside the scheme, and separately excludes adult-entertainment businesses defined under Article 2(5) of the Act on Control and Improvement of Amusement Business. It also limits eligibility for restaurants: “restaurant businesses such as ryotei, bars, cabarets, nightclubs and similar establishments qualify as designated businesses only where operated by a member of a sanitation industry association.” Where a lodging property houses a bar or a large entertainment facility on site, the treatment of equipment serving that portion is worth confirming in advance.
| Item | Content (SME Agency guide, 1 April 2026 edition; National Tax Agency Tax Answer No. 5434) |
|---|---|
| Statutory basis | Act on Special Measures Concerning Taxation, Article 42-12-4 (corporation tax) / Article 10-5-3 (income tax) |
| Eligible SMEs | Corporations with capital or contributions of ¥100mn or less; corporations without capital or contributions with 1,000 or fewer permanent employees; individuals with 1,000 or fewer permanent employees; cooperatives and similar. Limited to entities qualifying as “specified business operators” under Article 2(6) of the Act on Facilitating Management Enhancement of SMEs |
| Excluded corporations | (1) Corporations more than half owned by a single large corporation; (2) corporations two-thirds or more owned by two or more large corporations; (3) corporations whose average income over the preceding three fiscal years exceeds ¥1.5bn |
| Designated period (expiry) | 1 April 2017 through 31 March 2027. The SME Agency states the expiry explicitly as “end of FY2026 (31 March 2027)” |
| Designated businesses | Manufacturing, construction, wholesale, retail, real estate, information and communications, lodging, laundry / barber / beauty / bathhouse services, other personal services, education and learning support, medical and welfare services, and others |
| Excluded industries | Electricity, water supply, railways, air transport, banking, entertainment (excluding cinema) and others. Adult-entertainment businesses are also excluded |
| Categories | A (productivity-enhancing equipment) / B (profitability-enhancing equipment) / D (business-resource consolidation equipment) / E (business-scale expansion equipment). Type C (digitalisation equipment) was abolished as of 1 April 2025 |
The measures available under each category can be organised as follows. Types A, B and D offer immediate expensing or a tax credit of 10% of acquisition cost (7% for corporations with capital above ¥30mn), and cover machinery, tools, fixtures and fittings, building fixtures and software. The building itself is not in that list. The building comes into scope only under Type E, and even there it is treated separately: not immediate expensing, but bonus depreciation of 15% (25%) or a tax credit of 1% (2%) of acquisition cost.
| Category | Eligible assets and minimum acquisition cost | Measure |
|---|---|---|
| Type A Productivity-enhancing equipment | Machinery ¥1.6mn+; measuring and inspection tools ¥400k+; fixtures and fittings ¥400k+; building fixtures ¥600k+; software ¥700k+. Must deliver average annual productivity gains of 1% or more versus the prior model | Immediate expensing, or a tax credit of 10% of acquisition cost (7% where capital exceeds ¥30mn) |
| Type B Profitability-enhancing equipment | Machinery ¥1.6mn+; tools ¥400k+; fixtures and fittings ¥400k+; building fixtures ¥600k+; software ¥700k+. Average annual return on investment of 7% or more | As above |
| Type D Business-resource consolidation equipment | As above. Package investment expected to improve modified ROA or tangible fixed asset turnover | As above |
| Type E Business-scale expansion equipment | The above plus the building and its fixtures. Average annual return on investment of 7% or more, and the equipment must be integral to an investment plan confirmed by the Minister of Economy, Trade and Industry (via a METI regional bureau) | Immediate expensing or a 10% (7%) tax credit. The building and its fixtures, however, receive bonus depreciation of 15% (25%) or a tax credit of 1% (2%) of acquisition cost |
There is a shared cap on the tax credit. The combined credit under the SME Management Enhancement Tax System and the SME Investment Promotion Tax System cannot exceed 20% of corporation tax (income tax) for that fiscal year, with any excess carried forward one year. Bonus depreciation is treated more generously: where the full allowable amount is not booked, the shortfall carries forward to the following fiscal year. As discussed below, this cap effectively decides the choice for smaller operators.
The Type E gate is “revenue above ¥1bn” — what that means in rooms
Type E, which brings the building into scope, was created by the FY2025 tax reform and took effect on 1 April 2025 under the amending legislation to the Income Tax Act and related laws. This is where the practical fork appears. The guide sets out the eligible-company requirements as follows.
Eligible companies: (1) corporations with revenue above ¥1bn and below ¥9bn; (2) with the business, financial and organisational foundations in place to pursue revenue above ¥10bn. Sole proprietors cannot use this scheme. Certification also requires the confirmation application and the management enhancement plan application to fall in the same fiscal year.
Content of the investment plan: (1) a roadmap setting out the initiatives for revenue growth and the timing of capital investment; (2) a target of revenue above ¥10bn with average annual revenue growth of 10% or more; (3) an increase in salary payments. A “¥10bn Declaration” must be filed in advance.
Business-scale expansion equipment: (1) the equipment must contribute to revenue growth; (2) within two years of certification of the management enhancement plan, the aggregate acquisition cost of the planned equipment must reach the higher of ¥100mn or 5% of prior-year revenue; (3) the introduction of productivity-enhancing equipment must be accompanied by the new construction or extension of the building and its fixtures.
Three points are easily missed. First, the scope is the “new construction or extension” of a building; simply acquiring an existing building from a third party is not contemplated. The classic value-add deal — buying a second-hand hotel and renovating it — should be read as outside Type E’s reach as far as the building itself is concerned. Second, sole proprietors cannot use it. An owner-operated ryokan that has not incorporated cannot even reach the starting line. Third, the investment plan must set out a roadmap toward “average annual revenue growth of 10% or more” and “revenue above ¥10bn”. An operator at ¥4bn of revenue growing 10% a year needs 9.6 years to reach ¥10bn; from ¥1.2bn it takes 22.2 years. What the scheme has in mind is a multi-property operator on a growth trajectory.
So what does “revenue above ¥1bn” look like in rooms? We worked backwards from estimated realised ADR compiled by MetroEngines Research & Consulting (monthly averages of actuals from September 2025 to August 2026, all 47 prefectures). Limited-service hotels show a median estimated realised ADR across the 47 prefectures of about ¥7,300 (N=7,392 properties); ryokan, about ¥13,600 (N=6,720 properties).
| Segment and assumptions | Est. realised ADR | Rooms needed for ¥1bn revenue | Rooms equivalent to ¥9bn revenue |
|---|---|---|---|
| Limited-service hotel (median of 47 prefectures) Assumes OCC 78% (full-year modelling assumption) and 12% non-room revenue | ¥7,265 | approx. 432 rooms | approx. 3,885 rooms |
| Limited-service hotel (Tokyo) | ¥14,417 | approx. 218 rooms | approx. 1,958 rooms |
| Limited-service hotel (Tokushima, lowest) | ¥5,663 | approx. 554 rooms | approx. 4,986 rooms |
| Ryokan (median of 47 prefectures) Assumes OCC 60% (full-year modelling assumption) and 5% non-room revenue | ¥13,590 | approx. 320 rooms | approx. 2,880 rooms |
In other words, the operator Type E has in mind runs somewhere between 430 rooms (220 in Tokyo) and 3,900 rooms as a limited-service hotel business, or between 320 and 2,900 rooms as a ryokan business. A single 40-room ryokan, or a single 100-room limited-service hotel, sits short of that gate. The headline — 15–25% bonus depreciation on the building itself — is attractive, but the reality is that it is available only to operators running multiple properties who can credibly draw a growth roadmap.
The real gate is the 7% return on investment — at ¥1.952mn per tsubo the floor ADR is about ¥10,100
Assume the entry threshold is cleared. The next obstacle is the requirement that “the average annual return on investment is expected to be 7% or more”. The guide defines the formula as follows.
Average annual return on investment = increase in “operating profit + depreciation” ÷ capital investment
Note: depreciation here is accounting depreciation. The increase is the average over the years from the year after acquisition through the longest useful life among the assets acquired. Capital investment is the aggregate acquisition cost in the year of acquisition.
Insert current construction costs and the weight of that requirement becomes visible. Based on MLIT’s Statistical Survey on Building Construction Starts, hotel construction cost in 2025 averaged ¥1.952mn per tsubo (3.31 m²) across all structures (¥2.405mn for steel-frame, ¥2.026mn for reinforced concrete), a record high driven by the construction cost inflation of recent years. At 10.6 tsubo (about 35 m²) of gross floor area per room including common areas, the building acquisition cost works out to roughly ¥20.69mn per room. That per-room unit cost is corroborated on a planned-project basis: across 31 planned hotel projects, gross floor area per room averages 35.0 m² and construction cost per room ¥20.67mn.
Taking that construction cost as given, the estimated realised ADR a 100-room new build needs in order to hit a 7% return on investment works out to about ¥10,100 (assuming OCC 78% as a full-year modelling assumption, a 50% GOP margin and a 3% FF&E reserve; see the modelling assumptions below). Among limited-service hotel estimated realised ADR across the 47 prefectures, only Tokyo, Kyoto and Fukuoka sit above that line. Osaka is essentially level with it and should be read as a borderline case.
That floor depends heavily on the assumptions, and the point deserves emphasis. Lift OCC to 85% and the floor ADR falls to about ¥9,300, bringing Osaka into range. Raise the GOP margin to 55% and it drops to about ¥9,200, adding Kanagawa (¥9,216). Conversely, under a conservative OCC of 70% (full-year modelling assumption) and a 45% GOP margin, the floor jumps to about ¥12,600 and only Tokyo and Kyoto survive. Whether Type E is usable is therefore decided by the ADR level of the location multiplied by operating efficiency. With construction cost holding around ¥1.95mn per tsubo, this gate belongs earlier in the analysis than any discussion of depreciation rates.
| Operating assumptions | Floor ADR for a 7% return on investment | Prefectures above the floor |
|---|---|---|
| OCC 70% (full-year modelling assumption), GOP margin 45% (conservative) | approx. ¥12,600 | 2 |
| OCC 78% (full-year modelling assumption), GOP margin 50% (base case in this article) | approx. ¥10,100 | 3 |
| OCC 85% (full-year modelling assumption), GOP margin 50% | approx. ¥9,300 | 4 |
| OCC 78% (full-year modelling assumption), GOP margin 55% | approx. ¥9,200 | 5 |
| Est. realised ADR \ OCC (full-year modelling assumption) | 70% | 74% | 78% | 82% | 86% |
|---|---|---|---|---|---|
| ¥9,000 | 5.6% | 5.9% | 6.2% | 6.5% | 6.9% |
| ¥10,000 | 6.2% | 6.6% | 6.9% | 7.3% | 7.6% |
| ¥11,000 | 6.8% | 7.2% | 7.6% | 8.0% | 8.4% |
| ¥12,000 | 7.4% | 7.9% | 8.3% | 8.7% | 9.1% |
| ¥13,000 | 8.1% | 8.5% | 9.0% | 9.4% | 9.9% |
The payroll condition that splits 15% from 25% — how to read lodging’s 3.6%
Whether the building’s bonus depreciation rate is 15% or 25% turns on wage growth. The guide’s note reads as follows. Where total employee salary payments in the fiscal year in which the building and its fixtures are placed in service rise 2.5% or more over the prior year (and are at or above the target stated in the investment plan), bonus depreciation is 15% or the tax credit is 1%; where they rise 5% or more over the prior year (same condition), bonus depreciation is 25% or the tax credit is 2%. Read the other way: in a fiscal year where the increase falls short of 2.5%, neither bonus depreciation nor the tax credit applies to the building and its fixtures at all. Fall below the step and the building relief is zero.
Set those 2.5% and 5.0% steps against actual wage growth in lodging. According to MHLW’s 2025 Survey on Wage Increases, the per-capita wage revision rate was 4.4% across all industries (an increase of ¥13,601). Lodging and food services came in at 3.6% (¥10,177), slightly below the 3.7% recorded in 2024. By industry, only four cleared 5.0% — mining and quarrying (6.1%), construction (5.9%), electricity, gas, heat supply and water (5.3%) and manufacturing (5.2%) — with lodging and food services ranking tenth of fifteen.
Here a distinction matters a great deal. What the scheme requires is a year-on-year increase in total employee salary payments, not in the per-capita wage revision rate. The former is an aggregate, so adding headcount lifts the total even when the per-head raise is modest. For lodging, that gap is decisive.
Take this article’s model operator (assumed at ¥4bn of revenue, 260 employees and average annual pay of ¥3.8mn). Total employee salary payments come to ¥988mn. A 2.5% increase is ¥24.7mn; a 5.0% increase is ¥49.4mn. Implementing the lodging-average wage revision of 3.6% with headcount unchanged yields an increase of ¥35.57mn, or 3.6% — clearing the 2.5% step but short of 5.0%. Yet the additional headcount needed to reach 5.0% is just 3.5 people. Opening a single 100-room property normally means hiring 20 to 25 staff, which would lift total employee salary payments by 11.6% to 13.6%.
Per-capita wage revision rate
Lodging and food services stood at 3.6% (2025; all industries 4.4%). With headcount flat, that does not reach the 5.0% step.
Total employee salary payments
This is what the scheme measures. In a 260-employee model, a 3.6% wage revision plus 3.5 additional staff reaches 5.0%.
How to read it
The 25% step is less “a threshold only for companies with room to raise pay” than a design aimed at development projects that come with hiring.
Type E presupposes an investment plan targeting “average annual revenue growth of 10% or more” and “revenue above ¥10bn” in the first place. Growth normally comes with headcount, and the 25% step is well within reach once the hiring that accompanies a new build or extension is factored in. The condition that deserves more care is the qualifier that the increase must be “at or above the target stated in the investment plan”. Write a conservative target at the confirmation-application stage and an outperformance is safe; write an ambitious one and miss it, and the step is lost. How the target is set becomes a tax question in its own right.
External conditions are pushing the aggregate up as well. On 28 July 2026, the Central Minimum Wage Council recommended a nationwide weighted-average increase of ¥55 (4.9%) for the FY2026 regional minimum wage revisions. Revised in line with the recommendation, the nationwide weighted average would move from ¥1,121 to ¥1,176. In lodging, where part-time and casual staff make up a high share of the workforce, a minimum wage revision feeds directly into total employee salary payments. Judging from the per-capita revision rate of 3.6% alone that “the 5% step is out of reach” would be premature.
Modelling — a 100-room limited-service new build (Type E) and a 40-room ryokan renovation (Type A)
Modelling assumptions (fully disclosed)
| Item | Model A: 100-room limited-service new build | Model B: 40-room ryokan renovation |
|---|---|---|
| Operator | Multi-property operator, revenue ¥4bn, 260 employees, capital ¥50mn (meets the Type E requirements) | Single property, revenue ¥200mn, capital ¥30mn or less (outside Type E) |
| Construction cost / acquisition cost | ¥1.952mn per tsubo × 10.6 tsubo of gross floor area per room = ¥20.69mn per room × 100 rooms = ¥2.069bn (building and its fixtures) + ¥100mn of productivity-enhancing equipment + ¥500mn of land = ¥2.669bn total investment | Building fixtures (full-property HVAC replacement ¥55mn, hot-water systems ¥20mn) ¥75mn + fixtures and fittings ¥12mn + software ¥8mn = ¥95mn |
| ADR (estimated realised) | ¥11,000 (within the observed limited-service range of ¥5,663–¥14,417 across the 47 prefectures) | ¥22,000 (within the observed ryokan range across the 47 prefectures; mid-to-upper level for an onsen destination) |
| OCC (full-year modelling assumption) | 78% | 60% |
| Revenue mix | Room revenue ¥313mn + 12% non-room revenue = total revenue ¥351mn | Room revenue ¥193mn + 4% shop and other = total revenue ¥200mn |
| GOP margin | 50% (the bottom of the 50–60% industry benchmark for limited-service) → GOP ¥175mn | 15% (the top of the 5–15% industry benchmark for ryokan) → GOP ¥30.06mn |
| FF&E reserve | 3% of total revenue (¥10.52mn) → NOI ¥165mn | Outside the model (the tax effect of the renovation capex is assessed on its own) |
| Depreciation | Building, reinforced concrete, 39 years straight-line (¥53.08mn p.a.) + equipment, 15 years (¥6.67mn p.a.) = ¥59.72mn p.a. | ¥12mn p.a. on existing assets |
| Debt terms | LTV 70% (¥1.868bn), interest 2.0% p.a., 25-year equal instalments → annual debt service ¥95.03mn, DSCR 1.73, equity ¥801mn | Interest expense ¥4mn p.a. |
| Effective corporate tax rate | For SMEs in fiscal years beginning on or after 1 April 2026 (outside the size-based business tax): 34.43% on taxable income above ¥8mn, 23.73% between ¥4mn and ¥8mn, and 21.94% at or below ¥4mn. Model A’s tax effect uses 34.43%; Model B’s corporation tax is calculated at the reduced rate of 15% (income up to ¥8mn) plus 23.2% on the excess. The Defense Special Corporate Tax applies 4% to base corporation tax less ¥5mn per year, so it does not arise in Model B (corporation tax of ¥2.61mn). | |
| Discount rate | Present values are discounted at 3.0% p.a. over 39 years (annuity factor 22.808) | |
Note on the GOP margin: Invincible Investment Corporation discloses an actual GOP margin of 38.9% across the 91 properties operated by MHM (fiscal year ended December 2024). Industry benchmarks by segment are 50–60% for limited-service hotels and 5–15% for ryokan (Relo Hotel Solutions). This model sets each segment within its benchmark range.
Model A: 100-room limited-service new build — first-year cash effect and the reduction in payback period
On these assumptions the base case delivers NOI of ¥165mn, depreciation of ¥59.72mn, taxable income of ¥105mn, a tax charge of ¥36.2mn and after-tax cash flow of ¥129mn. Against total investment of ¥2.669bn, the simple after-tax payback period is 20.7 years. The return on investment — “the increase in operating profit plus depreciation (roughly NOI of ¥165mn) divided by capital investment of ¥2.169bn” — is 7.6%, clearing the Type E requirement of 7%. The margin, however, is only 0.6 points.
| Route | Depreciation / credit | First-year cash effect | After-tax payback | Reduction | Net effect, present value |
|---|---|---|---|---|---|
| Base case (no relief) | — | — | 20.7 years | — | — |
| Bonus depreciation 15% (payroll growth 2.5% to under 5%) | ¥310mn | ¥106.9mn | 19.9 years | −0.83 years | ¥44.37mn |
| Bonus depreciation 25% (payroll growth 5% or more) | ¥517mn | ¥178.1mn | 19.4 years | −1.38 years | ¥73.94mn |
| Tax credit 1% (payroll growth 2.5% to under 5%) | ¥20.69mn | ¥20.69mn | 20.6 years | −0.16 years | ¥20.69mn (permanent) |
| Tax credit 2% (payroll growth 5% or more) | ¥41.38mn | ¥41.38mn | 20.4 years | −0.32 years | ¥41.38mn (permanent) |
What must not be misread here is that bonus depreciation is a deferral of taxable income, not a reduction. Even with ¥178.1mn of cash retained in year one, depreciation falls by the same amount from year two onward and the tax charge comes back. Levelled over 39 years and discounted, the net effect is ¥73.94mn under the 25% route and ¥44.37mn under the 15% route. The 1.38-year reduction in payback is likewise a simple-basis figure, obtained by deducting the first-year effect from the investment; fold in the higher tax charges from year two and the effect thins out.
Even so, bonus depreciation beats the tax credit on a present-value basis: 1.79 times comparing the 25% and 2% routes, and 2.14 times comparing 15% and 1%. For an operator with ample taxable income, bonus depreciation is the rational choice. There is also a “special depreciation reserve” variant. Rather than expensing through the profit and loss account, the amount may be appropriated as a reserve out of retained earnings and still be deductible for tax — which means taking the tax deduction without compressing reported net income. Where a lender’s credit assessment keys off accounting profit, that choice matters for preserving borrowing capacity.
Model B: 40-room ryokan — Type E is out of reach, but Type A immediate expensing works
A single ryokan with revenue of ¥200mn does not reach the “revenue above ¥1bn” gate for Type E. Under Type A, however, building fixtures can be expensed immediately from ¥600,000 upward. Look at what hotel and ryokan renovation spending actually consists of and this turns out to be the more practical route. Replacing full-property HVAC, hot-water and boiler plant, electrical systems, lifts — all qualify as building fixtures and satisfy the requirements of a useful life within 14 years and a cost of ¥600,000 or more.
Using a model with ¥95mn of renovation capex, we compare immediate expensing against the 10% tax credit. This ryokan is assumed to have taxable income of ¥14.06mn and corporation tax of ¥2.61mn.
| Route | Headline allowance | Realised in year one | Realised over two years | Constraint |
|---|---|---|---|---|
| Immediate expensing (Type A) | ¥32.71mn ¥95mn × 34.43% | ¥4.84mn | Realised progressively as taxable income arises | The ¥80.94mn in excess of taxable income of ¥14.06mn becomes a loss carryforward. SMEs carry losses forward for 10 years with a deduction limit of 100% of income, so the full amount is recovered against later profits |
| Tax credit 10% (Type A) | ¥9.5mn | ¥520k | ¥1.04mn (11.0% of the allowance) | Capped at 20% of corporation tax (¥520k a year). The carryforward runs one year only; the remainder lapses |
The conclusion is unambiguous. At single-property scale, where corporation tax is small, the tax credit runs into the “20% of corporation tax, one-year carryforward” cap: of a ¥9.5mn allowance, only ¥1.04mn (11.0%) is actually usable. Immediate expensing, by contrast, produces a deduction that can exceed the year’s taxable income and carry forward as a loss for ten years, and SMEs face a deduction limit of 100% of income, so the full amount is recovered against later profits. In total that is ¥32.71mn — roughly 31 times the tax credit. The higher-level question of whether to direct capital toward renovation or new build sits outside this article; it turns on investment cost per key and the ADR lift each route delivers.
Bonus depreciation or tax credit — the fork by operator size
The decision criteria can be organised by size. Three things matter: the size of the corporation tax charge, how much of the other credit allowances are already in use, and whether compressing accounting profit is acceptable.
| Operator’s situation | Recommended route | Rationale |
|---|---|---|
| Single property, corporation tax in the single-digit millions of yen | Immediate expensing / bonus depreciation | The tax credit hits the 20%-of-corporation-tax cap and carries forward only one year, so most of the allowance lapses. Immediate expensing carries forward as a loss for 10 years, deductible against 100% of income |
| First year of operation, loss-making or low income | Immediate expensing / bonus depreciation | As above. A tax credit does nothing without a corporation tax charge to absorb it |
| Already near the 20% cap through other credits such as the wage-growth promotion tax scheme | Bonus depreciation | The tax credit cap is assessed on the combined total under the SME Management Enhancement Tax System and the SME Investment Promotion Tax System, so it squeezes existing allowances |
| Ample taxable income, but accounting profit must be maintained for lender credit assessment | Special depreciation reserve | Appropriating the amount as a reserve out of retained earnings is also deductible for tax, allowing the deduction without compressing reported net income |
| Ample taxable income, and a permanent reduction in tax matters more than single-year cash flow | Tax credit | Bonus depreciation is a deferral while the tax credit is permanent. In Model A, however, bonus depreciation is 1.79 to 2.14 times better even on a present-value basis, so the situations where this choice is rational are limited |
The procedural timeline — file the confirmation application before breaking ground, or the building is out of scope
The most common way Type E goes wrong is the order of the procedure. The SME Agency issued an explicit warning in its notice of 9 May 2025: “Buildings are expected to become eligible under the expanded scope, but a building on which construction begins before the confirmation application for the investment plan is filed will not be eligible.” Commencement of construction is defined here as the date the building confirmation certificate is received under the Building Standards Act. The notice also states that “the exception covering equipment acquired within 60 days before the management enhancement plan application does not apply to the expanded scope.” The relief available under Types A, B and D does not exist for Type E.
| Step | Procedure | Key points and timing |
|---|---|---|
| 1 | File the “¥10bn Declaration” | Required in advance in order to use Type E |
| 2 | Prepare the confirmation application (Form 1) and obtain advance confirmation from a certified public accountant or tax accountant | An advance confirmation letter (Form 2) is issued |
| 3 | Submit and present the confirmation application to the METI regional bureau covering the head office location | The confirmation letter (Form 3) is issued roughly within one month of the presentation. The presentation may be held online |
| 4 | Apply for certification of the management enhancement plan from the competent minister | Standard processing period 30 days. The confirmation letter must be dated on or before the plan application date, and the confirmation application and the plan application must fall in the same fiscal year |
| 5 | Construction begins (building confirmation certificate obtained under the Building Standards Act) | A building on which construction begins before the confirmation application at step 2 is not eligible |
| 6 | Acquisition of the building and its fixtures | Must follow certification of the management enhancement plan |
| 7 | Placed in service | Acquisition and entry into service must fall within the designated period (by 31 March 2027) |
| 8 | Submit the report on the payroll growth rate (Form 7) for the fiscal year of entry into service to the METI regional bureau | Within 20 days of the end of that fiscal year. Filing before the tax return is sufficient |
| 9 | Tax filing | Attach copies of the confirmation letter, confirmation application, plan application, certification and payroll growth report |
| 10 | Submit the investment plan progress report (Form 6) | Annually until the investment plan ends. The first is due within four months of the end of the following fiscal year |
There is one more side effect that is easy to overlook. The guide provides that “companies whose management enhancement plan application lists Type E equipment cannot claim the SME Investment Promotion Tax System or the special provision allowing SMEs to expense small-value depreciable assets.” The small-value depreciable asset provision — where the FY2026 reform raised the per-item ceiling from under ¥300,000 to under ¥400,000, with immediate expensing up to ¥3mn in aggregate — is used every year by many lodging operators. Giving it up for a year in order to elect Type E has to be weighed against the bonus depreciation available on the building.
The expiry also deserves attention. The SME Agency states it explicitly: “expiry: end of FY2026 (31 March 2027).” New construction or extension of a building normally takes 18 months to two years from confirmation application to entry into service. A project not already in design will struggle to reach entry into service within that window. Whether the scheme is extended will be decided in future tax reforms; what is fixed today is the date of 31 March 2027.
Conclusion — read it as a scheme that forks by size
Bringing the building inside the SME Management Enhancement Tax System is a positive change for the lodging industry. What this analysis shows, though, is that the scheme forks completely by operator size.
Multi-property operators (revenue ¥1bn–¥9bn)
Type E delivers 15–25% bonus depreciation on the building itself. In the 100-room new-build model that is a first-year cash effect of ¥106.9mn to ¥178.1mn and an after-tax payback reduction of 0.83 to 1.38 years. The 7% return-on-investment hurdle comes first, however.
Single-property owners (revenue below ¥1bn)
Type E is out of reach, but Type A allows immediate expensing of building fixtures from ¥600,000. On ¥95mn of renovation capex that is ¥32.71mn of total tax effect — roughly 31 times better than the tax credit.
Common pitfalls
Confirmation application before construction starts, acquisition after certification, reporting within 20 days of the end of the fiscal year of entry into service. Get the order wrong and the building falls out of scope. The expiry is 31 March 2027.
Measured by how much payback can be shortened, the effect of bonus depreciation concentrates in year one and, on a present-value basis, comes to ¥73.94mn under the 25% route and ¥44.37mn under the 15% route — 2.8% and 1.7% of total investment of ¥2.669bn. The scheme is worth using, but it will not on its own change whether a project works. What this article set out to show is rather that in an environment where construction cost has reached ¥1.95mn per tsubo, the statutory hurdle of a 7% return on investment is itself a test of how precisely the site and the ADR strategy have been chosen. The tax design gives a further push to projects that already earn well. The practical order of analysis is to confirm first whether the location’s ADR level and operating efficiency can deliver 7%, and only then to choose between depreciation and credit.
Note on tax advice: This article is a general explanation and modelling exercise based on published materials and statistics, and does not constitute individual tax advice. Whether an entity qualifies as an eligible SME, whether its business is a designated business, how the return on investment is calculated, the scope over which total employee salary payments are aggregated, the choice between bonus depreciation and the tax credit, and the treatment of loss carryforwards all turn on the operator’s capital structure, fiscal year and accounting treatment. Before applying the scheme, always confirm in advance with your tax accountant or certified public accountant and with the competent METI regional bureau. The rules may change in future tax reforms.
Related reading
- Hotel Acquisition Costs 7.1%: A 6.5% Gross Yield Becomes 4.65% Net (the one-off costs incurred at purchase)
- Hotel Condominium Tax Arbitrage: Real IRR via 70%+ Building Ratio × Depreciation (an alternative tax structure built on depreciation)
- Japan Minimum Wage 2026: Chiba & Aichi ¥1,195, Oct 1-15 Rollout (the external pressure lifting total employee salary payments)
- Construction +41% & Labor Crunch Erase Japan’s 2027-2029 Hotel Supply (whether a project can reach entry into service before the expiry)
References and sources
Data sources
The rules and tax treatment rest on primary sources: the SME Agency’s “Guide to Using Support Measures under the Act on Facilitating Management Enhancement of SMEs (Tax and Finance), 1 April 2026 edition” and National Tax Agency Tax Answer No. 5434. Wage data are from MHLW, “Summary of the 2025 Survey on Wage Increases”, Table 2; construction costs from MLIT, “Statistical Survey on Building Construction Starts”. Estimated realised ADR is compiled by MetroEngines Research & Consulting (monthly averages of actuals September 2025 – August 2026; limited-service hotels N=7,392 properties / ryokan N=6,720 properties, all 47 prefectures).
Modelling assumptions
Model A (100-room limited-service new build) = construction cost ¥1.952mn per tsubo, 10.6 tsubo of gross floor area per room, estimated realised ADR ¥11,000, OCC 78% (full-year), non-room revenue 12%, GOP margin 50%, FF&E reserve 3%, capital investment ¥2.169bn, effective corporate tax rate 34.43%, discount rate 3.0% over 39 years. Model B (40-room ryokan renovation) = renovation capex ¥95mn, taxable income ¥14.06mn, corporation tax ¥2.61mn. Average annual return on investment = NOI ÷ capital investment. Every item is disclosed in the “Modelling assumptions (fully disclosed)” table in the body.
Limitations
ADR is an estimated realised rate derived by applying segment-specific adjustments to published OTA rates, and differs from each property’s actual transacted rates and accounting figures (the median error against property-level disclosures from listed hotel REITs is approximately 7%). OCC, the GOP margin and the non-room revenue ratio are modelling assumptions, not measured values. The floor ADR of approximately ¥10,100 and the figures in the two-axis sensitivity grid are modelled on this article’s assumptions; the only statutory threshold is the 7% return on investment. Tax conclusions vary with the operator’s capital structure, fiscal year and accounting treatment, so advance confirmation with a tax accountant or certified public accountant and with the competent METI regional bureau is required before applying the scheme.
Rules and tax (primary sources)
- SME Agency, “Guide to Using Support Measures under the Act on Facilitating Management Enhancement of SMEs (Tax and Finance), FY2026 tax reform edition” (1 April 2026)
- National Tax Agency Tax Answer No. 5434, “SME Management Enhancement Tax System (bonus depreciation or tax credit where an eligible SME acquires specified management-enhancement equipment)”
- SME Agency, “SME Management Enhancement Tax System” (expiry: end of FY2026, 31 March 2027)
- SME Agency, “Points to Note Regarding the Expanded Scope under the FY2025 Tax Reform” (9 May 2025)
- SME Agency, “Confirmation Letters Issued by the Minister of Economy, Trade and Industry (business-scale expansion equipment, Type E)”
- METI, “FY2026 Tax Reform in the Economy, Trade and Industry Field” (December 2025)
- National Tax Agency Q&A, “Deductible amount where a company applying tax-effect accounting appropriates reserves under the Act on Special Measures Concerning Taxation out of retained earnings”
- JETRO, “Overview of Corporate Income Taxes (corporation tax, corporate inhabitant tax, enterprise tax)” — statutory effective tax rate for SMEs
Statistics and wages
- MHLW, “Summary of the 2025 Survey on Wage Increases”, Table 2 (per-capita wage revision amounts and rates by industry)
- MLIT, “Statistical Survey on Building Construction Starts” (hotel construction cost, cost per tsubo by structure)
- MHLW Central Minimum Wage Council, “Guideline for the FY2026 Regional Minimum Wage Revisions” (recommendation of 28 July 2026; nationwide weighted average ¥55 / 4.9%)
Market data and industry benchmarks
- MetroEngines Research & Consulting — estimated realised ADR (47 prefectures; limited-service hotels N=7,392 properties / ryokan N=6,720 properties, monthly averages of actuals September 2025 – August 2026)
- Invincible Investment Corporation, portfolio disclosure (GOP margin of 38.9% across 91 MHM-operated properties, fiscal year ended December 2024)
- Relo Hotel Solutions, “GOP margin benchmarks by segment”