

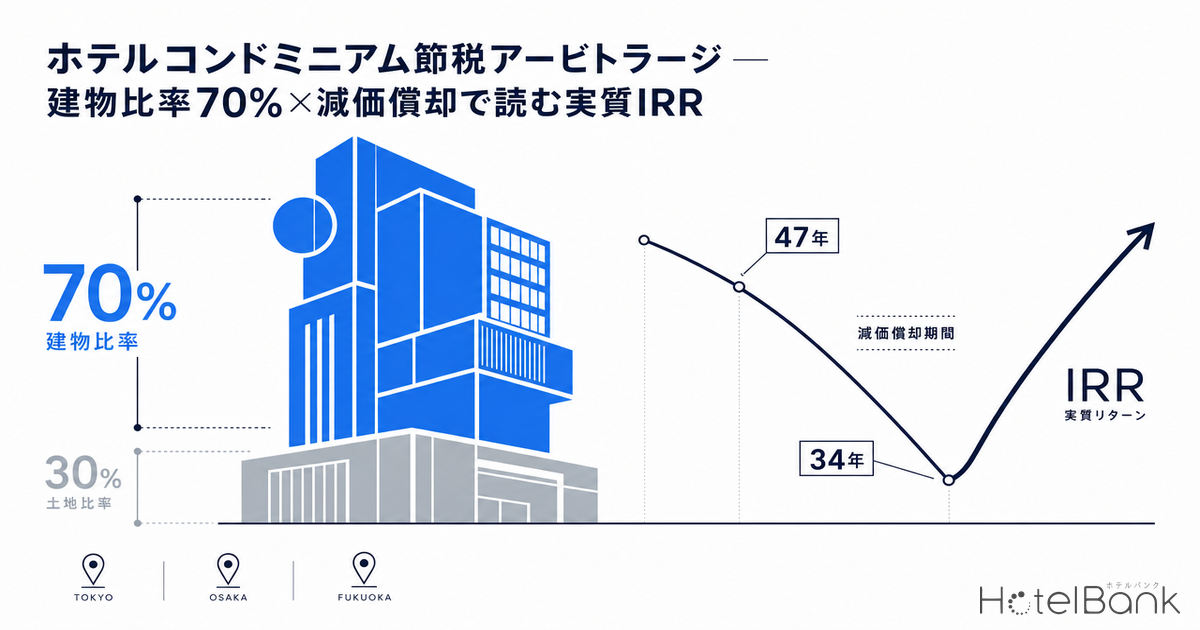
Hotel condominiums in resort destinations — where individual units of a strata-titled building are operated as hotel rooms — appear unremarkable when judged purely on operating yield. Income yield on high-end Niseko condos, for instance, has reportedly run at a real 1–3% even pre-COVID. Yet ultra-high-net-worth investors in the top tax bracket still channel capital into this product. The reason lies in the structure of “real IRR” — operating distributions layered with a tax effect created by a building ratio above 70% combined with depreciation-driven tax deferral. This article uses the building allocation, useful life, and annual depreciation of a single strata-titled unit to model the tax-deferral effect, anchors the operating-distribution baseline in actual ADR/OCC dynamics across Okinawa, Niseko, and Karuizawa, and quantifies the risks all the way through to exit (sale).
Metric Definitions Used in This Article
- ADR (Average Daily Rate): Average of advertised prices on OTAs. Differs from actual transacted prices — cross-checks against REIT disclosures show advertised ADR runs roughly +25–30% higher than transacted ADR (unsold high-priced plans linger on OTAs, pushing the average of public prices above contracted prices). Per-room rate for 2 guests/room (tax included), averaged across all plans (room-only through meal-included).
- OCC (Occupancy Rate): Ratio of sold rooms to total room inventory in the area (estimated from OTA inventory).
- Real IRR: In this article, a simplified internal-rate-of-return concept that bundles “operating distribution (income) + depreciation-driven tax deferral − capital-gains tax at exit.” It is illustrative only and does not guarantee the actual return of any specific product.
- Data Source: MetroEngines Research & Consulting
- — Resort hotel condos look like a 1–3% real yield product on operating income alone, but they should be read on a “real IRR” basis that layers tax deferral from a building ratio above 70% × depreciation on top.
- — The core mechanism is a ~35pt tax-rate arbitrage that shifts income taxed at the top bracket (45% income tax + 10% resident tax = 55%) into long-term capital gains taxed at 20.315% after a 5-year-plus holding period.
- — Kutchan’s average ADR is ¥56,400 on a trailing 12-month basis (May 2025 – April 2026); winter-peak Niseko sits around ¥89,040. The baseline for operating distributions varies sharply by location.
- — Layering the tax effect onto three ADR/OCC sensitivity scenarios (bear 2.2% / base 3.2% / bull 4.6%) lifts the base scenario to a tax-inclusive benefit of around 4%, while at exit, book-value depreciation, capital-gains tax, and liquidity determine whether the structure actually works.
How It Differs from Membership and Branded Residence Products
UHNW resort real estate products generally split into three layers. First, membership-style products (shared-ownership / right-to-use). Second, pure branded residences (for owner-occupancy or as a second home). Third, the hotel condominium structure that is the subject of this article. What decisively distinguishes hotel condos from the other two is that they combine “strata-title ownership” with “hotel-operator-managed revenue activity.” Owners lease their rooms to the operator during periods they do not use them, and earn operating distributions from third-party stays.
This revenue-generating character is exactly what creates the tax angle for retail UHNW investors. A membership share is a usage right, not a depreciable asset; a branded residence used as a second home does not generate business income. A hotel condo, on the other hand, holds a strata-titled building as a depreciable asset and reports the profit/loss generated from it. In other words, the “retail UHNW × tax planning × depreciation” angle simply does not exist for memberships or pure residences — it is a theme unique to hotel condominiums. This article focuses on that single point. The asymmetric economics on the developer side of branded residences and membership-style schemes — where the developer recoups capital differently from the owner’s real IRR — is a separate topic beyond the scope of this article.
Building Allocation Above 70% × Depreciation — The Mechanical Structure of Tax Deferral
The mechanism starts with allocating the acquisition price between “land” and “building.” Land is not depreciable; the building is depreciated over its useful life. Resort hotel condos sit on small individual land shares within strata-title developments, and consequently the building portion often exceeds 70% of acquisition value. The larger the depreciable base, the larger the annual depreciation charge.
Useful life depends on construction type. Reinforced-concrete (RC) buildings use 47 years, and heavy steel-frame buildings use 34 years as statutory useful-life benchmarks. The table below mechanically estimates annual depreciation and the resulting tax-deferral effect against the top tax bracket (45% income tax + 10% resident tax = 55%), using an illustrative ¥50 million acquisition price with a 75% building allocation.
| Item | RC (47 yrs) | Steel-frame (34 yrs) |
|---|---|---|
| Acquisition Price | ¥50M | ¥50M |
| Building Allocation (75%) | ¥37.5M | ¥37.5M |
| Land Allocation (25%) | ¥12.5M | ¥12.5M |
| Annual Depreciation (straight-line) | ~¥800k | ~¥1.1M |
| Tax-Deferral Effect (55% bracket) | ~¥440k / yr | ~¥610k / yr |
Steel-frame’s shorter useful life produces larger annual depreciation and a thicker deferral effect. But this is strictly “deferral” — the tax does not disappear, which is the core of the structure. As depreciation progresses, the building’s book value declines, and on sale, the gap between sale price and that reduced book value is taxed as a capital gain. In other words, income compressed at a high marginal rate (55%) returns later at the low long-term capital-gains rate (20.315%). This rate spread is the source of the arbitrage.
Tax-Rate Arbitrage — Shifting the 55% Bracket to the 20.315% Bracket
Salary and business income in the top bracket is taxed at 55% in total (45% income tax + 10% resident tax). Capital gains on real estate held for more than 5 years (long-term capital gains), by contrast, fall under separate taxation at 20.315% (15.315% income tax + 5% resident tax). Compressing income in the 55% bracket via depreciation and shifting it into a future 20.315% capital gain — this roughly 35-point rate gap is precisely what creates the real return that operating yield alone cannot explain.
Conversely, a sale within 5 years counts as a short-term capital gain, taxed at 39.63% (30.63% income tax + 9% resident tax). In that case, the rate gap narrows from 55% → 39.63% to roughly 15 points, and the arbitrage shrinks dramatically. That is why exit timing design largely determines the real IRR. The table below estimates annual benefit and exit taxation by construction type, assuming a ¥50M acquisition, 75% building allocation, 2.5% operating yield, 5-year hold, and flat property prices.
| Item | RC (47 yrs) | Steel-frame (34 yrs) |
|---|---|---|
| Annual Operating Distribution (2.5% yield) | ~¥1.25M | ~¥1.25M |
| Annual Tax-Deferral Effect (55% bracket) | ~¥440k | ~¥610k |
| Annual Benefit (vs. Acquisition Price) | ~¥1.69M (3.4%) | ~¥1.86M (3.7%) |
| Book-Value Decline after 5 yrs | ~¥3.99M | ~¥5.51M |
| Exit Capital-Gains Tax (long-term 20.315%) | ▲~¥810k | ▲~¥1.12M |
| 5-Year Cumulative (flat-price assumption) | ~¥7.63M | ~¥8.16M |
Adding tax deferral on top of a surface 2.5% operating yield lifts the annual benefit-to-acquisition ratio to 3.4–3.7%. For UHNW investors whose operating distributions are diluted “after tax,” this tax effect can lift real IRR by roughly one percentage point. That is why this product must be read on a total tax-inclusive basis — operating yield alone is insufficient.
⚠ Tax Considerations as a Necessary Condition: For an individual owner of a hotel condominium, revenue earned through an operator-management arrangement may be classified as “miscellaneous income” rather than “real-estate income.” When classified as miscellaneous income, it cannot be offset against salary income, and the depreciation-driven tax effect described in this article may not materialize. Whether depreciation can be offset against salary or other income depends on the contract structure, operational reality, and income classification — the estimates in this article are general in nature and do not endorse any specific product. Individual consultation with a tax advisor is essential for actual investment decisions.
Location-Specific ADR/OCC Dynamics — The Operating Distribution Baseline
However thick the tax effect, the operating distribution that underpins it is set by the area’s ADR and occupancy dynamics. Drawing on MetroEngines Research data, the table below summarizes ADR dynamics across Okinawa (mainland resorts, Miyako, Yaeyama), Niseko (Kutchan, Niseko Town), and Karuizawa. Prices are per-room rates for 2 guests/room (tax included), averaged across all plans.
| Area | Trailing 12M Avg ADR | Monthly Peak | Monthly Trough | Demand Profile |
|---|---|---|---|---|
| Kutchan (Hirafu core) | ¥56,400 | ¥89,700 (Feb) | ¥40,500 (May) | Extreme concentration in winter powder season |
| Niseko Town | ¥42,200 | ¥89,000 (Jan) | ¥26,200 (Jun) | Winter-dependent, low in summer |
| Karuizawa Town | ¥40,400 | ¥54,500 (Aug) | ¥36,300 (Feb) | Year-round stability, summer peak |
| Miyakojima City | ¥27,900 | ¥36,700 (Aug) | ¥24,100 (Feb) | Summer peak, high year-round occupancy |
| Ishigaki City | ¥24,700 | ¥36,300 (Aug) | ¥18,900 (Nov) | Summer peak, softening on supply growth |
This seasonality feeds directly into investment decisions. Kutchan and Niseko surge to around ¥89,000 in winter but sink into the ¥26,000s in early summer. On an annual-average basis, Kutchan’s ¥56,400 is one of the highest in Japan, but operating distributions depend on actual demand smoothed across this extreme seasonal concentration. Karuizawa, by contrast, stays within the ¥36,000–¥54,500 range and accumulates occupancy more easily year-round. Miyakojima, with a summer peak at ¥36,700 and a winter trough at ¥24,100, has a moderate swing range and a relatively predictable profile among resort markets.
To reinforce the macro occupancy picture, we cross-reference disclosures from listed REITs. Invincible Investment Corporation (8963) reported May 2026 operating results (101 domestic hotels) with 85.5% occupancy, ADR ¥15,288, and RevPAR ¥13,066 — YoY ADR +3.9% and RevPAR +4.7%, both maintaining positive growth. Japan Hotel REIT Investment Corporation (8985) similarly posted YoY ADR +6.6% and RevPAR +7.9%. The broader uptrend in lodging-market unit prices is a tailwind for resort operating distributions. Note that these REIT ADRs are transacted prices (actuals), differing in nature from this article’s OTA-based advertised ADR — they should be read for YoY directional movement, not absolute levels.
Development Scenario Modeling — Operating Distribution under ADR/OCC Sensitivity
When the operating distribution assumptions (ADR, OCC) move, the real IRR — with tax effect layered on — also shifts. Assuming the high-rate Kutchan area, the table below presents simplified scenarios across ADR and occupancy. Annual operating distribution per room is approximated as “ADR × operating days × operator net-of-fee share to owner (assumed 35% after operator management fees),” and operating yield is calculated against an ¥80M acquisition price.
| Scenario | Assumed ADR | Days/Year | Annual Operating Distribution | Operating Yield |
|---|---|---|---|---|
| A. Bear | ¥45,000 | 110 | ~¥1.73M | 2.2% |
| B. Base Central | ¥56,000 | 130 | ~¥2.55M | 3.2% |
| C. Bull | ¥70,000 | 150 | ~¥3.68M | 4.6% |
Layering the previously calculated tax-deferral effect (about 0.9% of acquisition price for an RC building with 75% building allocation) on top of the base-case operating yield of 3.2% pushes the annual tax-inclusive benefit toward around 4%. Even in the bear scenario, the tax effect provides a floor, lifting the standalone 2.2% operating yield to roughly 3% on a real basis. Add to that the potential for capital gains from Kutchan’s land-price appreciation (+9.7% for residential, +11.4% for commercial in the 2025 official land prices), and total-return upside expands further. Capital gains, however, are uncertain — the design must rest on the foundation of operating distributions and tax effects as the necessary condition.
Exit Risks — Book-Value Decline, Capital-Gains Tax, Liquidity
The biggest issue with this structure is at exit. First, as depreciation progresses, the building’s book value drops, and at sale, that drop is added to the capital gain and taxed. In the prior estimate, RC and steel-frame buildings saw book values fall ¥3.99M and ¥5.51M respectively over 5 years, producing roughly ¥810k and ¥1.12M in long-term capital-gains tax at 20.315%. The deferral gained through depreciation partially returns at exit in this form. The structure is “deferral + rate spread” — not exemption.
Second, there is the holding-period wall. Sales within 5 years are treated as short-term capital gains (39.63%), and the rate spread narrows, so exit should be designed for periods longer than 5 years. Third, liquidity risk is large. Buyers for resort hotel condos are limited, and if market conditions reverse, exit can take time. Niseko has seen reported defaults on high-end resort properties in the past, and with income yields stuck at a real 1–3%, designs that lean heavily on capital gains tend to expose fragility during price-declining exit windows.
Fourth, there are external factors: currency, interest rates, and tourism demand. Niseko’s price formation rests on inbound UHNW demand; a yen rebound or overseas slowdown affects both operating distributions and sale prices. Areas can also see supply-side variation pressuring operating distributions — for example, Ishigaki recently saw ADR soften to YoY -22.0% on supply growth. The asymmetry between recent supply growth in Miyako and Yaeyama branded resort condos and the yields they produce is a notable example. These factors must be priced in upfront as conditions that sit on the other side of the investment opportunity.
Conclusion — The Conditions for Real IRR Read on a Tax-Inclusive Basis
The appeal of hotel condominiums for UHNW investors lies not in operating yield alone, but in real IRR that bundles “building ratio above 70% × depreciation-driven tax deferral × tax-rate arbitrage shifting the 55% bracket into the 20.315% bracket.” This angle, which simply does not exist for memberships or branded residences, provides retail UHNW investors with an opportunity to lift operating distributions by roughly one percentage point on a tax-inclusive basis.
Yet the conditions for it to work are demanding. The availability of loss offsetting (miscellaneous-income classification risk), book-value decline and capital-gains tax at exit, the 5-year-plus holding period, and the liquidity and demand-volatility risks specific to resorts — only when all of these are met does the thin surface yield translate into real IRR. The ADR/OCC dynamics across Okinawa, Niseko, and Karuizawa provide the foundation, but the ultimate investment outcome hinges on the precision of tax design and exit strategy. This article is a general structural analysis and is not intended as an endorsement of any specific product or location.
⚠ Note on Estimates: The depreciation amounts, tax-deferral effects, real IRR, and operating yields in this article are all simplified estimates based on certain assumptions. Actual investment decisions require detailed feasibility studies and individual consultation with tax advisors. ADRs reflect prices advertised on OTAs at the time of research and will change going forward.
References & Sources
■ Data Sources
Built by combining municipality-level ADR based on OTA-advertised prices (nationwide, approximately 18,000 properties, as of April 2026), estimated occupancy rates, monthly operating disclosures from listed hotel REITs (Invincible Investment Corporation, Japan Hotel REIT Investment Corporation), the National Tax Agency’s Tax Answer (capital gains), the e-Stat lodging-fee CPI, and MLIT Official Land Prices (Kutchan Town, 2025).
■ Assumptions
The depreciation effect is illustrated for a property priced at ¥50M with 75% building allocation; operating distributions are approximated as ADR × operating days × 35% operator net-of-fee share (an assumed owner share after operator management fees), and operating yield is calculated against ¥80M acquisition (sensitivity case). Tax-rate arbitrage is shown with the spread between the top 55% bracket and long-term capital gains at 20.315% (~35pt) as the ceiling. Three scenarios — bear, base, bull.
■ Limitations and Caveats
Advertised ADR tends to run +25–30% above transacted prices on average, and the actual operating distribution amount varies with contract terms. Depreciation-driven tax deferral is a deferral of tax, not an exemption, and the book-value decline is taxed as a capital gain at exit. Depending on the operating arrangement, there is risk of classification as miscellaneous or business income, and liquidity constraints specific to strata-titled ownership also remain. This article is an estimate of a general structure, not individual investment or tax advice.
■ Market Data
- MetroEngines Research & Consulting — OTA-advertised price data (municipality-level ADR, N = approximately 18,000 properties nationwide), estimated occupancy rates (OCC)
■ REIT Monthly Data
- Invincible Investment Corporation “Monthly Operating Status, May 2026” (101 domestic hotels)
- Japan Hotel REIT Investment Corporation “Monthly Operating Results, April 2026”
■ Tax & Public Data
- National Tax Agency “No. 3208 Calculation of Long-Term Capital Gains Tax”
- National Tax Agency “No. 3202 How to Calculate Capital Gains (Separate Taxation)”
- e-Stat “Consumer Price Index (Lodging Fees)” (May 2026 = 172.3)
- MLIT “Official Land Prices” (Kutchan Town, 2025)
■ Reference Articles