

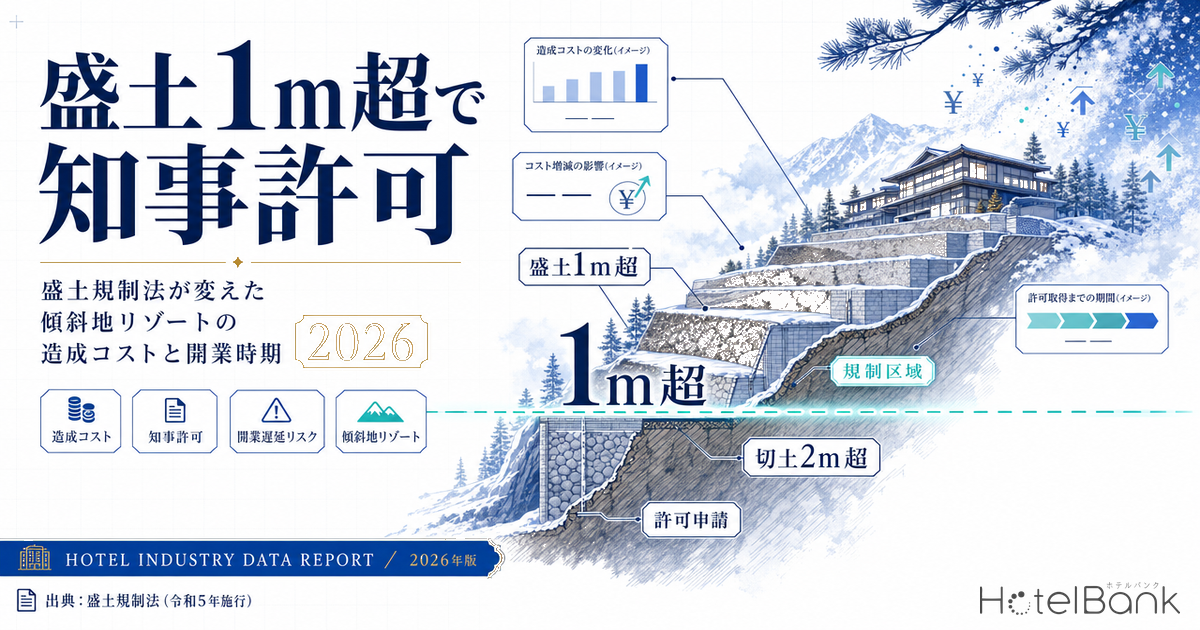
On 26 May 2025, the two-year transitional period under Japan’s Fill Regulation Act (the Act on Regulation of Residential Land Development, Specified Embankments and Other Works) came to an end. From that date, in most of the country, the act of moving earth itself became subject to a permit from the prefectural governor. According to Ministry of Land, Infrastructure, Transport and Tourism (MLIT) tallies, regulated zones designated as of 1 June 2025 — immediately after the transitional period ended — totalled 27,034,076 hectares, or 71.5% of Japan’s land area (approximately 378,000 square kilometres); by 1 April 2026 that had expanded to 30,900,126 hectares (81.8%). In the context of hotel development, this change bears most heavily not on flat land but on sloping sites. This article overlays MetroEngines Research’s property master with terrain classification data from MLIT’s Real Estate Information Library to quantify what kind of terrain 2,673 properties across 13 major resort areas actually sit on, and then models how earthwork costs and the permitting process affect development returns and schedules.
Metric Definitions Used in This Article
- ADR (average daily rate) = an estimated settled rate (tax-excluded equivalent) calculated by applying a segment-specific adjustment factor to the lowest published plan level each property lists on OTAs (double occupancy, per-room rate, tax-included). Cross-checked against property-level disclosures by listed hotel REITs (91 properties, most recent three months), the median error is approximately 7%. These are estimates and differ from each property’s actual transaction prices and accounting figures. Area-level ADR is the median across the properties covered (the level of a typical property in that area).
- Terrain classification = the 250-metre-mesh terrain classification published by MLIT’s Real Estate Information Library. This article groups it into three categories: “mountain / hill / volcanic terrain” (mountains, mountain foot slopes, hills, volcanoes, volcanic foot slopes, volcanic hills), “plateau / terrace / alluvial fan terrain” (gravelly plateaus, loam plateaus, alluvial fans, sloping valley-bottom lowlands), and “lowland / reclaimed terrain” (deltas, coastal lowlands, back marshes, natural levees, sandbars, reclaimed land and similar).
- Data sources: properties, room counts and ADR from MetroEngines Research; terrain classification, large-scale fill sites, sediment-disaster hazard zones and city planning areas from MLIT’s Real Estate Information Library.
- — 81.8% of Japan’s land area (30,900,126 hectares as of 1 April 2026) now falls inside a regulated zone under the Fill Regulation Act. Regardless of whether a site is inside or outside a city planning area, the act of moving earth itself now requires a permit.
- — 65.7% of the 2,673 properties across 13 resort areas (1,755 properties) sit on mountain, hill or volcanic terrain, and 22.0% (588 properties) are located inside sediment-disaster hazard zones.
- — Earthwork-related costs on steep sites run about 10 times those on flat land (¥7.70 million → ¥78.70 million), but they are a small share of total investment, so the difference in GOP yield is only 0.4 percentage points.
- — The median estimated settled ADR for mountain-terrain locations is ¥22,100 (N=224 properties), about 9.9% above plateau terrain — worth 0.49 points, which offsets the 0.4-point cost disadvantage.
- — Time is what matters. A two-year slip in opening also costs 0.4 points through construction cost inflation — the same magnitude as the slope penalty. Kutchan and Niseko are still at the preliminary survey stage; Okinawa Prefecture is scheduled to begin enforcement on 1 October 2026.
Executive Summary — 81.8% of Japan Is Now a Regulated Zone, and 65.7% of 13 Resort Areas Sits on Mountain Terrain
Start with the conclusions. First, regulated zones under the Fill Regulation Act are designated regardless of whether the land lies inside or outside a city planning area. Even on a mountain resort site with no zoning designation and no floor-area ratio, a permit from the governor is required if fill work creates a cliff more than one metre high, or if the fill or cut area exceeds 500 square metres. Second, overlaying terrain classification onto 2,673 properties and 46,684 rooms across 13 major resort areas shows that 1,755 properties (65.7%) sit on mountain, hill or volcanic terrain. Adding plateau, terrace and alluvial fan terrain brings the total to 94.4%. Third, the earthwork cost differential itself moves yield by only about 0.4 percentage points. That is because the estimated settled ADR at sloping locations runs roughly 9.9% above plateau terrain, and this rate premium very nearly cancels out the cost penalty. What actually bites is not cost but the additional steps the permitting process inserts into the schedule, and the timing of zone designation.
Why “Fill” Matters — A Third Regulatory Axis, Neither Zoning Nor Development Permits
Discussions of location regulation in hotel development have historically turned on two axes. The first is zoning and floor-area ratio under the City Planning Act, which determines what and how much can be built on a given site. The second is the development permit under Article 29 of the City Planning Act and farmland conversion under the Agricultural Land Act, which determines whether development work can begin in a given zone on a given land category. The Fill Regulation Act covered here is a third axis, distinct from both. What is regulated is neither the building nor the land category, but the act of moving earth itself.
The decisive difference lies in scope. Zoning exists only inside city planning areas. Development permit thresholds also vary widely by zone: outside city planning areas and quasi-city planning areas, a permit is required only for works of one hectare (10,000 square metres) or more. Regulated zones under the Fill Regulation Act, by contrast, are designated as areas where there is a risk of disaster, irrespective of whether the land is residential, agricultural or forest. Whether the site is inside or outside a city planning area is irrelevant.
One practical point is worth clarifying here. The Fill Regulation Act provides that where a development permit under Article 29 of the City Planning Act has been obtained, the permit or notification under the Fill Regulation Act is deemed to have been obtained (Articles 15, 27 and 34). In other words, if you hold a development permit, you do not need to obtain a Fill Regulation Act permit on top of it. But this applies only to works that fall within the scope of the development permit. In the following three cases, a standalone Fill Regulation Act permit is required even though the work never enters the development permit net.
First, earthwork below the development permit size threshold. Grading a 5,000-square-metre site outside a city planning area requires no development permit because it is under one hectare — but if the fill or cut area exceeds 500 square metres, a Fill Regulation Act permit is required. Second, earthwork not intended for building construction. Because development work is defined as “a change to the division, shape or quality of land for the purpose of constructing buildings,” parking lot preparation, material storage yards and temporary spoil stockpiling fall outside the development permit regime — yet they are subject to the Fill Regulation Act once they meet the size thresholds. Third, even where the deemed-permit provision applies, procedures such as notifying nearby residents (briefing sessions and the like), interim inspections during construction, completion inspections and periodic reporting still arise under the Fill Regulation Act. From a schedule management perspective, the deemed-permit provision does not make the administrative workload disappear.
Broken down, residential land development work regulated zones account for 10,979,573 hectares and specified embankment regulated zones for 16,054,504 hectares. The former covers urban areas, settlements and their surroundings; the latter covers areas that are distant from built-up areas but could cause damage given their topography — and most resort land falls into the latter. There are 129 designating bodies (47 prefectures, 20 designated cities, 62 core cities), of which 111 had completed designation as of 1 June 2025; among prefectures, 38 of 47 had finished. Designation has continued since, and as of 1 April 2026 the count stood at 127 bodies (46 prefectures, 20 designated cities, 61 core cities).
| Work | Residential land development work regulated zone | Specified embankment regulated zone |
|---|---|---|
| Fill creating a cliff | Over 1m high | Over 2m high |
| Cut creating a cliff | Over 2m high | Over 5m high |
| Fill and cut creating a cliff (combined) | Over 2m high | Over 5m high |
| Fill not creating a cliff | Over 2m high | Over 5m high |
| Fill or cut area | Over 500㎡ | Over 3,000㎡ |
| Stockpiling of earth and rock (height + area) | Over 2m high and over 300㎡ | Over 5m high and over 1,500㎡ |
| Stockpiling of earth and rock (area only) | Over 500㎡ | Over 3,000㎡ |
Set against the realities of resort development, the numbers in Table 1 are strikingly small. Building even a single 30-room villa building will easily push fill and cut area past 500 square metres once a level platform is created. On a slope, it is harder to avoid creating a one-metre cliff than to create one. In practice, then, building a hotel on sloping land inside a regulated zone should be assumed to be a permit case as a matter of course.
The Terrain Reality Across 13 Resort Areas — 65.7% of 2,673 Properties Sit on Mountain, Hill or Volcanic Terrain
So what terrain do Japan’s resort lodging properties actually stand on? We extracted lodging properties in 13 major resort areas (within a 3-kilometre radius of each area’s centre coordinates) from MetroEngines Research’s property master, and overlaid MLIT Real Estate Information Library’s 250-metre-mesh terrain classification onto each property’s coordinates. The sample is N=2,673 properties and 46,684 rooms.
The result was unambiguous. Mountain, hill and volcanic terrain accounts for 1,755 properties, or 65.7%; plateau, terrace and alluvial fan terrain for 769; and lowland and reclaimed terrain for just 149. Together the top two categories put 94.4% of properties on slope or terrace ground to some degree. On a room-count basis, mountain and hill terrain still accounts for 26,959 rooms, or 57.7%.
The spread between areas is wide. In Kusatsu Onsen and Zao Onsen, 100% of properties within the radius sit on volcanic foot slopes, followed by Izu Kogen at 99.7% and Kutchan / Niseko at 96.5%. At the other end, Kinugawa Onsen is at 0%, Gero Onsen at 7.2% and Karuizawa at 8.7%. That does not mean these areas are flat, however: they sit on loam or gravelly plateaus, and while the plateau surface itself is gentle, terrace scarps run along its edges. In practical earthwork terms, whether a project can use the flat plateau surface or has to engage the terrace scarp changes the scope of work substantially.
| Area | Properties | Rooms | Mountain / hill share | In sediment-disaster hazard zone | Large-scale fill sites | Outside city planning area |
|---|---|---|---|---|---|---|
| Kusatsu Onsen (Gunma) | 211 | 3,831 | 100.0% | 5.7% | 2 | 1.4% |
| Zao Onsen (Yamagata) | 97 | 1,685 | 100.0% | 88.7% | 1 | 43.3% |
| Izu Kogen (Shizuoka) | 374 | 3,202 | 99.7% | 5.3% | 0 | 0.0% |
| Kutchan / Niseko (Hokkaido) | 433 | 5,331 | 96.5% | 2.5% | 44 | 100.0% |
| Hakone (Kanagawa) | 104 | 2,046 | 95.2% | 37.5% | 15 | 0.0% |
| Beppu (Oita) | 185 | 6,366 | 83.2% | 5.4% | 4 | 0.0% |
| Atami (Shizuoka) | 221 | 5,930 | 76.5% | 35.7% | 14 | 0.0% |
| Yufuin (Oita) | 215 | 1,793 | 69.8% | 57.7% | 0 | 0.0% |
| Echigo-Yuzawa (Niigata) | 113 | 2,699 | 15.9% | 59.3% | 11 | 0.0% |
| Hakuba (Nagano) | 486 | 5,263 | 10.7% | 13.6% | 1 | 0.0% |
| Karuizawa (Nagano) | 103 | 2,846 | 8.7% | 3.9% | 8 | 0.0% |
| Gero Onsen (Gifu) | 69 | 2,314 | 7.2% | 65.2% | 1 | 13.0% |
| Kinugawa Onsen (Tochigi) | 62 | 3,378 | 0.0% | 40.3% | 0 | 0.0% |
| 13 areas total | 2,673 | 46,684 | 65.7% | 22.0% | 101 sites | 18.2% |
We also looked at overlap with disaster-related zones. Of the 2,673 properties across the 13 areas, 588 (22.0%) sit inside a sediment-disaster hazard zone, and 29 of those fall within a special sediment-disaster hazard zone. By area, Zao Onsen is highest at 88.7%, followed by Gero Onsen at 65.2% and Echigo-Yuzawa at 59.3%. These figures reflect the historical fact that hot spring towns formed along valley floors and mountain skirts; they do not imply that existing properties are inappropriately sited. That said, where new earthwork accompanies a rebuild or extension inside these zones, Fill Regulation Act permit criteria are set stringently according to the terrain and geology. For investors, this makes hazard exposure a quantifiable axis in its own right, to be weighed alongside rate and capex when a site is assessed.
Case Study: Kutchan / Niseko — 5,331 Rooms Outside the City Planning Area, and 44 Large-Scale Fill Sites
Among the 13 areas, the most distinctive regulatory structure is found in Kutchan and Niseko. Within a 3-kilometre radius centred on the Hirafu district, 433 properties and 5,331 rooms are clustered — and when cross-referenced against MLIT’s city planning area data, all 433 properties turned out to be outside any city planning area. Kutchan does have a city planning area, but it covers the town’s central built-up district and does not extend to the condominium cluster at the base of the ski slopes. Queries against the zoning dataset return no applicable designation.
The implications of this structure are significant. Outside a city planning area, a development permit is required only for works of one hectare or more. A plan to build villas or condominiums on a typical Hirafu site of around 5,000 square metres does not reach that size threshold. In other words, earthwork at this scale has historically proceeded without any City Planning Act permit review. Once the Fill Regulation Act applies, administrative permit review attaches for the first time — through the thresholds of fill or cut area over 500 square metres, or fill creating a cliff over one metre high. “A regulatory gap being closed” is the more accurate description.
The second point worth noting is the 44 large-scale fill sites identified within the radius. This is a distribution map of land historically created by filling valleys and slopes, and 42 of the 44 are valley-fill type. According to Kutchan’s published materials, 12 large-scale fill sites within the town were identified in the national survey of fiscal 2019, and a further 26 in the town’s own survey in fiscal 2020. Where an existing fill site is being redeveloped, characterising the condition of the existing fill becomes a prerequisite design task. As Kutchan explicitly states, these maps do not identify hazardous locations, and the areas shown are not necessarily dangerous.
And this region has not yet been designated as a regulated zone. Enforcement across Hokkaido began on 1 April 2025 with 176 prefecturally administered municipalities in scope, but Kutchan and Niseko remain at the preliminary survey stage. The same situation applies in Okinawa Prefecture, which has announced that on 1 October 2026 it will designate almost the entire prefecture apart from Naha City as a regulated zone and begin enforcement. Japan’s two most development-pressured resort markets are both sitting immediately ahead of regulated zone designation. On Niseko’s supply structure itself, Niseko’s Top Tier: Just 2 Hotels, 75 Rooms — Where Fairmont’s 165 Fit examines the gaps by price band in detail.
Earthwork Cost and Permitting Time — Slope Moves Yield by 0.4 Points
From here we model how slope affects project economics. Assuming a resort lodging property with a 5,000-square-metre site, 30 guest rooms and 1,500 square metres of gross floor area, we compared three scenarios that differ only in terrain gradient.
■ Modelling assumptions: the site is taken to be near-square (roughly 71 metres per side), with the platform levelled to a single elevation across the whole site. Cut and fill volumes are assumed to balance on site, and the cut volume for a site with gradient s levelled to its mean height is approximated as “site area × gradient × side length ÷ 8.” Unit costs are ¥1,500 per cubic metre for excavation, ¥3,000 per cubic metre for spreading, compaction and quality control of fill, and ¥40,000 per square metre of wall face for reinforced concrete retaining walls, with 15% added for drainage works and slope protection. Building construction cost is ¥591,279 per square metre (2024 national average for lodging-use buildings, ¥1.955 million per tsubo), and land is set at ¥15,000 per square metre. Revenue is calculated as 30 rooms × ADR ¥22,100 × 65% occupancy (a full-year modelling assumption — an assumed figure referencing the level at resort-located properties from July 2025 to June 2026, not an actual result) × 365 days for room revenue, with ancillary revenue added at 20% and a GOP margin of 30%. All figures are simplified estimates; an actual investment decision requires a detailed feasibility study.
| Item | A. Flat (gradient ≤2%) | B. Gentle slope (10% gradient) | C. Steep slope (20% gradient) |
|---|---|---|---|
| Cut / fill volume (balanced on site) | approx. 900㎥ | approx. 4,400㎥ | approx. 8,800㎥ |
| Retaining wall face area | — | approx. 250㎡ | approx. 500㎡ |
| Earthwork construction cost | approx. ¥4.70m | approx. ¥34.40m | approx. ¥68.70m |
| Fill Regulation Act category (inside residential land zone) | Permit if area over 500㎡ | Permit: cliff over 1m + area | Permit: cliff over 1m + area |
| Permit compliance cost (survey, design, application, inspections) | approx. ¥3.00m | approx. ¥6.00m | approx. ¥10.00m |
| Total earthwork-related | approx. ¥7.70m | approx. ¥40.40m | approx. ¥78.70m |
| Building construction cost (1,500㎡ GFA) | ¥887m | ¥887m | ¥887m |
| Land (5,000㎡) | ¥75m | ¥75m | ¥75m |
| Total investment | ¥970m | ¥1,002m | ¥1,041m |
| Total revenue (incl. ancillary) | ¥189m | ¥189m | ¥189m |
| GOP (30% margin) | ¥56.63m | ¥56.63m | ¥56.63m |
| GOP yield | 5.8% | 5.7% | 5.4% |
| Total investment after construction-period inflation | ¥1,166m | ¥1,206m | ¥1,253m |
| GOP yield, same basis | 4.9% | 4.7% | 4.5% |
The result runs somewhat counter to intuition. The difference in total investment between flat land and a steep slope is about ¥71 million, and the difference in GOP yield is only 0.4 percentage points. Earthwork costs balloon to roughly 10 times the flat-land figure on steep terrain, but because they are a small share of total investment, the effect on yield is limited.
More importantly, the factor that offsets those 0.4 points sits on the demand side. Aggregating property-level estimated settled ADR across the 13 areas by terrain category gives a median of ¥22,100 for mountain, hill and volcanic terrain (N=224 properties), ¥20,100 for plateau, terrace and alluvial fan terrain (N=130 properties), and ¥19,700 for lowland and reclaimed terrain (N=39 properties). Mountain terrain sits about 9.9% above plateau terrain. On the same 30 rooms at 65% occupancy (a full-year modelling assumption), that rate gap is worth ¥14.16 million a year in room revenue and ¥5.10 million in GOP — 0.49 points against total investment of ¥1,041 million. Sloping sites are disadvantaged on cost and advantaged on rate, and the two very nearly cancel out.
Movement in construction costs themselves swings project economics by more than the earthwork debate does. Planned construction cost per square metre for lodging-use buildings rose 2.8-fold, from ¥211,500/㎡ in 2011 to ¥591,300/㎡ in 2024. In the three years from 2021 to 2024 alone it climbed 56.6%, from ¥377,500/㎡ to ¥591,300/㎡. The 2024 level converts to ¥1.955 million per tsubo — meaning the entire earthwork cost on a sloping site (about ¥68.70 million in the steep-slope scenario) is smaller than the increase from a 10% overrun on the building cost of a 1,500-square-metre property (about ¥88.70 million). There is little point in debating the viability of sloping-site development in isolation from construction cost movements overall. On how far elevated construction costs are pushing back supply plans themselves, Construction +41% & Labor Crunch Erase Japan’s 2027-2029 Hotel Supply traces the effect through the 2027-2029 opening map.
So what does matter? Time. A Fill Regulation Act permit requires, on top of a compliance review against technical standards calibrated to terrain and geology, unanimous consent from all landowners and other rights holders (Articles 12 and 30) and notification of residents in the surrounding area (briefing sessions and the like, Articles 11 and 29). After construction begins, periodic reporting on construction status (Articles 19 and 38), interim inspections during construction (Articles 18 and 37) and a completion inspection on finishing the work (Articles 17 and 36) all apply. On sloping sites, the burden of borehole investigation and stability analysis is heavier than on flat land, and retaining wall structural calculations are added on top. These may cost only several million yen, but they sit on the critical path. The more a project wants to break ground immediately after zone designation, the more its success turns on whether it has secured enough lead time for advance coordination.
This 0.4-point difference is small compared with the construction cost inflation triggered when an opening date moves. Holding the article’s modelling assumptions constant and varying only the opening year and the swing in rate and occupancy gives the following.
| Scenario | Opening | Construction cost inflation applied | Total investment | GOP yield | vs. pessimistic |
|---|---|---|---|---|---|
| Optimistic | 2027 opening | 2 years (cumulative +11.2%) | ¥1,149m | 4.9% | +0.4pt |
| Base | 2028 opening | 3 years (cumulative +16.8%) | ¥1,203m | 4.7% | +0.2pt |
| Pessimistic | 2029 opening | 4 years (cumulative +22.0%) | ¥1,253m | 4.5% | +0.0pt |
| Occupancy \ ADR | ¥19,900 | ¥21,000 | ¥22,100 | ¥23,200 | ¥24,300 |
|---|---|---|---|---|---|
| 55% | 4.1% | 4.4% | 4.6% | 4.8% | 5.1% |
| 60% | 4.5% | 4.8% | 5.0% | 5.3% | 5.5% |
| 65% (assumption) | 4.9% | 5.2% | 5.4% | 5.7% | 6.0% |
| 70% | 5.3% | 5.6% | 5.9% | 6.1% | 6.4% |
| 75% | 5.7% | 6.0% | 6.3% | 6.6% | 6.9% |
Simply moving an opening from 2027 to 2029 takes GOP yield from 4.9% down to 4.5% — 0.4 points, the same magnitude as the slope penalty itself. The variable to manage in sloping-site development is not gradient, but the time required for zone designation and advance coordination.
Implications for the Supply Pipeline — 53.5% of New Openings Are Small Properties That Never Enter the Development Permit Net
The regulatory change bites most broadly not on large resort hotels. Within MetroEngines Research’s coverage, 1,739 lodging properties were confirmed as new openings in 2025 (on an OTA-listing-confirmed basis). Of these, 745 vacation rental villas, 113 cottages, 20 pensions, 22 glamping facilities, 14 lodges and 16 campgrounds total 930 properties, or 53.5% of the whole. This mix has held at around half for four consecutive years: 49.8% in 2022, 54.1% in 2023 and 55.6% in 2024.
Vacation rentals and glamping facilities typically have small gross floor area per building, and their sites are almost always under one hectare. Outside a city planning area they fall outside the development permit regime, as they do inside an urbanisation promotion area if under 1,000 square metres. Yet the work of creating a level platform on a slope and setting foundations easily crosses the threshold of more than 500 square metres of fill or cut area. The category that has driven Japan’s lodging supply in volume terms for the past four years has moved, wholesale, into the scope of the new permit regime — that is the picture these statistics reveal.
It is worth looking at this from the construction planning side too. Aggregating planned and under-construction hotel projects from MLIT’s “Statistical Survey on Building Construction Dynamics” gives, by scheduled completion year, 27 projects in 2026, 22 in 2027, 9 in 2028, 1 in 2029 and 1 in 2031. Note, however, that this is on a building confirmation application basis, and confirmation applications are typically filed one to two years before opening, so counts from 2028 onward are expected to rise as further applications are added. Treat them as a lower bound on the currently confirmed pipeline. What is captured here is mainly large-scale projects; earthwork at vacation rental scale is not picked up. These figures need to be read alongside the opening statistics above.
Investment Summary — Timing of Zone Designation Is the Biggest Variable
Cost Matters Less Than Expected
Earthwork-related costs on a steep site run about 10 times those on flat land, but they are a small share of total investment, so the effect on GOP yield is 0.4 percentage points. At the same time, estimated settled ADR at mountain-terrain locations runs about 9.9% above plateau terrain, returning 0.49 points. Cost and rate very nearly cancel out.
Schedule and Uncertainty Are What Bite
Unanimous landowner consent, notification of surrounding residents (briefing sessions and the like), interim and completion inspections and periodic reporting all get added to the schedule. On sloping sites the geological investigation and stability analysis burden is heavier as well. Reading the time required for advance coordination, rather than the cost, is what drives the investment decision.
In Undesignated Areas, It Is a Race Against the Clock
Kutchan and Niseko are at the preliminary survey stage; Okinawa Prefecture is scheduled to begin enforcement on 1 October 2026. Japan’s two most development-pressured markets are both immediately ahead of designation. Note that the transitional notification carries a statutory deadline of 21 days from the designation date.
| Case | Total revenue | GOP | GOP yield | vs. base |
|---|---|---|---|---|
| Base case (ADR ¥22,100, occupancy 65% = full-year modelling assumption) | ¥189m | ¥56.63m | 5.4% | — |
| ADR −10% | ¥170m | ¥50.96m | 4.9% | −0.5pt |
| Occupancy −5pt (60%) | ¥174m | ¥52.27m | 5.0% | −0.4pt |
| Construction cost +10% | ¥189m | ¥56.63m | 5.0% | −0.4pt |
| ADR −10% and occupancy −5pt | ¥157m | ¥47.06m | 4.5% | −0.9pt |
| Category | Description | Impact | Direction of response |
|---|---|---|---|
| Regulatory | Zone designation timing differs by municipality, and procedures change before and after designation. Thresholds for specified embankment regulated zones can be lowered by ordinance (Article 32 of the Act) | High | Check the municipality’s designation status and any local ordinance before acquiring land |
| Schedule | Unanimous landowner consent, notification of surrounding residents, interim and completion inspections and periodic reporting are added to the schedule | High | Build the consent-gathering and briefing session period into the schedule before design work begins |
| Construction market | Unit construction cost for lodging-use buildings rose 56.6% from 2021 to 2024. Construction cost swings are larger than earthwork cost swings | High | Budget with construction-period inflation built in, and sign the construction contract early |
| Ground conditions | Redeveloping a large-scale fill site adds characterisation of the existing fill as a prerequisite design task | Medium | Borehole investigation and review of existing records at the due diligence stage |
| Demand | Sloping locations are advantaged on rate, but occupancy is more exposed to seasonality | Medium | Product design for off-peak demand and a business plan premised on year-round operation |
| Earthwork cost | Above a 20% gradient, retaining wall scale increases and earthwork cost reaches roughly 10 times the flat-land level | Low | The share of total investment is small. Within the range absorbable through platform layout design |
Building a resort on sloping land has long left a wide field in which zoning and development permit size thresholds could be slipped past. Nationwide enforcement of the Fill Regulation Act has closed that field. As this article’s modelling shows, however, the direct economic burden of that closure amounts to roughly 0.4 percentage points of yield. What carries more weight is that the quality of earthwork — previously left to operators’ own judgement — is now verified externally through permit criteria and inspections. For existing properties, knowing which terrain category their site falls into and which regulated zone it sits in is the starting point for any extension or rebuild study. For those considering development, land acquisition due diligence now needs one more line item: the permit to move earth.
Related Reading
- Construction +41% & Labor Crunch Erase Japan’s 2027-2029 Hotel Supply
- Niseko’s Top Tier: Just 2 Hotels, 75 Rooms — Where Fairmont’s 165 Fit
- Japan 2026: 1,242 Openings, 33,749 Rooms — 47% Villas, 42% Business
- Vacation Rentals Take 45% of Japan’s 2026 New Hotel Openings (247 Villas)
- Hotel Builder Ranking 2026: Daiwa House 99 Projects, 55% Undecided
- Leasehold Hotel Development: 1.38x Land Price Reach Across 9 Markets
References and Sources
■ Data sources
Property counts, room counts and estimated settled ADR are from MetroEngines Research & Consulting’s property master and aggregation of OTA published prices (within a 3km radius of the centre coordinates of 13 resort areas, N=2,673 properties and 46,684 rooms; ADR is the median of property-level averages from July 2025 to June 2026, aggregated by terrain category). The 250m-mesh terrain classification, large-scale fill sites, sediment-disaster hazard zones and city planning areas are from MLIT’s Real Estate Information Library. Regulated zone designation status is from MLIT’s published materials (as of 1 June 2025 and 1 April 2026). Planned construction cost per square metre of building is from MLIT’s “Statistical Survey on Building Construction Starts” (lodging-use buildings, national). New opening counts are our own aggregation on an OTA-listing-confirmed basis.
■ Modelling assumptions
The development scenarios assume a resort lodging property with a 5,000-square-metre site, 30 guest rooms and 1,500 square metres of gross floor area, compared while varying only terrain gradient. Revenue is 30 rooms × ADR ¥22,100 × 65% occupancy (a full-year modelling assumption) × 365 days for room revenue, with ancillary revenue added at 20% and a GOP margin of 30%. Building construction cost is ¥591,279 per square metre and land ¥15,000 per square metre. Cut volume is approximated as “site area × gradient × side length ÷ 8,” with unit costs of ¥1,500 per cubic metre for excavation, ¥3,000 per cubic metre for fill and ¥40,000 per square metre for reinforced concrete retaining walls, plus 15% for drainage and slope protection. Construction cost inflation of +5.6% for 2025, +5.3% for 2026, +5.0% for 2027 and +4.5% for 2028 is compounded over the number of years to opening and applied only to building construction cost and earthwork-related cost (land is held flat). The opening timing scenarios and the two-axis sensitivity grid are pure arithmetic within these assumptions; no new assumptions are introduced.
■ Limitations and caveats
Estimated settled ADR is an estimate derived by applying segment-specific adjustment factors to OTA published prices, and differs from each property’s actual transaction prices and accounting figures (cross-checked against property-level disclosures by listed hotel REITs, the median error is approximately 7%). Terrain classification is on a 250-metre-mesh basis and therefore does not match the actual gradient of an individual site. Earthwork unit costs are modelled values based on typical private-sector earthwork market ranges and vary widely with geology, haulage conditions and spoil disposal costs. Permit compliance costs are an approximation covering survey, design, application and inspection response, and do not reflect municipal practice or additional standards imposed by ordinance (Article 32 of the Act). Regulated zone designation status is point-in-time information; the timing and extent of designation in undesignated areas is not settled. New opening counts are on an OTA-listing-confirmed basis, so properties without listings are not captured and recent years will rise as further listings appear. All figures are simplified estimates; an actual investment decision requires individual detailed investigation.
■ Market data
- MetroEngines Research & Consulting — lodging property master (property locations, room counts), estimated settled ADR (N=393 properties), new opening data (OTA-listing-confirmed basis)
■ Legislation and regulatory framework
- MLIT, “About the Act on Regulation of Residential Land Development, Specified Embankments and Other Works (the Fill Regulation Act)”
- MLIT, “Structural Diagram of the Fill Regulation Act” (permit thresholds, Cabinet Order Articles 3, 4 and 28)
- MLIT, “Designation Status of Regulated Zones under the Act on Regulation of Residential Land Development and Specified Embankments (as of 1 June 2025)”
- MLIT, “Designation Status of Regulated Zones under the Act on Regulation of Residential Land Development and Specified Embankments (as of 1 April 2026)”
- MLIT, “Fill Regulation Act Information Portal”
■ Government statistics and geospatial data
- MLIT Real Estate Information Library — terrain classification (250m mesh), large-scale fill sites, sediment-disaster hazard zones, steep slope failure hazard zones, city planning areas, zoning
- e-Stat, “Statistical Survey on Building Construction Starts” (statistics ID: 0003114490 / lodging-use buildings, building count, floor area, planned construction cost)
■ Local government publications
- Hokkaido Government, “Publication of Regulated Zones under the Act on Regulation of Residential Land Development and Specified Embankments”
- Kutchan Town, “About the Large-Scale Fill Site Map”
- Niigata Prefecture, “Regulated Zones Designated on 18 July 2025”
- Okinawa Prefecture, “The Act on Regulation of Residential Land Development, Specified Embankments and Other Works (the Fill Regulation Act)”
- Shizuoka Prefecture, “Regulated Zones under the Fill Regulation Act”
- Chiba Prefecture, “The Act on Regulation of Residential Land Development and Specified Embankments (the Fill Regulation Act)”
■ Construction cost benchmarks
- MLIT Statistical Survey on Building Construction Starts (lodging-use buildings, 2024 national average, ¥1.955 million per tsubo)
- Assumed construction cost inflation: +5.6% in 2025, +5.3% in 2026, +5.0% in 2027, +4.5% from 2028 onward