

How much is a single hotel room worth? The question has two answers with entirely different characters. One is the acquisition price per room that a J-REIT actually paid for physical real estate. The other is the enterprise value the stock market assigns to a listed hotel operating company, divided by the number of rooms that company runs. The first is the price of land and a building; the second is the price of a business. Both use the same unit — one room — but they are measuring different things.
This article lines up, on a per-room basis, the acquisition prices of 300 domestic properties (52,347 rooms) held by seven J-REITs and the enterprise values of five hotel operating companies listed on the Tokyo Stock Exchange (based on the 2 September 2026 close). It then breaks the gap between the two down into three factors: (a) ownership versus management contract or lease, (b) land book value and unrealised gains, and (c) non-room revenue such as banquets, weddings and membership sales.
Metric Definitions Used in This Article
- Acquisition price per room (physical side) = the sum of property-level acquisition prices disclosed by each J-REIT ÷ the sum of rooms at those properties. Acquisition price is the amount at the time of purchase, not a current appraisal value or market value. The older the acquisition year, the more the figure reflects price levels of that era. Overseas properties are excluded.
- EV (enterprise value) = market capitalisation (2 September 2026 close × shares outstanding) + interest-bearing debt (borrowings and bonds) − cash and equivalents (cash and deposits + marketable securities in current assets). The most recent disclosed consolidated balance sheet is used for each company (reference dates differ by company and are stated in the table). Lease liabilities are excluded because disclosure categories are not consistent across companies.
- EV per room (equity side) = EV ÷ rooms operated. Rooms operated is built up from the property lists, annual securities reports and official websites disclosed by each company, and excludes rooms owned and operated by third parties under franchise (FC) agreements. Because disclosure definitions differ by company (treatment of directly operated, management-contract and FC properties, and of overseas assets), the room counts themselves cannot be used to rank the companies by business scale. In this article they serve only as the denominator for a per-room figure.
- Data sources: REIT ownership master (MetroEngines Research & Consulting), company IR disclosures, Tokyo Stock Exchange listed equity data
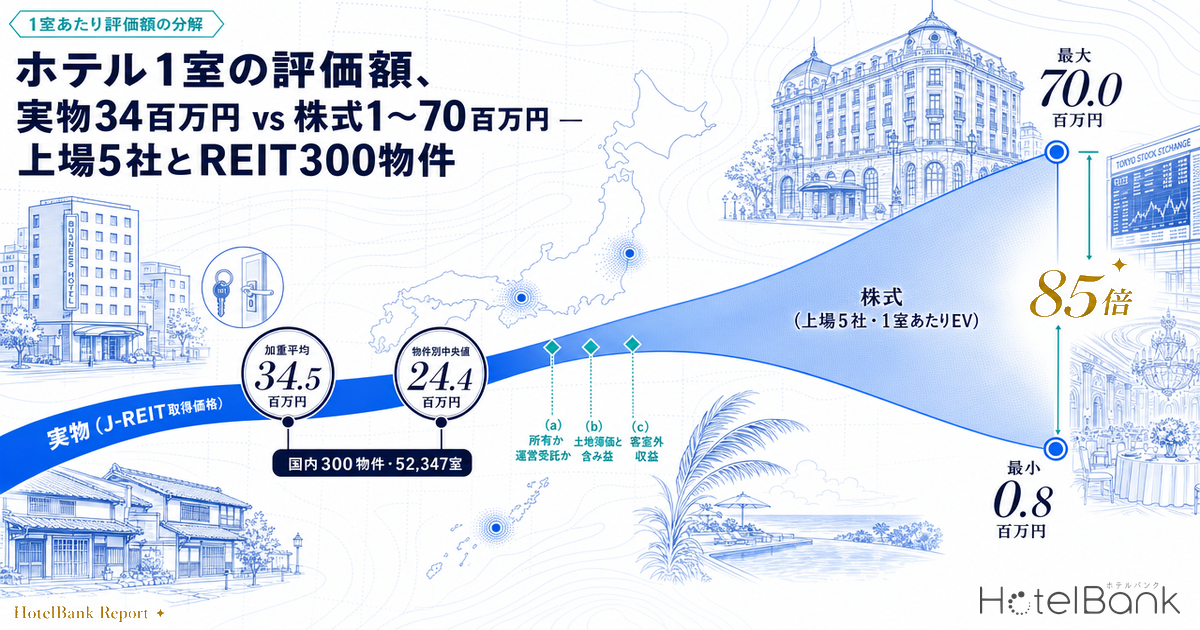
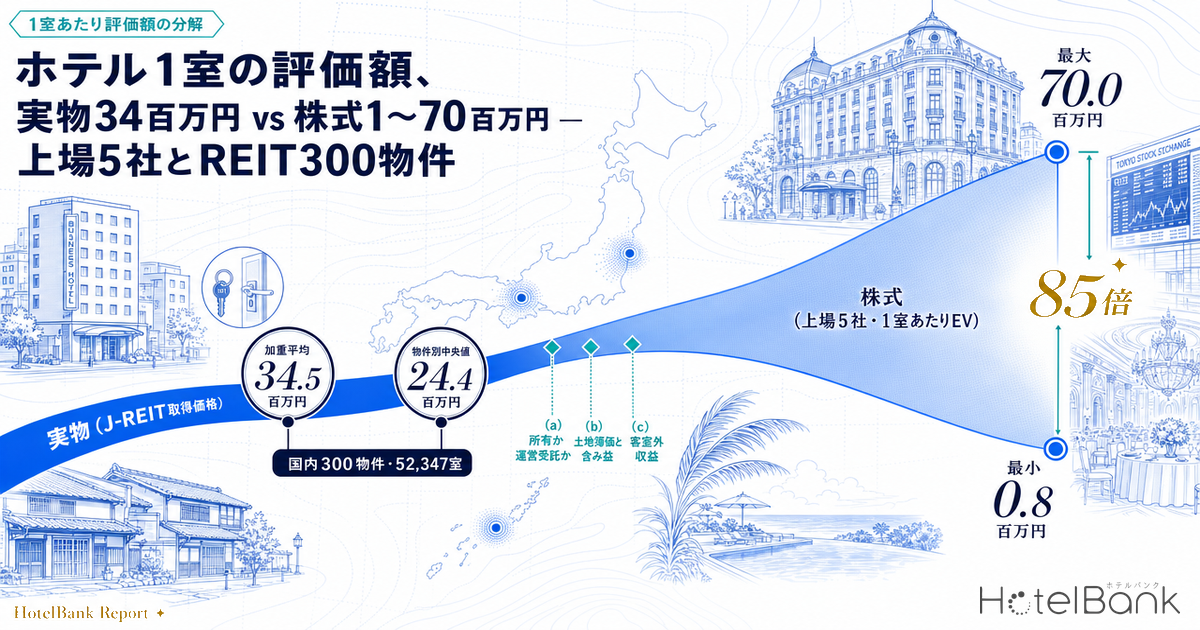
- — ¥34.5 million — the acquisition price per room that seven J-REITs actually paid for 300 domestic properties and 52,347 rooms. The median by property is ¥24.4 million.
- — ¥0.8–70.0 million — EV per room at five listed hotel operating companies (2 September 2026 close). An 85-fold spread on the same unit of one room.
- — ¥2 million book value — the carrying amount of the 11,000 m² of land Imperial Hotel holds in Uchisaiwaicho, Tokyo. A textbook case of an old acquisition left on the books at cost.
- — ¥264.4 billion — Resort Trust’s membership deposits and deferred revenue, equal to roughly 70% of its EV. Rooms are not the only thing being priced.
- — Three factors — the gap can be explained by (a) ownership versus management contract or lease, (b) land book value and unrealised gains, and (c) non-room revenue.
- — 2.6× — the range EV per room moves across when the share price is flexed ±30% and the room-count definition is varied. This is a metric to read as a band, not a point.
A physical room costs ¥34.5 million — what J-REITs actually paid for 300 domestic properties
Start with the physical side. Aggregating the domestic properties held by seven hotel-focused and diversified J-REITs gives 300 properties and 52,347 rooms, with total acquisition prices of ¥1,804.2 billion, or ¥34.5 million per room. The median per-room price by property is ¥24.4 million; the weighted average exceeds the median because high-priced assets such as large full-service hotels in central Tokyo carry heavy weight on a room-count basis.
Levels differ sharply by REIT, as the table below shows. A portfolio centred on luxury and upper-upscale assets and one centred on limited-service hotels can differ more than fourfold on the same unit of one room.
| REIT | Domestic properties | Rooms | Total acquisition price | Per room | Portfolio character |
|---|---|---|---|---|---|
| Mori Trust Reit (森トラストリート投資法人) | 6 | 1,937 | ¥142,217M | ¥73.4M | A small, select group of luxury to upscale assets |
| Kasumigaseki Hotel REIT (霞ヶ関ホテルリート投資法人) | 15 | 726 | ¥49,210M | ¥67.8M | Mainly newly built properties with multi-occupancy rooms (listed 2025) |
| Japan Hotel REIT (ジャパン・ホテル・リート投資法人) | 53 | 15,338 | ¥655,708M | ¥42.8M | Full-service and limited-service side by side |
| Invincible Investment (インヴィンシブル投資法人) | 110 | 19,270 | ¥603,134M | ¥31.3M | Limited-service core, diversified nationwide |
| Hoshino Resorts REIT (星野リゾート・リート投資法人) | 71 | 8,667 | ¥233,906M | ¥27.0M | Includes resorts and hot-spring ryokan |
| Nippon Hotel & Residential Investment (日本ホテル&レジデンシャル投資法人) | 16 | 1,991 | ¥48,083M | ¥24.2M | A mix of limited-service and resort assets |
| Ichigo Hotel REIT (いちごホテルリート投資法人) | 29 | 4,418 | ¥71,903M | ¥16.3M | Mainly limited-service hotels in regional cities |
| Seven REITs, total | 300 | 52,347 | ¥1,804,161M | ¥34.5M | — |
Note: the aggregation covers domestic properties held by seven hotel-focused and diversified REITs; overseas properties are excluded. Hoshino Resorts REIT includes resorts and hot-spring ryokan, giving it a different portfolio character from the other REITs, which are centred on urban hotels.
Sorted by vintage, the per-room price moves in cycles
Because acquisition price is the amount paid at the time, the level depends on when the asset was bought. Regrouped by acquisition year, properties bought in 2012 or earlier stand at a high ¥46.3 million per room — they include large central-Tokyo assets and purchases from around the bubble era. Acquisitions in 2013–15 fall to ¥20.4 million. Levels then climb back to ¥39.7 million for 2022–24, and the most recent 2025–26 acquisitions remain high at ¥37.4 million.
What this shows is that the per-room price of a physical asset is not set by hotel quality alone — it is strongly governed by the real estate market at the moment of purchase. For the same room, a property bought in 2014 and one bought in 2023 carry completely different amounts on the books. How acquisitions themselves have clustered by year is broken down on a quarterly basis in Hotel Capital Allocation 2026. This property of a price fixed at the moment of acquisition is the first entry point into the gap with the equity market’s valuation, which we turn to next. For the cost of building a room today, Hotel Construction Cost ¥20.67M per Room works back from 31 development plans and provides material for comparing acquisition prices with new-build costs.
Location sets the per-room price — mapping 300 held properties
Plotting per-room acquisition prices on a map brings out the structure: high-priced assets cluster in central Tokyo, Kyoto and the resorts of Okinawa, while limited-service hotels in regional cities form a lower band. Circle size indicates room count and colour indicates the per-room acquisition price level.
This distribution shows that the per-room price on the physical side is essentially the price of land and a building in a particular place. How far the per-room figure the equity market assigns to listed operators overlaps with this distribution — and where it departs from it — is the heart of the matter.
On the equity side, ¥0.8–70.0 million per room — breaking down the EV of five listed operators
Now the equity market. For five hotel operating companies listed on the Tokyo Stock Exchange, we take market capitalisation at the 2 September 2026 close, add interest-bearing debt, subtract cash and equivalents to arrive at enterprise value (EV), and divide by the number of rooms each company operates.
The results are in the table below: EV per room ranges from ¥0.8 million to ¥70.0 million — an 85-fold spread. Companies above the ¥34.5 million physical-asset level and companies at roughly one-fortieth of it sit in the same table. This is not a question of which price is correct. It is evidence that the equity market is pricing fundamentally different things at different companies.
| Company (by ticker) | Share price close 2 Sep 2026 | Market cap | Interest- bearing debt | Cash etc. | EV | Rooms operated | EV per room | ROE (actual) |
|---|---|---|---|---|---|---|---|---|
| Resort Trust (リゾートトラスト, 4681) BS date 30 Jun 2026 | ¥1,824 | 395,884 | 13,834 | 41,095 | 368,623 | 6,068 | 60.8 | 13.7% |
| Greens (グリーンズ, 6547) BS date 30 Jun 2026 | ¥2,115 | 29,353 | 11,714 | 11,559 | 29,508 | 16,942 | 1.7 | 43.8% |
| Imperial Hotel (帝国ホテル, 9708) BS date 30 Jun 2026 | ¥990 | 117,612 | 9,000 | 27,494 | 99,118 | 1,416 | 70.0 | 9.1% |
| Royal Hotel (ロイヤルホテル, 9713) BS date 30 Jun 2026 | ¥914 | 13,987 | 331 | 11,443 | 2,875 | 3,489 | 0.8 | 5.2% |
| Fujita Kanko (藤田観光, 9722) BS date 30 Jun 2026 | ¥2,901 | 177,069 | 23,038 | 16,991 | 183,116 | 9,108 | 20.1 | 29.8% |
Note: the table is ordered by ticker and implies no ranking. Because disclosure definitions for rooms operated (directly operated, management contract, FC, overseas) are not consistent across companies, the room counts cannot be used to compare business scale.
· Resort Trust 6,068 rooms = total available hotel rooms in the “Operating Results” section of the 53rd annual securities report (FY ended March 2026).
· Greens 16,942 rooms = period-end room count in the interim results presentation for the fiscal year ended June 2026 (end of December 2025, 118 properties). The company expanded to 120 properties by the end of the June 2026 fiscal year.
· Imperial Hotel 1,416 rooms = Imperial Hotel Tokyo 909 rooms, Osaka 378, Kamikochi 74 and Kyoto 55 (room counts published on each hotel’s official website).
· Royal Hotel 3,489 rooms = Rihga Royal Hotel Osaka (under management contract) 1,001 rooms and others, built up from the published room counts of 10 group-operated hotels (the 466 rooms of Shiba Park Hotel and Park Hotel Tokyo are as stated in the company’s annual securities report).
· Fujita Kanko 9,108 rooms = the property list in the Q2 FY2026 (December) results presentation (as of 6 August 2026; 46 lodging locations, 11,660 rooms) less 13 FC locations with 2,552 rooms. It includes 3 overseas locations with 774 rooms and 3 management-contract or business-alliance locations with 114 rooms.
· Greens’ interest-bearing debt is the borrowings in the FY June 2026 earnings release (long-term borrowings due within one year ¥2,075M + long-term borrowings ¥9,639M), and cash etc. is cash and deposits at the same period end. Lease liabilities are excluded for all five companies because disclosure categories differ.
Factor (a) Ownership versus management contract or lease — a company without real estate carries no property value in its share price
The first source of the gap is simply whether the company owns the land and the building the rooms sit in. A J-REIT’s acquisition price per room is by definition 100% the price of real estate, whereas an operator’s EV is the present value of the cash flow generated by the business. If it does not own property, that value does not appear in the share price.
Royal Hotel transferred the trust beneficiary interests in the land and building of Rihga Royal Hotel Osaka in March 2023 and now operates that hotel under a management contract (FY March 2026 annual securities report). Its “Status of Major Facilities” section shows no land book value recorded at any of the filer’s business locations, and both Rihga Gran Kyoto and Rihga Place Kyoto Shijo Karasuma occupy leased buildings. In other words, almost none of the real estate corresponding to the 3,489 rooms it operates sits on its balance sheet. EV per room of ¥0.8 million does not mean the market values it poorly; it reflects a structure in which the equity simply does not hold per-room real estate value in the first place.
Greens is likewise an asset-light operator built around leases. For the fiscal year ended June 2026 it posted record-level revenue of ¥53,998 million and operating profit of ¥6,964 million, and its ROE of 43.8% is the highest of the five. The structure of generating high profit from little invested capital shows up in the numbers, and a small EV per room is naturally read as the flip side of that capital efficiency. The company’s medium-term plan targets 18,000 rooms by the fiscal year ending June 2028, and it had built up to 118 properties and 16,942 rooms as of the end of December 2025. Being able to grow room count without owning real estate is the clear strength of this model.
Conversely, at companies such as Fujita Kanko and Resort Trust, where a high share of land and buildings is owned outright, real estate value is embedded in EV per room. Even among companies all called “hotel companies,” what the equity represents differs by ownership form.
Ownership model
Land and buildings held on own account. Real estate value is carried in EV per room, bringing it closer to a level comparable with acquisition prices on the physical side. Where unrealised gains exist, it can exceed the physical level.
Management-contract model
The real estate is held by a third party and the company earns operating fees and GOP-linked incentives. EV per room reflects only the earning power of the operating business and cannot be compared with physical per-room prices.
Lease (asset-light) model
Buildings are leased and operated. Invested capital is small, which tends to lift ROE, while EV per room is structurally small. The evaluation axis shifts to capital efficiency and growth speed.
Factor (b) Land book value and unrealised gains — 11,000 m² in Uchisaiwaicho at a book value of ¥2 million
The second factor is the amount at which owned land sits on the books. Imperial Hotel’s FY March 2026 annual securities report states, under “Status of Major Facilities,” that the land at its head office (Chiyoda-ku, Tokyo) covers 11,000 m² with a book value of ¥2 million. A further 12,000 m² is leased. It is a textbook case of an old acquisition left on the books at close to zero.
For reference, the 2026 official land price survey puts the average for commercial land in Chiyoda-ku at ¥7,356,538 per m² (+13.05% year on year). Applying that average mechanically to the 11,000 m² held gives roughly ¥81 billion, enough to account for most of the company’s ¥99.1 billion EV from land alone. Actual valuation would of course vary greatly with the specific site, plot conditions and the progress of redevelopment plans, so this is only a reference calculation to check the order of magnitude. Even so, it shows that the reason Imperial Hotel’s EV per room of ¥70.0 million far exceeds the ¥34.5 million on the physical side lies in the land, not in the earning power of the rooms themselves.
In a timely disclosure dated 27 March 2026, the company announced that it had revised the start of demolition work on the Imperial Hotel Tokyo Tower Wing to around the end of fiscal 2030, and that the Tower Wing’s hotel business (all guest rooms and banquet halls) and real estate leasing business would continue operating until then. The Uchisaiwaicho 1-chome district redevelopment is under way, and the equity market is looking both at land value that prices in that redevelopment and at the cash flow generated by operating the current 909-room scale (Main Building 560 rooms, Tower Wing 349 rooms). At this company, EV per room reflects less the price of a room than the option value of prime central-Tokyo land ahead of redevelopment.
For Fujita Kanko too, central-Tokyo assets such as Hotel Chinzanso Tokyo in Bunkyo-ku sit behind a PBR of 4.04×. The company substantially built up shareholders’ equity in the fiscal year ended December 2025 (the equity ratio improved from 27.3% at December 2024 to 43.4% at the end of June 2026), and it is in a phase where balance-sheet strengthening and a re-rating of asset value are proceeding together. EV per room of ¥20.1 million is below the ¥24.4 million median on the physical side, but the value of held assets is already being priced in to some degree, and further room for the evaluation axis to widen remains if growth in non-room businesses such as weddings and banquets is added.
Factor (c) Non-room revenue — more than half of sales cannot be measured “per room”
The third factor is that most revenue is not generated by rooms at all. EV per room puts room count in the denominator, but the numerator, EV, is the value of the whole company — so the larger the non-room business, the larger the per-room figure becomes.
Broken down by department for FY March 2026, Imperial Hotel Tokyo generated ¥11,862 million in rooms revenue against ¥12,256 million in banquets, ¥6,250 million in restaurants and ¥2,341 million in external sales. Banquets exceed rooms. Imperial Hotel Osaka shows the same shape, with ¥2,772 million in rooms against ¥4,054 million in banquets and ¥1,397 million in restaurants; combining Tokyo and Osaka, rooms account for only about 36% of departmental revenue. On a customer-count basis, overnight guests are 21.0%, with dining guests at 54.0% and banquet guests at 25.0% making up the majority.
Fujita Kanko is similar. Of cumulative Q2 FY December 2026 revenue of ¥40,755 million, the lodging-led WHG business accounted for ¥24,370 million (59.8%), the Luxury & Banquet business centred on Hotel Chinzanso Tokyo for ¥10,444 million (25.6%), and the Resort business for ¥5,219 million (12.8%). The Luxury & Banquet business posted a ¥0.66 billion revenue increase and ¥0.20 billion profit increase year on year on higher wedding volumes and unit prices — earnings sources that room counts cannot measure are lifting the company’s value.
Non-room revenue weighs most heavily of all at Resort Trust. Segment revenue in Q1 FY March 2027 was ¥27,476 million (44.8%) for hotels and restaurants, ¥18,892 million (30.8%) for membership sales and ¥14,701 million (24.0%) for medical services — but on segment profit, hotels and restaurants contributed only ¥1,093 million, just 10.5% of the ¥10,369 million total. Two-thirds of profit comes from the membership business (¥6,920 million).
Resort Trust’s EV per room of ¥60.8 million therefore does not mean a room generates ¥60.8 million of value. Most of the EV is the market’s assessment of the membership and medical businesses, and the denominator of 6,068 rooms is merely the vessel that value is poured into.
Membership resorts sit outside the “per room” frame — deposits and memberships need a separate explanation
Trying to measure a membership resort with a per-room yardstick runs into another large issue: the deposits from members recorded on the liability side.
Resort Trust’s consolidated balance sheet as of 30 June 2026 records ¥113,343 million of deferred revenue, ¥123,242 million of amortisable long-term guarantee deposits and ¥27,868 million of long-term guarantee deposits. The total of ¥264,453 million is equivalent to roughly 72% of the company’s ¥368.6 billion EV. Deferred revenue is the portion of membership sales proceeds, including for hotels not yet opened, that has not yet been recognised as revenue; guarantee deposits are amounts members have the right to have returned on withdrawal.
These are not interest-bearing debt for accounting purposes and are therefore excluded from the EV calculation in this article, but in substance they show a structure in which the funds to build rooms are raised from members in advance. Where a conventional ownership-model hotel builds rooms with bank borrowings and equity, a membership resort builds them with money collected from members and allocates usage rights to those members. Its rooms therefore do not exist in order to earn a nightly rate in the accommodation market; they exist as the underlying assets behind a membership product.
This is the single biggest caution when comparing EV per room across companies. A membership resort’s room is priced by membership sale prices, annual fees and the value of referrals to adjacent services such as medical care — not by RevPAR earned from accommodation demand. The company’s Q1 saw record membership contract value, and with member recruitment for “Sanctuary Court Sotobo Suzumejima” starting in June 2026, this business model is in an expansion phase.
Five companies read through three factors — the same “room,” different objects of valuation
Applying the three factors to each company organises the dispersion in EV per room as follows. Higher or lower is not better or worse; it expresses what the equity market is putting a price on.
| Company (by ticker) | EV per room | (a) Ownership form | (b) Unrealised land gains | (c) Non-room revenue | Main axis of equity valuation |
|---|---|---|---|---|---|
| Resort Trust (4681) | 60.8 | Mainly owned (membership model) | — | Large (about 90% of profit is non-room) | Membership contract value, medical membership numbers |
| Greens (6547) | 1.7 | Mainly leased (asset-light) | — | Small (accommodation-led) | Capital efficiency (ROE 43.8%) and opening pace |
| Imperial Hotel (9708) | 70.0 | Owned (Tokyo) / leased (Osaka, Kyoto) | Very large (11,000 m² in Uchisaiwaicho at a ¥2M book value) | Large (about 64% of departmental revenue) | Redevelopment of the Uchisaiwaicho 1-chome district |
| Royal Hotel (9713) | 0.8 | Mainly management contract and lease | — | Medium (banquets, food and beverage) | Earning power of operating fees and ¥11.1bn of net cash |
| Fujita Kanko (9722) | 20.1 | Mainly owned | Large (central-Tokyo holdings) | Large (weddings, banquets) | Re-rating of held assets and growth in the wedding business |
The ¥34.5 million figure on the physical side is not directly comparable with any of these five companies. A comparison would only hold for a company that is (a) an owner, (b) carrying land at a book value close to market, and (c) light on non-room revenue. None of the five fully meets those conditions — and that in itself is the conclusion: equity in a listed hotel operating company is not a substitute for physical real estate.
Put the other way round, an investor seeking exposure to physical real estate will find J-REITs the straightforward option, while an investor backing operating capability, brand or the growth of non-room businesses should be looking at listed operating companies. Lumping the two together as “investing in hotels” means taking on entirely different risks.
How far does EV per room move? A two-axis sensitivity on share price and room-count definition
Every EV per room figure above is a single point cut at the 2 September 2026 close. The metric depends heavily on two inputs — the share price and the definition of rooms operated — and both move within a range. Treated as a point estimate, the conclusion ends up driven by how the inputs are set rather than by the level itself. Here we take each company’s disclosed figures exactly as used in the article and flex the two inputs mechanically to show the band.
EV per room when the share price moves ±20%
Holding everything but market capitalisation fixed (interest-bearing debt, cash and equivalents, rooms operated), the table shows EV per room when the share price alone moves ±20% from the reference-date close. Bear, base and bull refer to how the share price is set, not to any view on the companies’ business outlook.
| Company (by ticker) | Bear price −20% | Base reference close | Bull price +20% | Bear-to-bull range | Main driver of the range |
|---|---|---|---|---|---|
| Resort Trust (4681) | 47.7 | 60.8 | 73.8 | 26.1 | Market cap makes up most of EV, so price moves pass through almost proportionally |
| Greens (6547) | 1.4 | 1.7 | 2.1 | 0.7 | A large room count dilutes the swing in absolute amounts on a per-room basis |
| Imperial Hotel (9708) | 53.4 | 70.0 | 86.6 | 33.2 | With 1,416 rooms as the denominator, the per-room swing is the largest of the five |
| Royal Hotel (9713) | 0.0 | 0.8 | 1.6 | 1.6 | Cash etc. of ¥11.4bn is close to the ¥14.0bn market cap, so EV nearly nets to zero |
| Fujita Kanko (9722) | 16.2 | 20.1 | 24.0 | 7.8 | Interest-bearing debt and cash offset each other, damping the pass-through of price moves |
Royal Hotel stands out in this table. Against ¥11.4 billion of cash and equivalents it carries just ¥0.3 billion of interest-bearing debt, so netting against a ¥14.0 billion market cap shrinks EV to ¥2.9 billion. A 20% fall in the share price takes EV close to zero and the EV-per-room metric stops meaning anything at all. Where net cash is thick, dividing EV by room count is inherently unstable — this is a property of the metric, not a quirk of the company.
Imperial Hotel is the opposite case: with 1,416 rooms, the smallest denominator of the five, a ±20% share-price move alone shifts EV per room by ¥33.2 million, from ¥53.4 million to ¥86.6 million. Its distance from the ¥34.5 million per-room acquisition price on the physical side changes substantially with nothing more than the choice of share-price level.
What happens when the room-count definition changes — a two-axis grid for Fujita Kanko
The other input, rooms operated, is disclosed on inconsistent definitions. Of Fujita Kanko’s 46 lodging locations and 11,660 rooms, this article uses 9,108 rooms as the denominator, excluding 13 FC locations with 2,552 rooms. Removing a further 3 overseas locations with 774 rooms and 3 management-contract or alliance locations with 114 rooms gives 8,220 rooms. All are legitimate definitions grounded in the company’s own disclosure, and which one is chosen changes EV per room. The grid below flexes both share price and room-count definition.
| Share price | Incl. FC 11,660 rooms | This article’s basis 9,108 rooms | Domestic direct only 8,220 rooms | Assumed EV |
|---|---|---|---|---|
| −30% | 11.1 | 14.3 | 15.8 | 129,995 |
| −15% | 13.4 | 17.2 | 19.0 | 156,556 |
| Base (close, 2 Sep 2026) | 15.7 | 20.1 | 22.3 | 183,116 |
| +15% | 18.0 | 23.0 | 25.5 | 209,676 |
| +30% | 20.3 | 25.9 | 28.7 | 236,237 |
The corners of the grid span ¥11.1 million to ¥28.7 million. A 2.6-fold range arises purely from how the assumptions are set, with nothing about the business changing. For reference, measuring the range the same way on the physical side, per-room acquisition prices by vintage run from ¥20.4 million for 2013–15 purchases to ¥46.3 million for pre-2012 purchases, a 2.3-fold range — so the assumption-driven range on the equity side is as wide or wider.
How to read the sensitivity analysis: the figures in this section are illustrative calculations that hold each company’s disclosed values fixed and flex only the share price and the room-count definition. They are not earnings forecasts, target prices or projections of future valuation levels. Actual share prices move on company-specific factors and the ranges are not uniform. The purpose is simply to confirm that EV per room is a metric to be read as a band rather than a point.
Implications for exit planning and valuation
The owner and seller’s view
When considering the sale of a single hotel, the reference point is the per-room acquisition price on the physical side. This aggregation puts the median by property at ¥24.4 million, and properties acquired in the most recent 2025–26 window at ¥37.4 million. Because acquisition prices swing widely with location, grade and building age, the premise is to narrow the reference set to acquisitions with conditions close to your own asset. EV per room at a listed operator cannot be used as a guide to a sale price. To factor in the level of renewal investment that follows acquisition, the range of capital expenditure disclosed by REITs, set out in Hotel Capex: ¥134k–¥624k per Room a Year, is also a useful reference.
The institutional investor and sell-side research view
When valuing a listed hotel operating company on an NAV-style basis, the first step is to decompose it into factors (a) to (c) and identify which parts a real estate approach can be applied to. DCF and EV/EBITDA suit companies with a high share of management contracts and leases, while an adjusted net-asset approach that marks held real estate to market works for companies sitting on low-book-value central-city land. Where a membership business is involved, the repayment obligation on deferred revenue and guarantee deposits and the future revenue-recognition schedule need to be evaluated separately.
The private fund and PE view
In evaluating the acquisition of an operator, value is determined less by the target’s total room count than by the breakdown: how many rooms it owns, and how many it runs under management contract or lease. Even among these five companies, the same room count valued under a different ownership form differs by an order of magnitude per room. Pinning down the split of rooms across owned, management-contract, leased and FC at the early stage of due diligence is the starting point of valuation.
A note on the figures in this article: share prices, market capitalisations and shares outstanding are as of the 2 September 2026 close, and EV per room changes daily with share price movements. Balance sheet items are based on each company’s most recently disclosed consolidated results, with reference dates differing by company (stated in the tables). REIT acquisition prices are amounts at the time of acquisition and do not match current appraisal values. Rooms operated cannot be used to compare business scale because disclosure definitions are not consistent across companies. This article does not recommend the purchase or sale of any security; investment decisions are your own responsibility.
Conclusion
The price actually paid per room for the 300 domestic properties and 52,347 rooms held by seven J-REITs is ¥34.5 million, with a median by property of ¥24.4 million. EV per room at five listed hotel operating companies, by contrast, is distributed from ¥0.8 million to ¥70.0 million, with companies above and far below the physical level sitting side by side.
The gap is almost entirely explained by three factors: (a) the difference in business form between owning real estate and running it under management contract or lease, (b) the difference between the book value and market value of land acquired long ago, and (c) the size of non-room revenue such as banquets, weddings, memberships and medical services. Imperial Hotel’s 11,000 m² in Uchisaiwaicho carried at a book value of ¥2 million; Resort Trust’s membership deposits and deferred revenue reaching ¥264.4 billion, equal to roughly 70% of EV; Royal Hotel operating its Osaka flagship under a management contract. Each of these is a fact the companies disclose themselves, and behind each lies a structure that a single per-room yardstick cannot capture.
When considering an investment in hotels, physical assets and equities look like entrances to the same asset class but in practice buy entirely different bundles of risk and return. Lining up per-room amounts is worthwhile as a starting point for making that difference visible.
Related Reading
References and Sources
■ Data sources
The physical side draws on MetroEngines Research & Consulting’s REIT ownership master (snapshot as of 31 August 2026), covering 300 domestic properties and 52,347 rooms held by seven hotel-focused and diversified REITs; overseas properties are excluded from the aggregation. The equity side uses Tokyo Stock Exchange listed equity data (share prices and shares outstanding, 2 September 2026 close) together with the annual securities reports, earnings releases and results presentations of the five listed companies. The reference land price level is from the Ministry of Land, Infrastructure, Transport and Tourism’s 2026 official land price survey.
■ Calculation assumptions
EV = market capitalisation + interest-bearing debt − cash and equivalents. Lease liabilities are excluded for all five companies because disclosure categories are not consistent. EV per room = EV ÷ rooms operated, where rooms operated is a build-up excluding rooms owned and operated by third parties under FC agreements. Acquisition price per room = the sum of property-level acquisition prices ÷ the sum of rooms, with acquisition price being the amount at the time of purchase. The vintage aggregation covers the 293 properties for which an acquisition year could be identified. The sensitivity analysis fixes interest-bearing debt, cash and equivalents and room counts at disclosed values and flexes only market capitalisation, with the room-count variation using Fujita Kanko’s disclosure categories (11,660 rooms including FC / 9,108 rooms as the basis here / 8,220 rooms domestic direct only).
■ Limitations and cautions
Share prices move daily, so EV per room is a reference-date value only. Balance sheet reference dates differ by company (stated in the tables). Because disclosure definitions for rooms operated (directly operated, management contract, FC, overseas) are not consistent, room counts themselves cannot be used to rank companies by business scale. REIT acquisition prices are amounts at the time of acquisition and do not match current appraisal or market values. The sensitivity figures are illustrative calculations from mechanically flexed assumptions, not earnings forecasts or target prices. This article does not recommend the purchase or sale of any security; investment decisions are your own responsibility.
■ Market data and aggregation
- MetroEngines Research & Consulting — REIT ownership master (snapshot as of 31 August 2026; 300 domestic properties, 52,347 rooms)
■ Listed company IR disclosures and primary sources
- Imperial Hotel, Ltd., “185th Annual Securities Report” (19 June 2026) / “Q1 FY March 2027 Earnings Release” (30 July 2026) / “(Change to Disclosed Matters) Partial Revision to the Notice Regarding the End of Operations at the Imperial Hotel Tokyo Tower Wing” (27 March 2026)
- The Royal Hotel, Ltd., “Q1 FY March 2027 Earnings Release” (5 August 2026) / “100th Annual Securities Report”
- Fujita Kanko Inc., “Q2 FY December 2026 Earnings Release” (6 August 2026) / “Q2 FY December 2026 Results Presentation” (property list, as of 6 August 2026)
- Resort Trust, Inc., “Q1 FY March 2027 Earnings Release” (12 August 2026) / “53rd Annual Securities Report” (23 June 2026)
- Greens Co., Ltd., “FY June 2026 Earnings Release” (13 August 2026) / “FY June 2026 Interim Results Presentation” (February 2026)
■ REIT disclosures
- Japan Hotel REIT Investment Corporation — portfolio list
- Invincible Investment Corporation — portfolio list
- Mori Trust Reit, Inc. — portfolio list
- Ichigo Hotel REIT Investment Corporation — portfolio list
- Nippon Hotel & Residential Investment Corporation — portfolio list
- Hoshino Resorts REIT, Inc. — portfolio list
- Kasumigaseki Hotel REIT Investment Corporation — portfolio list
■ Equity and public data
- Tokyo Stock Exchange listed equity data (share prices and shares outstanding, 2 September 2026 close)
- Ministry of Land, Infrastructure, Transport and Tourism, “Official Land Prices” 2026 — Chiyoda-ku commercial land average