

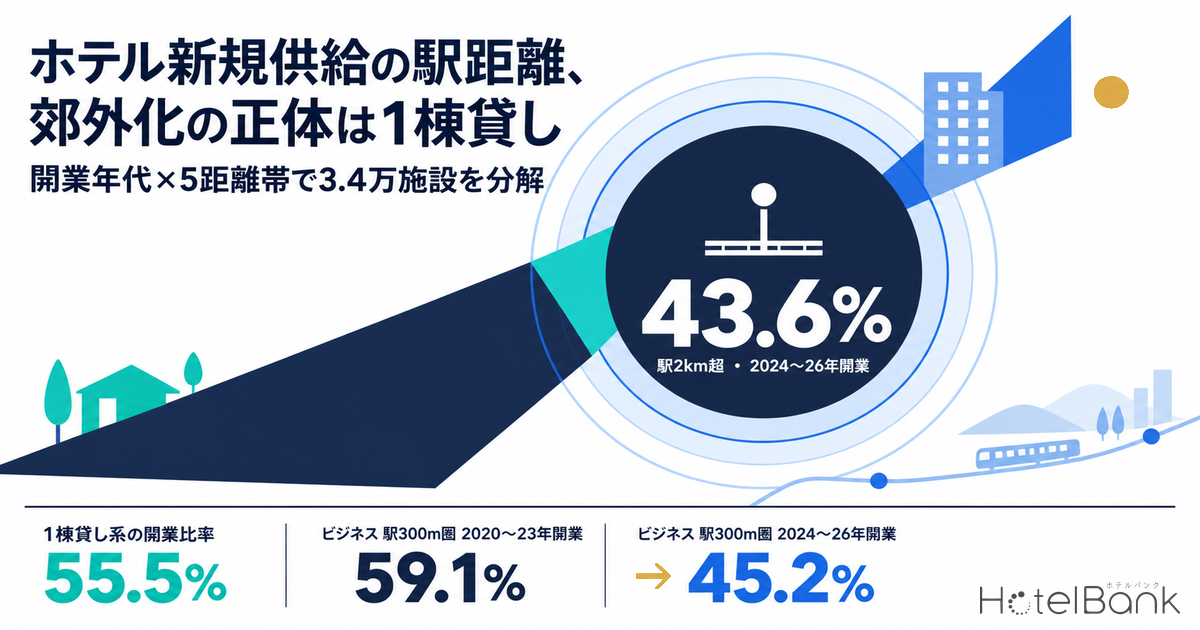
Over the past quarter century, has new hotel supply in Japan moved away from train stations, or closer to them? MetroEngines Research tracks prices at 34,192 properties nationwide (1.50 million rooms). We split the straight-line distance from each property to its nearest station into five bands and compared the distribution by opening cohort. Among properties opened in 2024–26, 43.6% sit more than 2 km from a station, up 12.0 points from 31.6% for the 2015–19 cohort. On the headline number alone, that looks like suburbanization. Broken down by property type, however, most of the rise is explained by a change in mix: whole-unit rentals such as vacation homes and cottages grew until they made up 55.5% of openings. City hotels, resort hotels and budget lodging actually moved closer to stations. The exception is business hotels, whose share within 300 m of a station fell from 59.1% for the 2020–23 cohort to 45.2% for the 2024–26 cohort, spreading into the 600 m–2 km middle bands.
Metric Definitions Used in This Article
- Station distance: The shortest straight-line distance from each property’s registered coordinates to a station facility listed in the station ridership data of the MLIT Real Estate Information Library (about 10,000 points, counted by operator and line). Walking distance is longer than straight-line distance because of road layouts. Properties with no station within 2 km are grouped into a single “over 2 km (outside station catchment)” band and are not excluded.
- Opening cohort: Based on the opening date registered in OTA and other listing information. Properties whose opening year cannot be identified are excluded from the cohort analysis; their count and share are noted with each chart and table.
- ADR (Average Daily Rate): An estimated settled rate (tax-exclusive equivalent), calculated by applying a property-type correction factor to the lowest published plan level on OTAs (per room, based on 2 guests per room, tax-inclusive). Checked against property-level results disclosed by listed hotel REITs (91 properties, most recent 3 months), the median error is about 7%. These are estimates and differ from each property’s actual settled prices and accounting figures. This article uses each property’s median of monthly estimates from September 2025 to August 2026, and shows the median of those values for each band.
- Regional classification: Three major metropolitan areas = Tokyo, Kanagawa, Saitama, Chiba / Aichi, Gifu, Mie / Osaka, Kyoto, Hyogo, Nara. Regional hubs = designated cities and prefectural capitals outside the three major metropolitan areas. Other regional areas = everything else.
- Data sources: MetroEngines Research (properties and prices); MLIT Real Estate Information Library (stations, official land prices, zoning)
How This Article Differs From Earlier Coverage
(1) Station Premium Ends at an 8-Minute Walk: 8 Stations, 1,012 Hotels measured how ADR decays with distance from the station at a single point in time. This article looks at how the supply-side distribution has shifted across opening cohorts. (2) An earlier analysis of rooms per 10,000 station riders (median: 20 rooms) looked at the ratio of station demand to room stock; this article covers the distribution of distance from the station itself. (3) An earlier analysis finding that 61% of 2026 openings fall outside Urbanization Promotion Areas classified supply by city-planning zones; this article classifies it by physical distance from the station.
- — 43.6% are over 2 km away: The share of 2024–26 openings located more than 2 km from a station rose 12.0 points from 31.6% for 2015–19 openings. Weighted by room count, however, the rise is only from 11.7% to 17.2%.
- — Driven by a surge in whole-unit rentals: Vacation homes, cottages and similar properties accounted for 55.5% of openings (10.4% for 2010–14 openings). The 2.4-point rise versus 2010–14 breaks down into a mix effect of +11.0 and a within-type effect of −8.6.
- — Only business hotels moved to the middle bands: Their share within 300 m of a station went from 59.1% (2020–23 openings) to 45.2% (2024–26 openings), with the change starting in 2023. City hotels (65.1%), resort hotels and budget lodging moved closer to stations instead.
- — Land prices in the major metros, demand structure in the regions: In the three major metros, the nearest land price for properties within 300 m of a station is ¥1,195,000/㎡, up 10.4% YoY, consistent with the move to the middle bands. In regional areas, prices near stations rose only 1.7%, pointing to roadside demand as the bigger factor.
- — The rate advantage near stations has widened: For business hotels opened in the 2020s, estimated settled ADR is ¥11,700 within 300 m versus ¥7,400 at 1–2 km (a 58% gap). Station-distance criteria for new sites should compare like-for-like property types and check which era of the market they assume.
Across All Properties, the “Over 2 km” Share Hovered Around 40% Before Reaching 43.6% for 2024-26
We first sorted all properties, without distinguishing by type, into five distance bands for each opening cohort. The share within 300 m of a station peaked at 31.2% for the 2015–19 cohort and fell to 20.1% for the 2024–26 cohort. Meanwhile, the share over 2 km rose from 31.6% to 43.6%. That is back to roughly the level of properties opened in 1999 or earlier (40.6%), and on this chart alone one could conclude that “new supply is moving away from stations.”
That reading, however, rests on an assumption: that each cohort’s openings have the same mix of property types. As shown below, the property-type mix of 2020s openings changed substantially, so comparing the all-property shares directly mixes together changes in location decisions with changes in the type mix. Weighted by room count, the over-2 km share rises only from 11.7% for 2015–19 openings to 17.2% for 2024–26 openings. The gap between the count-based and room-based figures shows that properties over 2 km away tend to be small.
This chart is based on confirmed OTA listings. Only about 19% of properties are listed on OTAs before opening, and more than half are listed after they open, so the number of properties for the most recent months and years may increase as further listings are added. We recommend reading it alongside the building-plan pipeline based on building confirmation applications (MLIT “Statistical Survey on Building Construction Starts”).
The Property-Type Mix Has Turned Over — Whole-Unit Rentals Are 55.5% of 2024-26 Openings
Lining up the property-type mix by opening cohort shows how large the shift has been. Among properties opened in 1999 or earlier, ryokan made up 42.3%; in the 2000s, business hotels were the largest group at 43.2%. In 2015–19, as inbound demand took off, budget lodging (guesthouses, hostels, capsule hotels and similar) grew to 32.8%. Then in the 2020s, whole-unit rentals such as vacation homes, cottages and glamping came to account for 43.7% of 2020–23 openings and 55.5% of 2024–26 openings.
In every cohort, more than half of whole-unit rentals are located over 2 km from a station. Their average size among 2024–26 openings is just 2.3 rooms, so a property type with very few rooms per property is inflating the count. Comparing distance distributions without separating property types makes this surge show up directly as “suburbanization.” How supply looks different by property count versus room count is also covered in Japan 2026: 1,242 openings and 33,749 rooms.
Decomposing “Suburbanization” — Mix Effect vs. Location Shifts Within Each Type
We split the change in the all-property over-2 km share into the part caused by the change in property-type mix (mix effect) and the part caused by location shifts within the same property type (within-type effect). Comparing 2010–14 openings with 2024–26 openings, the overall over-2 km share rose by only 2.4 points, made up of a mix effect of +11.0 points and a within-type effect of −8.6 points. The rising share of whole-unit rentals alone pushed the figure up by +27.9 points, partly offset by the falling share of ryokan (−11.4 points). Within property types, locations actually moved toward stations over the same period.
Using 2015–19 openings as the baseline instead, the overall rise is larger at 12.0 points, split almost evenly between a mix effect (+5.7 points) and a within-type effect (+6.3 points). Most of that within-type effect (+5.5 points), however, comes from whole-unit rentals themselves shifting further beyond 2 km; hotel types contribute little. Whichever baseline year is used, the main driver of “suburbanization” is whole-unit rentals. Hotel location decisions did not swing toward the suburbs across the board.
Within Their Own Types, City Hotels, Resorts and Budget Lodging Moved Closer to Stations
Tracking the within-300 m share type by type, the movements diverge. For city hotels, it rose from 46.2% for properties opened in 1999 or earlier to 65.1% for 2024–26 openings; the newer the cohort, the more concentrated near stations. Budget lodging stayed at 6–9% through the 2000s, jumped to 31.0% for 2015–19 openings, and has held around 30% since. A likely factor is the growth of urban hostels and capsule hotels using small plots near stations.
Resort hotels also saw their over-2 km share fall from 75.2% for 2010–14 openings to 56.1% for 2024–26 openings, while the within-300 m share rose to 10.1%. This appears to reflect the addition of urban resorts and mixed-use developments directly connected to stations. Ryokan have stayed at around 50% over 2 km regardless of cohort; given their hot-spring locations, their distribution has barely moved. Whole-unit rentals remain at about 10% within 300 m.
| Type | Within 300 m ≤1999 | Within 300 m 2024-26 | Over 2 km ≤1999 | Over 2 km 2024-26 | N (≤1999 / 2024-26) | Opening year missing |
|---|---|---|---|---|---|---|
| Business | 54.4% | 45.2% | 7.0% | 14.6% | 1,799 / 568 | 9.3% |
| City | 46.2% | 65.1% | 8.2% | 4.7% | 741 / 106 | 2.0% |
| Resort | 3.7% | 10.1% | 68.7% | 56.1% | 591 / 228 | 7.2% |
| Ryokan | 11.1% | 12.3% | 52.0% | 48.7% | 3,299 / 154 | 22.7% |
| Budget lodging | 8.6% | 29.2% | 64.5% | 34.7% | 899 / 691 | 26.7% |
| Whole-unit rentals | 6.7% | 10.6% | 69.0% | 53.7% | 239 / 2,266 | 17.8% |
Only Business Hotels Spread Into the Middle Bands — A Shift Starting With 2023 Openings
Business hotels are the only hotel type that moved away from stations. Their within-300 m share held around 60% — 60.6% for 2015–19 openings and 59.1% for 2020–23 openings — before falling to 45.2% for 2024–26 openings. What grew instead was the 600 m–2 km middle band, from 13.4% to 22.0%, while the over-2 km share also rose from 8.0% to 14.6%. Average size shrank from 127.2 rooms for 2020–23 openings to 100.8 rooms.
By individual opening year, the change began in 2023. The within-300 m share was 59–63% in 2020–22, then fell to 50.2% in 2023 and 39.9% in 2024, before moving around 50% with 50.0% in 2025 and 45.1% in 2026. The 2026 count may grow because some OTA listings are added after opening, but since the same trend shows up in 2024 on its own, the shift cannot be explained by listing delays alone.
The Spread Looks Different in the Three Major Metros and in Regional Areas
Splitting the business hotel shift by region shows different patterns. In the three major metros, the within-300 m share fell from 70.0% for 2020–23 openings to 63.9% for 2024–26 openings, but the over-2 km share stayed at 3.9%; the growth was in the 600 m–2 km band (6.3% → 12.7%). This is a move from station-front sites to the next ring out. Regional hubs (designated cities and prefectural capitals) followed a similar pattern: the within-300 m share fell from 62.9% to 52.6%, and the 1–2 km share grew from 5.9% to 13.8%.
The shift is larger in other regional areas. The within-300 m share fell from 32.8% to 22.1%, while the over-2 km share rose from 24.7% to 30.6%. In areas where people travel mainly by car rather than rail, sites along arterial roads and around highway interchanges tend to be chosen, and that trend appears to be strengthening (for supply around highway interchanges, see the 10 km catchments of 50 smart interchanges under construction).
| Business hotels | ≤300m | 300-600m | 600m-1km | 1-2km | Over 2km | N |
|---|---|---|---|---|---|---|
| 3 major metros 2020-23 | 70.0% | 20.9% | 3.7% | 2.6% | 2.8% | 573 |
| 3 major metros 2024-26 | 63.9% | 19.6% | 7.0% | 5.7% | 3.9% | 230 |
| Regional hubs 2020-23 | 62.9% | 21.5% | 8.4% | 5.9% | 1.3% | 237 |
| Regional hubs 2024-26 | 52.6% | 19.8% | 8.6% | 13.8% | 5.2% | 116 |
| Other regional 2020-23 | 32.8% | 14.8% | 14.0% | 13.7% | 24.7% | 271 |
| Other regional 2024-26 | 22.1% | 15.8% | 13.5% | 18.0% | 30.6% | 222 |
For reference, here is the distribution by cohort for the four hotel types combined (business, city, resort and ryokan). The within-300 m share peaked at 44.5% for 2020–23 openings and fell to 34.8% for 2024–26 openings. As noted above, however, city and resort hotels moved closer to stations, so this decline largely reflects business hotels’ own shift and the change in their share of openings.
| Four hotel types | ≤300m | 300-600m | 600m-1km | 1-2km | Over 2km | N |
|---|---|---|---|---|---|---|
| ≤1999 | 26.6% | 14.4% | 10.5% | 12.6% | 35.9% | 6,430 |
| 2000-09 | 37.8% | 14.2% | 8.9% | 12.8% | 26.3% | 2,415 |
| 2010-14 | 33.6% | 13.8% | 7.7% | 10.8% | 34.1% | 1,137 |
| 2015-19 | 42.0% | 15.5% | 8.1% | 9.6% | 24.7% | 2,158 |
| 2020-23 | 44.5% | 16.8% | 7.7% | 8.9% | 22.1% | 1,772 |
| 2024-26 | 34.8% | 15.4% | 8.3% | 13.8% | 27.6% | 1,056 |
Map of Hotels Opened in 2024-26
We mapped the 1,056 properties of the four hotel types that opened in 2024–26, color-coded by station-distance band. In the three major metros and regional core cities, dark markers (within 300 m) cluster around stations, with middle-band properties lining their outer edges. Meanwhile, light markers (over 1 km) are scattered along regional arterial roads and in tourist areas.
Do Station-Front Sites Command Higher Rates? The Gap Widens With Newer Cohorts
For business hotels, we organized estimated settled ADR over the last 12 months by station-distance band and opening cohort. Nationwide, among properties opened in 2009 or earlier, ADR is ¥7,800 within 300 m and ¥6,700 at 1–2 km, a gap of just 16%. For 2010s openings it is ¥11,100 within 300 m versus ¥6,900 at 1–2 km, a 62% gap; for 2020s openings, ¥11,700 versus ¥7,400, a 58% gap. Newer cohorts achieve higher rates near stations, while rates in the bands farther from stations stay around ¥7,000 regardless of cohort.
By region, the change in slope is even clearer. Outside the three major metros, the gap between within 300 m and 1–2 km widened from 7% for openings in 2009 or earlier to 24% for 2010s openings and 35% for 2020s openings. In the three major metros, 2010s openings showed a 71% gap — ¥12,700 within 300 m versus ¥7,400 at 600 m–1 km — but for 2020s openings the 600 m–1 km figure is ¥9,000, narrowing the gap to 41% (note that N=31 for the 600 m–1 km cell is small). The middle bands in the metros are raising rates in the newer cohorts. Note that these rates reflect each property’s level over the last 12 months, not its rate at opening, and that newer properties’ rates also reflect their newer buildings.
| Nationwide business hotels | ≤300m | 300-600m | 600m-1km | 1-2km | Over 2km |
|---|---|---|---|---|---|
| Opened ≤2009 | ¥7,839 N=1,733 | ¥7,438 N=591 | ¥6,857 N=315 | ¥6,746 N=285 | ¥7,138 N=233 |
| Opened 2010-19 | ¥11,131 N=1,090 | ¥8,986 N=326 | ¥7,573 N=118 | ¥6,870 N=124 | ¥7,410 N=159 |
| Opened 2020-26 | ¥11,690 N=825 | ¥10,168 N=278 | ¥7,274 N=121 | ¥7,384 N=125 | ¥7,005 N=150 |
Land Prices as a Push Factor — +10.4% Near Stations in the Major Metros, Nearly Flat in the Regions
To test whether rising prices for station-front land are pushing supply outward, we took 1,265 properties sampled by distance band and region from the four hotel types, and tallied the price and YoY change at the nearest official land price or prefectural land price survey point (2026, within 1.5 km). In the three major metros, the median nearest-point price for properties within 300 m of a station was ¥1,195,000 per ㎡, up 10.4% YoY. At 300–600 m it was ¥454,500 (+6.8%), and at 600 m–1 km ¥78,400 (+1.9%): both the level and the rate of increase drop sharply with distance from the station.
The gradient is gentler in regional areas. Even within 300 m, the price is ¥138,500 (+1.7%), and beyond 600 m prices are almost flat. As for zoning, 86.2% of properties within 300 m in the three major metros and 88.5% in regional areas sit in commercial or neighborhood commercial zones, while more than 75% of properties over 2 km away are in areas with no zoning designation.
| Distance band | 3 major metros median land price | YoY | Commercial zoning | Regional median land price | YoY | Commercial zoning |
|---|---|---|---|---|---|---|
| ≤300m | ¥1,195,000 | +10.4% | 86.2% | ¥138,500 | +1.7% | 88.5% |
| 300-600m | ¥454,500 | +6.8% | 64.6% | ¥79,100 | +0.4% | 63.8% |
| 600m-1km | ¥78,400 | +1.9% | 36.2% | ¥62,300 | 0.0% | 52.3% |
| 1-2km | ¥49,100 | 0.0% | 9.2% | ¥40,300 | 0.0% | 35.4% |
| Over 2km | ¥35,100 | −0.7% | 5.4% | ¥29,050 | +0.1% | 21.1% |
Nationally, 2026 official land prices for commercial land rose 4.3% YoY, the fifth straight year of increases, with commercial land up 9.3% in the Tokyo area and 7.3% in the Osaka area, while regional areas excluding the four major regional cities rose only 1.1% (MLIT, “2026 Official Land Prices”). The move by business hotels in the three major metros from station-front sites to the 600 m–2 km ring is consistent in direction with this rise in station-front land prices. In regional areas, by contrast, land prices are nearly flat even near stations, yet business hotels are still moving away from stations. The regional shift is more naturally explained by demand structure and land supply — demand premised on car travel and the easier availability of roadside land — than by land prices pushing supply out. The relationship between land prices and development feasibility has been worked backward in a separate analysis of 2026 official land prices and hotel development feasibility.
Implications for Investment and Development — Which Era of the Market Do Your Station-Distance Criteria Reflect?
If your site criteria include a station-distance condition such as “within a 5-minute walk of a station,” it is worth checking which era of supply that criterion assumes. In the three major metros, about 90% of business hotels opened in 2010–23 were within 600 m of a station, so a “5–8 minute walk” criterion matched the reality of that period. For 2024–26 openings, the within-600 m share fell to 83.5% and the 600 m–2 km share rose to 12.7%. With station-front land prices rising about 10% a year, adding the middle bands to the candidate list widens the options for securing sites. That estimated settled ADR in the 600 m–1 km band has risen to ¥9,000 for 2020s openings from ¥7,400 for 2010s openings is further evidence of the middle bands’ product strength.
Illustrative Case: How Much of the Rate and Occupancy Gap Can a Middle-Band Site Absorb?
For business hotels in the three major metros, we set three cases for the rate gap between within 300 m and 600 m–1 km and estimated the difference in revenue per available room (RevPAR). Estimated settled ADR within 300 m is set at ¥12,700 (roughly the same for 2010s and 2020s openings), and station-front occupancy is assumed at 80% for illustration. Middle-band rates for the base and downside cases are taken from this article’s actual figures; the upside case is an assumption.
| Case | Middle-band ADR | vs. station-front | Occupancy gap | RevPAR index | Basis |
|---|---|---|---|---|---|
| Upside | ¥10,200 | −20% | 0pt | 80 | Assumption: middle-band rate improvement continues and no occupancy gap arises |
| Base | ¥9,000 | −29% | −3pt | 68 | Actual 600m-1km figure for 2020s openings (¥9,000) + 3-point occupancy gap |
| Downside | ¥7,400 | −42% | −5pt | 55 | Actual 600m-1km figure for 2010s openings (¥7,400) + 5-point occupancy gap |
| ADR vs. station-front \ Occupancy gap | 0pt | −3pt | −5pt | −8pt | −10pt |
|---|---|---|---|---|---|
| −15% | 85 | 82 | 80 | 77 | 74 |
| −20% | 80 | 77 | 75 | 72 | 70 |
| −29% (2020s actual) | 71 | 68 | 66 | 64 | 62 |
| −35% | 65 | 63 | 61 | 59 | 57 |
| −42% (2010s level) | 58 | 56 | 55 | 52 | 51 |
Even in the base case, middle-band RevPAR holds at about 68% of station-front RevPAR. Meanwhile, the nearest land price in the same three major metros is ¥78,400/㎡ at 600 m–1 km, only about 6.6% of the within-300 m level (¥1,195,000/㎡). However, the commercial zoning share drops from 86.2% to 36.2%, and lower designated floor-area ratios mean more land is needed per room. Even if four times as much land were needed per room, land cost per room would be about 26% of the station-front level, leaving room to outweigh the revenue gap (about 32% lower in the base case). Whether a site is closer to the downside case (index 55) should be checked against the rates of nearby middle-band properties. This estimate does not include project-specific construction costs, operating costs or floor-area ratios.
Regional areas call for a different reading. The rate gap between station-front and 1–2 km sites widens with newer cohorts, reaching 35% for 2020s openings. Building away from stations overlaps with a choice to trade lower land costs for a lower rate tier. From an asset-management perspective, the location advantage of existing station-front properties has not faded; if anything, there is room to re-evaluate it precisely when compared with newer station-front properties. For collateral valuation of regional assets, it is worth assuming that even within the same “business hotel” category, rate levels split into roughly ¥7,000 and roughly ¥10,000 depending on the station-distance band.
A further implication concerns how the statistics themselves are read. Tracking the distance distribution of openings without separating property types turns the 2020s surge in whole-unit rentals into apparent “suburbanization.” City hotels, resorts and budget lodging have moved closer to stations within their own types, and as demand broadens into inbound and leisure travel, the value of stations as transport hubs is, if anything, rising. When revisiting location criteria, like-for-like comparisons by property type should be the starting point.
Notes on the analysis: Opening years are based on opening dates registered in OTA and other listing information; properties with no identifiable opening year (6,435 properties, 18.8% of the total) are excluded from the cohort analysis. Missing data are more common in bands farther from stations (13.4% within 300 m, 21.7% over 2 km) and are concentrated in budget lodging (26.7%) and ryokan (22.7%). These are likely to be older, small properties, so the over-2 km share for the 1999-or-earlier cohort may be understated. The 2026 openings are based on listings as of September, and because some properties are added to OTAs after opening, the count is expected to grow. The analysis covers properties among the roughly 168,000 in Japan tracked by MetroEngines Research that have registered coordinates and had published prices observed in June–August 2026; properties not listed on OTAs are not included. Estimated settled ADR is an estimate (median error of about 7% against REIT-disclosed results).
Summary
Tracking all openings by station distance, the over-2 km share for 2024–26 openings was 43.6%, up 12.0 points from 2015–19 openings. The main driver, however, is a change in property-type mix, with whole-unit rentals growing to 55.5% of openings; city hotels (65.1% within 300 m), resorts and budget lodging moved closer to stations within their own types. Among hotel types, business hotels were the one that moved away from stations, with their within-300 m share dropping from around 60% to 40–50% starting with 2023 openings. In the three major metros this is a move to the middle bands consistent with rising station-front land prices (+10.4%); in regional areas it is a roadside-oriented spread while land prices stay nearly flat. The same change has different causes. Station-distance criteria used for site selection and valuation should be updated on a like-for-like property-type basis, after checking which era of the market they assume.
Related Articles
References and Sources
■ Data Sources
Of the roughly 168,000 properties in Japan tracked by MetroEngines Research, 34,192 properties with registered coordinates and published prices observed in June–August 2026 (based on confirmed OTA listings, 1.50 million rooms in total). Opening year, property type and room count come from listing information; estimated settled ADR is each property’s median of monthly estimates for September 2025–August 2026. Station locations, official land prices / prefectural land price survey (2026) and zoning are from the MLIT Real Estate Information Library.
■ Calculation Assumptions
Station distance is the straight-line distance from each property’s coordinates to the nearest station (station facilities by operator and line), divided into five bands (≤300m / 300-600m / 600m-1km / 1-2km / over 2km). Opening cohorts are divided into six groups. Mix effect = change in property-type share × over-2 km share by type in the base cohort; within-type effect = property-type share in the end cohort × change in over-2 km share by type. Land price is the closest survey point within 1.5 km of each property. Tables 6 and 7 are illustrative cases assuming station-front ADR of ¥12,700 and station-front occupancy of 80%; the occupancy gaps and upside-case rate are assumed values.
■ Limitations
Properties with no identifiable opening year (18.8%) are excluded from the cohort analysis; missing data are concentrated over 2 km (21.7%), in budget lodging and in ryokan, so the over-2 km share for older cohorts may be understated. The 2026 openings are based on listings as of September. Straight-line distance is shorter than walking distance. Estimated settled ADR is an estimate (median error of about 7% against REIT-disclosed results) and reflects the last 12 months, not the rate at opening. The illustrative case does not include project-specific construction costs, operating costs or floor-area ratios.
■ Market Data
- MetroEngines Research & Consulting — property location, opening year, type and room count; estimated settled ADR (based on confirmed OTA listings, N=34,192 properties)
■ Government Statistics and Public Data
- MLIT Real Estate Information Library — station ridership (station locations), official land prices, prefectural land price survey, zoning (Japanese)
- MLIT, “2026 Official Land Prices Released” (March 18, 2026, Japanese)
- MLIT, “2026 Official Land Price Data Update — Data Published on the Real Estate Information Library and National Land Numerical Information Download Site” (Japanese)
- Japan National Tourism Organization (JNTO), “Visitor Arrivals (December 2025 Estimates)” (Japanese)
■ News and Commentary