

In hotel acquisition work, the seismic risk assessment in the engineering report and the fire insurance quotation usually sit in two different folders. The first gets read as a question about construction cost; the second gets glanced at once as a small line in the expense schedule. Yet these two documents, without a single yen of disaster-mitigation investment, quietly move both the annual P/L and the very structure of the debt from the moment the site is chosen. This article sets Capex aside entirely and breaks down how much the same hazard differential is worth to NOI and equity returns through two channels — the insurance premium paid, and the LTV a lender is willing to extend — using actual data from 10 hotel markets across Japan.
Metric Definitions Used in This Article
- ADR (average daily rate): An estimated transacted rate (tax-exclusive equivalent) derived by applying segment-specific adjustment coefficients to the lowest published plan level each property lists on OTAs (double occupancy, per-room rate, tax-inclusive). Cross-checked against property-level results disclosed by listed hotel REITs (91 properties, most recent three months), the median error is approximately 7%. These are estimates and differ from each property’s actual transacted rates and accounting figures. Area-level ADR is the median across the properties covered (the level of a typical property in that area); this article uses the 12-month average for August 2025 through July 2026.
- OCC (occupancy rate): The prefecture-level, business-hotel occupancy rate from the Japan Tourism Agency’s Overnight Travel Statistics Survey, calendar-year 2025 (preliminary). This article uses the published statistic as-is and does not apply our own estimates.
- Flood-risk zone: The flood rate classification the General Insurance Rating Organization of Japan (GIROJ) assigns by municipality within the fire insurance reference loss cost rates. Five tiers, from Zone 1 (the lowest-premium group) to Zone 5 (the highest).
- PML (probable maximum loss): A seismic risk assessment metric expressing the maximum expected physical loss as a percentage of replacement cost. The reference ground motion is that of a 475-year return period (a 10% probability of exceedance over a 50-year service life).
- Data sources: MetroEngines Research & Consulting / General Insurance Rating Organization of Japan / National Research Institute for Earth Science and Disaster Resilience (J-SHIS) / Japan Tourism Agency
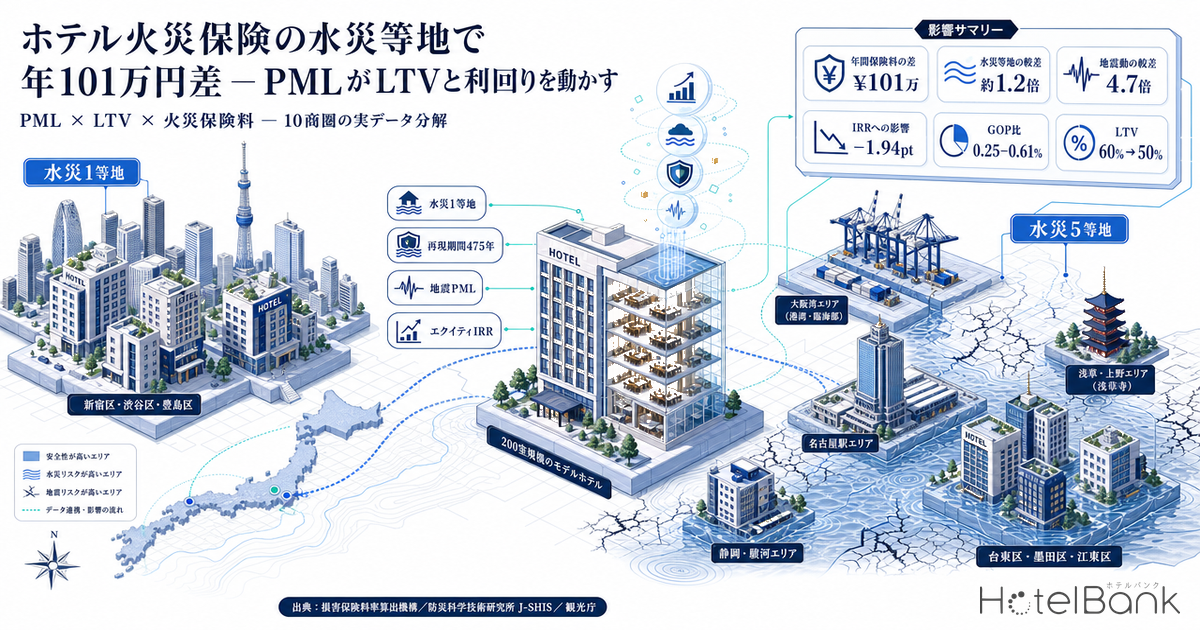
- — ¥1.01M per year — the annual premium gap between flood Zone 1 and Zone 5 for a model 200-room hotel insured for ¥4.5bn. That is 0.25–0.61% of GOP, or roughly ¥17 per room sold.
- — 1.94pt — the drop in equity IRR (6.36% → 4.42%) when PML pushes LTV from 60% to 50% and adds ¥30M a year of earthquake cover. Roughly 40 times the impact of the flood-zone premium gap (about 0.05pt).
- — The split is 0.79pt from the lower LTV and 1.15pt from the earthquake premium. At a 1.8% interest rate the LTV gap is worth 0.98pt; at 3.4% it narrows to 0.24pt.
- — Flood zone and seismic hazard are independent axes. Hakata in Fukuoka sits in flood Zone 3 yet ranks second-lowest of the 10 markets on ground motion; Nagoya Station is both Zone 5 and 141.0cm/s — high on both.
- — Of 298 listed hotel REIT properties, 17.4% sit in Zones 4–5 (14.1% by room count, 10.7% by acquisition price). About 90% of acquisition value sits in Zones 1–3.
The Conclusion — The Annual Line Item Is Small; the One-Time Condition Is Large
Start with the conclusion. Taken on its own, the flood-zone premium differential is on the order of ¥1M a year. For a model 200-room hotel insured for ¥4.5bn, the annual premium gap between flood Zone 1 and Zone 5 is about ¥1.01M. Against GOP that is 0.25–0.61%; translated into RevPAR terms it is roughly ¥17 per room sold. Look only at that figure and you want to call it a rounding error.
Send the same hazard down the second channel, however, and the order of magnitude changes. Once seismic PML exceeds a certain level, lenders require earthquake cover and cap LTV at the same time. For a representative property acquired at ¥5.0bn on NOI of ¥250M, equity IRR at 60% LTV with no earthquake cover is 6.36%. Move to 50% LTV plus ¥30M a year of earthquake premium and it falls to 4.42%. The gap is 1.94pt — roughly 40 times the effect the flood-zone premium differential has on IRR (about 0.05pt).
In other words, hazard bites less as a recurring insurance expense than as a balance-sheet constraint on financing terms. And the latter, once fixed at acquisition, stays fixed for the whole hold period. Before deciding whether to spend on resilience Capex, estimating these two channels separately sharpens acquisition due diligence. Low-risk locations hold a structural advantage on exactly this point.
The Rule Itself — Five Flood-Rate Tiers Split Premiums by Municipality
On 21 June 2023, the General Insurance Rating Organization of Japan (GIROJ) filed a revision to the fire insurance reference loss cost rates with the Commissioner of the Financial Services Agency, receiving notice of the conformity review result on 28 June of the same year. The revision had two pillars. One was a 13.0% nationwide average increase in the reference loss cost rates for comprehensive residential insurance. The other — the subject of this article — was subdividing the flood rate, previously uniform nationwide, into five tiers according to regional risk. Insurers have been rolling this into their products in stages since October 2024.
The design of the subdivision is set out in GIROJ’s published materials. The geographic unit is the municipality. There are five tiers, from Zone 1 (cheapest premium) to Zone 5 (most expensive). Relative to no subdivision at all, Zone 1 comes in about 6% below and Zone 5 about 9% above, so the most expensive area runs roughly 1.2 times the cheapest. Both figures are on total premium — fire, wind, snow and flood cover combined — and are stated after the transitional smoothing measures designed to avoid sharp increases.
The data behind the zone assignments is also public. Within flood risk, river (fluvial) flooding accounts for 56.2% of flood damage, with inland (pluvial) flooding, landslides and other causes making up the remaining 43.8%. Fluvial flooding is assessed using flood inundation hazard maps; pluvial flooding and landslides draw on flood damage statistics and topographic data. What matters in practice is a caveat GIROJ itself states explicitly: because the zones reflect total flood risk including pluvial flooding and landslides — not fluvial flooding alone — they do not necessarily align with general risk information such as flood hazard maps. A site left white on the hazard map is not guaranteed a low zone.
1. These five tiers apply to the reference loss cost rates for residential property (comprehensive residential insurance), and are not figures that transfer directly to the commercial fire insurance a hotel buys. Commercial lines are freely rated, each insurer sets its own rates, and no published rate table exists. This article uses the published reference-rate spread as a benchmark for the direction and magnitude of regional differences, and states absolute amounts explicitly as model assumptions.
2. In commercial underwriting, regional differences show up not only in premium but in coverage terms. Flood deductibles, sub-limits and coinsurance provisions all tighten as location risk rises. Comparing the premium figures on quotations alone will not surface those differences in terms.
Note that as of August 2026, GIROJ’s June 2023 filing remains the most recent published revision to the fire insurance reference loss cost rates; no subsequent filing is available on the organization’s website. This article does not incorporate figures reflecting any future revision.
Ten Markets Nationwide — Zones Split Even Within the Same City
We selected 10 markets where hotels actually cluster and looked up the flood-risk zone for each municipality in GIROJ’s flood zone search system. Alongside that, we pulled from the National Research Institute for Earth Science and Disaster Resilience (NIED) National Seismic Hazard Maps (J-SHIS), for the centre point of each market, the peak ground velocity for a 475-year return period (a 10% probability of exceedance over a 50-year service life) and the probability of experiencing JMA seismic intensity 6-lower or greater within 30 years. The former is the ground-motion input side of a PML calculation.
The results show how risky it is to talk at the level of a city. Within Tokyo’s 23 wards, Shinjuku, Shibuya and Toshima are Zone 1, while Sumida, Taito, Koto and Edogawa are Zone 5. The minimum and the maximum coexist inside the same 23 wards. Nagoya is even sharper: Nakamura Ward in front of Nagoya Station is Zone 5, while Sakae (Naka Ward), about 2km due east, is Zone 1. In Osaka, Kita Ward (Umeda) and Chuo Ward (Shinsaibashi) are both Zone 1, while the bayside wards of Minato and Konohana are Zone 3. At the granularity of “it’s Tokyo” or “it’s Nagoya,” this difference disappears.
Zone 2
Zone 3 Mid-tier
Zone 4
Zone 5 Highest-premium group
A low zone means the municipality carries relatively lower flood risk than others; flooding can occur in any zone (per GIROJ’s stated caveats).
| Tokyo — Shinjuku / Shibuya / Toshima | 1 |
| Tokyo — Chiyoda / Minato | 2 |
| Tokyo — Taito / Sumida / Koto / Edogawa | 5 |
| Osaka — Kita / Chuo | 1 |
| Osaka — Minato / Konohana | 3 |
| Nagoya — Naka Ward | 1 |
| Nagoya — Nakamura Ward | 5 |
| Kyoto Shimogyo / Sendai Aoba | 1 |
| Sapporo Chuo / Naha / Nagano | 2 |
| Fukuoka Hakata / Hiroshima Naka / Yokohama Nishi | 3 |
| Market | Flood zone | 475-yr return period peak ground velocity (cm/s) | Intensity 6-lower+ within 30 years | ADR (12-mo avg) | OCC (2025) | Supply within 1.5km |
|---|---|---|---|---|---|---|
| Tokyo — Asakusa/Ueno Taito Ward, Tokyo | 5 | 113.2 | 15.7% | ¥14,478 | 81.6% | 460 properties / 19,015 rooms |
| Tokyo — Shinjuku Shinjuku Ward, Tokyo | 1 | 90.7 | 7.8% | ¥16,132 | 81.6% | 321 properties / 26,216 rooms |
| Osaka — Minami Chuo Ward, Osaka | 1 | 72.4 | 5.2% | ¥12,776 | 83.0% | 500 properties / 39,788 rooms |
| Osaka Bay — Bentencho Minato Ward, Osaka | 3 | 100.5 | 12.8% | ¥12,880 | 83.0% | 45 properties / 1,296 rooms |
| Nagoya Station Nakamura Ward, Nagoya | 5 | 141.0 | 32.3% | ¥10,436 | 75.4% | 178 properties / 21,027 rooms |
| Nagoya — Sakae Naka Ward, Nagoya | 1 | 89.9 | 9.7% | ¥9,678 | 75.4% | 146 properties / 21,626 rooms |
| Fukuoka — Hakata Hakata Ward, Fukuoka | 3 | 47.7 | 3.5% | ¥14,273 | 77.8% | 474 properties / 30,809 rooms |
| Sendai — Aoba Aoba Ward, Sendai | 1 | 46.9 | 0.8% | ¥9,647 | 69.1% | 136 properties / 15,894 rooms |
| Shizuoka — Suruga Suruga Ward, Shizuoka | 3 | 166.0 | 44.3% | ¥7,396 | 72.7% | 63 properties / 5,046 rooms |
| Nagano City Nagano City | 2 | 35.7 | 0.8% | ¥11,096 | 75.9% | 74 properties / 4,811 rooms |
The spread on the seismic side is far wider than on flood zones. Peak ground velocity for a 475-year return period ranges from 35.7cm/s in Nagano City to 166.0cm/s in Suruga Ward, Shizuoka — a factor of about 4.7. On the probability of intensity 6-lower or greater within 30 years, Nagano City and Aoba Ward in Sendai sit at 0.8%, while Suruga Ward reaches 44.3% and Nagoya Station 32.3%. Because PML is set by “this ground motion × that building’s seismic performance,” placing an identical building of identical vintage in each location produces PMLs that differ by multiples on location alone. For an analysis pairing seismic risk with ADR and risk-adjusted yields across Pacific-coast destinations, Nankai Trough 80% Era: Pacific Coast Hotel Investment works through 10 tourist destinations.
Plotted on these two axes, the 10 markets do not line up neatly. It becomes clear that flood and earthquake are independent axes. Hakata in Fukuoka is flood Zone 3 but its ground motion of 47.7cm/s is second-lowest of the 10. Aoba in Sendai is flood Zone 1 with ground motion of 46.9cm/s — low on both. Nagoya Station, conversely, is flood Zone 5 with ground motion of 141.0cm/s, high on both. Rolling “disaster risk” into a single score erases this distinction. Since insurance quotations and financing terms are decided on separate axes, keeping them separate in due diligence matches how the work is actually done. The same hazard information can also be read as the return on resilience Capex — the trade-off between mitigation spend and payback is a distinct exercise that sits outside this article’s scope.
Channel 1: P/L — Insurance Premium Moves 0.25–0.61% of GOP
Start by counting the recurring expense. To isolate the effect of market-level conditions, building specification, insured amount and GOP margin are held identical across all markets; the only variables are that market’s ADR and OCC, and that municipality’s flood-risk zone. The model assumptions are as follows.
• 200 rooms, 6,600㎡ gross floor area (33㎡ per room), limited-service format
• Building replacement cost = 2,000 tsubo × ¥2.0M per tsubo = ¥4.0bn. The unit cost reflects 2025 hotel construction costs from MLIT’s Statistics on Building Construction Starts (all-structure average of ¥1.952M per tsubo)
• Adding ¥500M of FF&E and contents gives an insured amount (building + contents) of ¥4.5bn
• Fire insurance rate = 0.15% of the insured amount (a model assumption. Commercial property lines are freely rated with no published rate table, so absolute amounts are treated as assumptions)
• Flood-zone adjustment = ×0.94 for Zone 1, ×1.09 for Zone 5 (GIROJ published figures). Zones 2–4 are model values linearly interpolated between the endpoints; GIROJ does not publish the spread for intermediate zones
• Revenue = 200 rooms × ADR × OCC × 365 days × 1.05 (5% ancillary revenue). ADR is the estimated transacted rate (tax-exclusive equivalent)
• GOP margin 40%, informed by the 38.9% GOP achieved across the 91 managed properties disclosed by Invincible Investment Corporation (fiscal period ended December 2024)
• NOI = GOP − (7% of revenue: property and city planning taxes, FF&E reserve, AM/PM fees) − insurance premium
| Market | Zone | ADR | Annual revenue | GOP | Annual premium | Premium / GOP | Gap vs Zone 1 | NOI |
|---|---|---|---|---|---|---|---|---|
| Tokyo — Asakusa/Ueno | 5 | ¥14,478 | ¥906M | ¥362M | ¥7.36M | 2.03% | +¥1.01M | ¥291M |
| Tokyo — Shinjuku | 1 | ¥16,132 | ¥1,009M | ¥404M | ¥6.34M | 1.57% | — | ¥327M |
| Osaka — Minami | 1 | ¥12,776 | ¥813M | ¥325M | ¥6.34M | 1.95% | — | ¥262M |
| Osaka Bay — Bentencho | 3 | ¥12,880 | ¥819M | ¥328M | ¥6.75M | 2.06% | +¥0.40M | ¥264M |
| Nagoya Station | 5 | ¥10,436 | ¥603M | ¥241M | ¥7.36M | 3.05% | +¥1.01M | ¥192M |
| Nagoya — Sakae | 1 | ¥9,678 | ¥559M | ¥224M | ¥6.34M | 2.83% | — | ¥178M |
| Fukuoka — Hakata | 3 | ¥14,273 | ¥851M | ¥340M | ¥6.75M | 1.99% | +¥0.40M | ¥274M |
| Sendai — Aoba | 1 | ¥9,647 | ¥511M | ¥204M | ¥6.34M | 3.11% | — | ¥162M |
| Shizuoka — Suruga | 3 | ¥7,396 | ¥412M | ¥165M | ¥6.75M | 4.09% | +¥0.40M | ¥129M |
| Nagano City | 2 | ¥11,096 | ¥646M | ¥258M | ¥6.60M | 2.56% | +¥0.25M | ¥206M |
The annual premium gap between Zone 1 and Zone 5 is about ¥1.01M. As a share of GOP that runs from 0.25% in Shinjuku, where GOP is thick, to 0.61% in Suruga, where it is thin. Converted to RevPAR terms, at 80% occupancy across 200 rooms, that is roughly ¥17 per room sold — about ¥14 on a total-room-nights basis. Less than 0.1% of a night’s rate.
Put plainly, the result means there is no need to walk away from a location on the flood-zone premium differential alone. Two qualifications apply, however.
The first qualification. The −6% / +9% on reference rates applies to total premium across fire, wind, snow and flood cover, and includes transitional smoothing. If a commercial underwriter applies a specific regional coefficient to the flood portion alone, the gap widens. If flood accounts for 25% of premium and the coefficient runs 0.7x to 1.5x, the gap becomes ¥1.35M a year; at 0.7x to 2.0x, ¥2.19M; at 0.6x to 2.5x, ¥3.21M. That puts it in a range of 0.3–1.9% of GOP. At that point it is hard to keep calling it a rounding error.
The second qualification. In commercial lines the difference often shows up in coverage terms rather than premium. A flood deductible set at tens of millions of yen per occurrence, or a flood sub-limit capped at a fixed percentage of the insured amount, will not appear in the quoted premium. In acquisition work, the comparison to run is not premium alone but a terms table covering three items: deductible, sub-limit and coinsurance. Two policies that both say “flood cover included” can carry very different retained exposure once the property sits in Zone 5.
Read the other way, a property in Zone 1 or Zone 2 has more room to negotiate on those same terms. The advantage of a low-risk location shows up not as a few hundred thousand yen of premium but as “wider cover for the same premium.” Whether that difference in terms makes it into the NOI underwriting at acquisition is what separates practice from theory.
Channel 2: B/S — PML Moves IRR 1.9pt via Earthquake Cover and LTV
Now the second channel. PML (probable maximum loss) is the metric produced by the seismic risk assessment in an engineering report, defined as the maximum expected physical loss as a percentage of replacement cost. The reference ground motion corresponds to a 475-year return period — an event with a 10% probability of exceedance over a building’s 50-year service life. The “475-year return-period peak ground velocity” shown in the table above is precisely the input side of that PML calculation.
In practice, this number feeds straight into financing terms. A report published by the risk management arm of Sompo Japan notes that “where PML exceeds a certain level (generally around 15%), earthquake insurance is often placed.” Where cover is required, the premium eats into NOI. On top of that, lenders generally structure terms with lower LTV for properties whose collateral value can swing more widely. PML, in other words, triggers a higher premium and reduced leverage at the same time.
| Earthquake cover | LTV | Debt | Equity required | Cash-on-Cash | Equity IRR (5yr) | DSCR (interest) |
|---|---|---|---|---|---|---|
| None | 60% | ¥3.00bn | ¥2.20bn | 8.36% | 6.36% | 3.79 |
| 55% | ¥2.75bn | ¥2.45bn | 7.73% | 5.92% | 4.13 | |
| 50% | ¥2.50bn | ¥2.70bn | 7.22% | 5.57% | 4.55 | |
| 45% | ¥2.25bn | ¥2.95bn | 6.80% | 5.27% | 5.05 | |
| ¥15M per year | 60% | ¥3.00bn | ¥2.20bn | 7.68% | 5.65% | 3.56 |
| 55% | ¥2.75bn | ¥2.45bn | 7.12% | 5.29% | 3.88 | |
| 50% | ¥2.50bn | ¥2.70bn | 6.67% | 4.99% | 4.27 | |
| 45% | ¥2.25bn | ¥2.95bn | 6.29% | 4.75% | 4.75 | |
| ¥30M per year | 60% | ¥3.00bn | ¥2.20bn | 7.00% | 4.94% | 3.33 |
| 55% | ¥2.75bn | ¥2.45bn | 6.51% | 4.65% | 3.64 | |
| 50% | ¥2.50bn | ¥2.70bn | 6.11% | 4.42% | 4.00 | |
| 45% | ¥2.25bn | ¥2.95bn | 5.78% | 4.22% | 4.44 |
The reading is simple. A property with low PML that can carry 60% LTV without earthquake cover produces an equity IRR of 6.36%. The same NOI, where PML forces LTV down to 50% and requires ¥30M a year of earthquake cover, yields 4.42%. The gap is 1.94pt, and equity required rises from ¥2.20bn to ¥2.70bn — an extra ¥500M. To reach the same return, you either pay less for the asset or grow NOI.
Splitting the effect, the move from 60% to 50% LTV costs 0.79pt and the ¥30M earthquake premium a further 1.15pt. Because leverage works less hard as rates rise, this picture shifts with the rate environment. At 1.8%, the gap between 60% and 50% LTV is 0.98pt; at 3.4% it narrows to 0.24pt. The lower the rate environment, the more valuable it is to be able to take LTV — which also means that in a rising-rate environment, the relative weight of a PML-driven LTV constraint falls. On how far the rate level itself moves the feasibility of development, Policy Rate 1.00%: Break-Even ADR Across Japan’s 8 Hotel Markets runs the numbers market by market.
Set the two channels side by side and the difference in magnitude is obvious. The flood-zone gap (¥1.01M a year) moves IRR by roughly 0.05pt. The PML-driven change in terms moves it by up to 1.94pt — a difference of about 40 times. If you are allocating time in acquisition due diligence, the conclusion is to finish the flood-zone check on the insurance quotation in 30 minutes and spend the rest on PML and the design of the financing.
What should be stressed here is that this is not an argument that high-PML locations are disadvantaged. PML is not determined by location alone. For the same ground motion, structural system, design vintage, seismic grade and ground conditions move PML substantially. The practical implication runs the other way: in markets with high ground motion, a building with low PML can command relatively better financing terms. In markets such as Shizuoka or Nagoya Station, the PML level itself becomes a negotiating lever on price, and the funding premium attached to post-1981 seismic-code buildings is large. In markets with low ground motion, that scope for differentiation is small.
Sorting 298 Listed Hotel REIT Properties Into Flood Zones
How is this expense distributed across the market as a whole? We extracted the domestic properties from the portfolio master of Japan’s seven listed hotel REITs and matched each property’s municipality to GIROJ’s flood-risk zones. 298 properties and 52,106 rooms could be classified (properties with disclosed acquisition prices total approximately ¥1.80 trillion). For designated cities, the lookup was run down to the ward level.
| Flood zone | Properties | Share | Rooms | Share | Acquisition price | Share |
|---|---|---|---|---|---|---|
| Zone 1 | 65 | 21.8% | 11,971 | 23.0% | ¥470.7bn | 26.1% |
| Zone 2 | 80 | 26.8% | 14,433 | 27.7% | ¥626.2bn | 34.8% |
| Zone 3 | 101 | 33.9% | 18,365 | 35.2% | ¥512.1bn | 28.4% |
| Zone 4 | 24 | 8.1% | 3,487 | 6.7% | ¥92.7bn | 5.1% |
| Zone 5 | 28 | 9.4% | 3,850 | 7.4% | ¥99.8bn | 5.5% |
| Zones 4–5 total | 52 | 17.4% | 7,337 | 14.1% | ¥192.5bn | 10.7% |
The distribution shows a clear pattern. By property count, Zones 1–3 account for 82.5% and Zones 4–5 for 17.4%. By room count, Zones 4–5 are 14.1%; on an acquisition-price basis, just 10.7%. Zone 1 accounts for 21.8% of properties but 26.1% of acquisition value, which suggests the higher the price per property, the more likely it sits in a lower-risk zone. That is consistent with the fact that the areas where high-price central assets cluster — the upland wards of central Tokyo, Kita and Chuo in Osaka, Shimogyo in Kyoto — all fall in Zones 1–2.
Two things follow from this distribution. First, at the portfolio level, upside in premium driven by flood zone is limited. If roughly 90% of acquisition value sits in Zones 1–3, the effect of the zone differential on total NOI is small enough on the figures in the previous section. Second, and conversely, zone still matters for an individual acquisition decision. The 52 properties in Zones 4–5 exist in the market and are being operated. A high zone is not in itself a problem; the question is whether that difference has been priced into the negotiation and into the insurance programme at acquisition.
Seven Checkpoints for Reading Insurance and PML in Acquisition Due Diligence
Translated into acquisition practice, the breakdown above comes down to the following seven items. None involves a single yen of Capex, and most can be done at the desk before work begins.
Summary
Small on the P/L, but every year
The annual premium gap between flood Zone 1 and Zone 5 is about ¥1.01M for a model 200-room property — 0.25–0.61% of GOP, roughly ¥17 per room sold. A rounding error in any single year, but it recurs across the whole hold period. Where a commercial policy applies a specific coefficient to the flood portion, it can widen to ¥1.35M–¥3.21M a year.
Large on the B/S, and only once
Once PML passes a threshold, the requirement for earthquake cover and the cap on LTV arrive together. Against an IRR of 6.36% at 60% LTV with no earthquake cover, 50% LTV plus ¥30M a year of cover yields 4.42%. The 1.94pt gap is about 40 times the flood-zone premium differential.
The two axes are independent
Flood zone and ground motion correlate weakly. Hakata in Fukuoka is flood Zone 3 yet second-lowest on ground motion; Aoba in Sendai is low on both. Rather than rolling them into a single “disaster risk score,” keep the axis that sets insurance terms separate from the axis that sets financing terms.
As a line item, insurance premium stays an inconspicuous row in the P/L. Yet the same hazard information sitting behind it moves the equity cheque and the IRR substantially, through the lender’s credit decision. Check zone and PML separately before acquisition, and the two stop being overlooked expenses and become variables you can underwrite in advance. Low-risk locations hold an advantage on insurance terms; in high-ground-motion markets, buildings with low PML can differentiate on financing terms. Either way, there is room for a sharper investment decision.
Note on the calculations: All premium, NOI and IRR figures in this article are simplified calculations based on model assumptions. Commercial fire insurance and earthquake cover are freely rated, and no published rate table exists. Actual premiums and coverage terms vary substantially with the building’s structure, vintage, seismic performance and loss history, the insured percentage and deductible settings, and each insurer’s underwriting policy. The same applies to financing terms, where actual levels vary by lender, sponsor and structure. An actual investment decision requires a property-specific engineering report and a detailed feasibility study.
Related Reading
- Nankai Trough 80% Era: Pacific Coast Hotel Investment — Disaster Risk × ADR × Risk-Adjusted Yield Across 10 Destinations
- Policy Rate 1.00%: Break-Even ADR Across Japan’s 8 Hotel Markets
- 226k Hotel Rooms in 32 Regional Cities: 42.7% Built Before 1996
- Station Premium Ends at an 8-Minute Walk: 8 Stations, 1,012 Hotels
References and Sources
■ Data sources
Flood-risk zones were looked up municipality by municipality for 31 municipalities across the major hotel markets in the General Insurance Rating Organization of Japan’s “Flood Zone Search System” (searched August 2026). Ground motion was taken from the National Research Institute for Earth Science and Disaster Resilience’s J-SHIS National Seismic Hazard Maps (probabilistic seismic hazard map, 2020 edition, average case, all earthquakes), using the 475-year return-period peak ground velocity and the probability of JMA seismic intensity 6-lower or greater within 30 years at each market’s centre point. Estimated transacted ADR comes from MetroEngines Research & Consulting’s municipality-level aggregation (12-month average, August 2025 to July 2026; N=10–192 properties per market); room supply is the property and room count within a 1.5km radius of each market centre. OCC is taken directly from the Japan Tourism Agency’s Overnight Travel Statistics Survey, calendar-year 2025 (preliminary), by prefecture, business hotels; no in-house estimate is used. The flood-zone distribution for listed hotel REITs matched an ownership master built from the published portfolios of seven REITs (as of 17 August 2026; 298 domestic properties / 52,106 rooms), with designated cities identified down to the ward level.
■ Calculation assumptions
The model property has 200 rooms, 6,600㎡ gross floor area and a limited-service format. Building replacement cost of ¥4.0bn (2,000 tsubo × ¥2.0M per tsubo) plus ¥500M of FF&E and contents gives an insured amount of ¥4.5bn; the fire insurance rate is set at 0.15% of the insured amount as a model assumption. Flood-zone coefficients of ×0.94 for Zone 1 and ×1.09 for Zone 5 (GIROJ published figures) are used, with Zones 2–4 as model values linearly interpolated between the endpoints (GIROJ does not publish the spread for intermediate zones). Revenue = 200 rooms × ADR × OCC × 365 days × 1.05 (5% ancillary revenue); GOP margin 40%; NOI = GOP − 7% of revenue (property taxes and public dues, FF&E reserve, AM/PM fees) − insurance premium. The IRR sensitivity uses a representative property with NOI of ¥250M, a 5.0% cap rate, a ¥5.0bn acquisition price, 4% acquisition costs, a 2.2% interest rate, a five-year hold with interest-only payments, and exit at the same cap rate less 1.0% disposal costs. Additional earthquake cover premium is modelled at ¥0, ¥15M and ¥30M a year.
■ Limitations and caveats
The five flood-rate tiers relate to the reference loss cost rates for residential property (comprehensive residential insurance) and are not figures that apply directly to the commercial fire insurance a hotel buys. Because commercial lines are freely rated with no published rate table, this article uses the published reference-rate spread as a benchmark for the direction of regional differences, and treats absolute premium and earthquake cover amounts as model assumptions throughout. Actual premiums and coverage terms vary substantially with the building’s structure, vintage, seismic performance and loss history, the insured percentage and deductible settings, and each insurer’s underwriting policy; regional differences may surface in terms — deductible, sub-limit, coinsurance — rather than in premium. Financing terms likewise vary by lender, sponsor and structure. Because PML is determined by structural system, design vintage and ground conditions as well as by site ground motion, the ground-motion data here is intended for relative comparison between markets and does not substitute for a property-specific PML. Because zones are assessed on total flood risk including pluvial flooding and landslides, they do not necessarily align with general risk information such as flood hazard maps. An actual investment decision requires a property-specific engineering report and a detailed feasibility study.
■ Insurance framework (primary sources)
- General Insurance Rating Organization of Japan, “Notice of Revision to Fire Insurance Reference Loss Cost Rates” (filed with the Commissioner of the Financial Services Agency 21 June 2023; conformity review result received 28 June 2023)
- General Insurance Rating Organization of Japan, “(Appendix) On the Subdivision of Flood Rates” (June 2023)
- General Insurance Rating Organization of Japan, “Flood Zone Search System” (searched August 2026)
- Financial Services Agency, “Expert Panel on Fire Insurance Flood Rates”
■ Seismic risk and PML
- National Research Institute for Earth Science and Disaster Resilience, “J-SHIS Japan Seismic Hazard Information Station,” National Seismic Hazard Maps (probabilistic seismic hazard map, 2020 edition, average case, all earthquakes)
- Sompo Japan / Sompo Risk Management, “Risk Assessment in Real Estate Due Diligence,” RM Report Issue 263 (12 December 2024)
- General Insurance Rating Organization of Japan, “Seismic PML: Current State and Outlook” (Journal of Insurance Science)
- Building and Equipment Long-life Cycle Association (BELCA), commentary on the “Guidelines for Preparing Engineering Reports in Real Estate Investment and Transactions”
■ Government statistics and market data
- Japan Tourism Agency, “Overnight Travel Statistics Survey,” calendar-year 2025 (Reiwa 7) annual figures (preliminary)
- Ministry of Land, Infrastructure, Transport and Tourism, “Statistics on Building Construction Starts” (source for construction cost per tsubo)
- Ministry of Land, Infrastructure, Transport and Tourism, “Hazard Map Portal Site”
- Japan Real Estate Institute, “54th Survey on Real Estate Investor Trends” (as of April 2026) — expected yield on limited-service hotels
- Invincible Investment Corporation, portfolio disclosure (source for GOP margin)
■ Market data (in-house)
- MetroEngines Research & Consulting — estimated transacted ADR (10 markets, August 2025 to July 2026, N=10–192 properties), room supply by market (1.5km radius), listed hotel REIT ownership master (as of 17 August 2026, 298 domestic properties)