

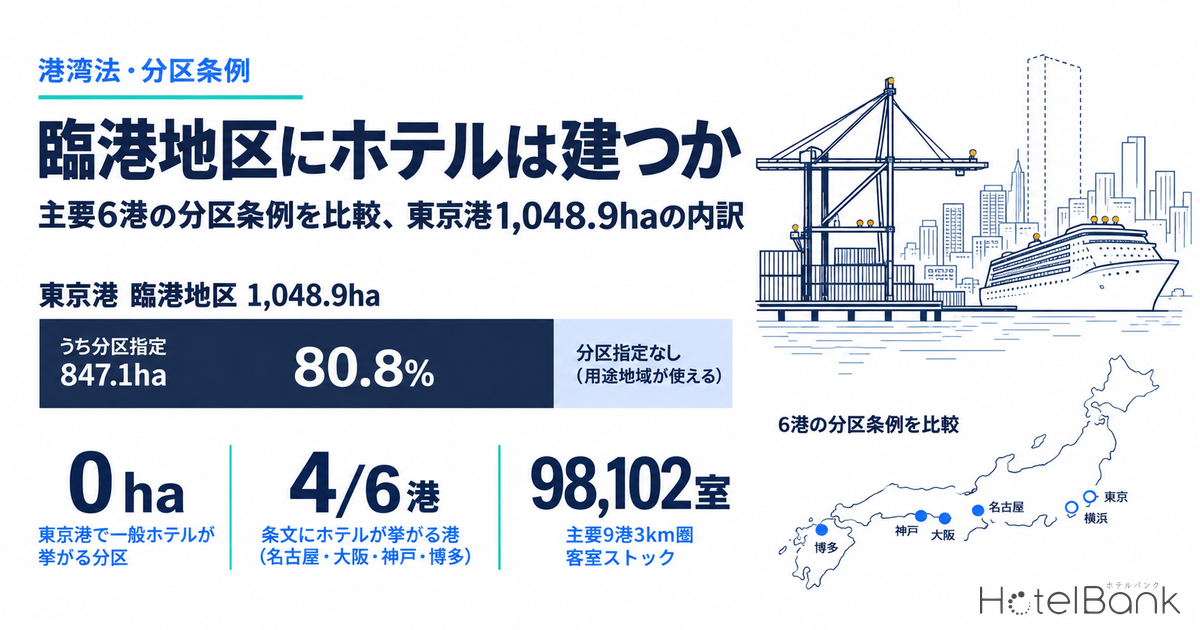
When you evaluate a site for a hotel, the first document you open is the use-district zoning map. Commercial district, neighbourhood commercial, or residential? What is the floor area ratio? Screening land against that yardstick is standard practice — but on the waterfront there is land to which that yardstick does not apply at all. These are the areas within port zones (臨港地区) under the Ports and Harbours Act where a subzone (分区) has been designated. Inside a subzone, Article 48 (use restrictions in use districts) and Article 49 (special use districts) of the Building Standards Act do not apply (Ports and Harbours Act, Article 58(1)); instead, an ordinance enacted by the port authority enumerates the structures that may be built. In other words, “it is a commercial district, so a hotel can be built” does not hold inside a port zone.
This article goes directly to the text of the subzone ordinances (the appended tables) for six ports — Tokyo, Yokohama, Nagoya, Osaka, Kobe and Hakata — and sets out, port by port, which subzones list hotels as a permitted structure. It then quantifies, using our own data, the existing room stock within a 3 km radius of the terminals of nine major ports, the estimated transacted ADR in port cities, and the depth of employment and residential population in the hinterland behind each port. Our earlier port-related work (Record 3,117 Cruise Calls: Hotel Capacity at Japan’s Top 10 Ports and Hotel Pricing on Cruise Port Days) analysed the demand side; the port zone as a regulatory layer had not been covered. And whereas our regulatory series — use districts and floor area ratio, scenic districts, soil contamination, buried cultural properties, parking-space obligations and location optimisation plans — has discussed individual regulations sitting on the common foundation of use-district zoning, this article deals with the one domain where that foundation itself is replaced.
Metric Definitions Used in This Article
- ADR (average daily rate): an estimated transacted rate (tax-exclusive equivalent) calculated by applying a segment-specific adjustment coefficient to the lowest publicly listed plan rate on OTA sites (two guests per room, per-room rate, tax-inclusive) for each property. Cross-checked against property-level results disclosed by listed hotel REITs (91 properties, most recent three months), the median error is approximately 7%. These are estimates and differ from each property’s actual transacted rates and accounting figures. Area-level ADR is the median across the properties covered (the level of a typical property in that area).
- Room stock: the total number of guest rooms at lodging properties located within a 3 km radius of each port’s terminal point. Registered room counts from our property master are used, and only properties with a registered room count are included in the total.
- Data sources: MetroEngines Research & Consulting; Ministry of Land, Infrastructure, Transport and Tourism (Real Estate Information Library, National Land Numerical Information); Ministry of Internal Affairs and Communications / Ministry of Economy, Trade and Industry (Economic Census); ordinances of each port authority
- — All six ports treat hotels differently — even where the subzone carries the same name, “Commercial Port Subzone,” Tokyo and Yokohama go only as far as rest-and-lodging facilities for port workers, while Kobe and Hakata permit hotels with no user restriction. You cannot infer anything from the subzone name.
- — Of Tokyo Port’s 1,048.9 ha, the zoning yardstick works on only 201.8 ha (19.2%) — the remaining 847.1 ha carries a subzone designation, and Articles 48 and 49 of the Building Standards Act do not apply there.
- — Hotels appear in the ordinance text at 4 of the 6 ports — Nagoya and Osaka in the Landscape & Amenity Subzone, Kobe in the Commercial Port Subzone, and Hakata through an area-designation clause within the Commercial Port Subzone. The words “inn or hotel” do not appear in the Tokyo or Yokohama texts.
- — Room stock within 3 km of the nine major ports totals 98,102 rooms (N=1,177 properties) — a 69.9-fold gap between Hakata’s 43,727 rooms and Nagoya’s 626, matching the office-sector share of the hinterland (39.6% at Aomi down to 4.7% at Garden Pier).
- — Estimated transacted ADR spans roughly ¥7,600 to ¥17,500, a 2.3-fold range — from ¥17,500 in Minato City, Tokyo down to ¥7,600 in Shimizu Ward, Shizuoka. In our illustrative case, annual room revenue swings about 1.8-fold between the optimistic and pessimistic scenarios.
Conclusion — the same “Commercial Port Subzone” treats hotels differently at all six ports
The conclusion first. Article 39(1) of the Ports and Harbours Act defines nine types of subzone — Commercial Port, Special Cargo, Industrial Port, Rail Ferry, Fishing Port, Bunkering, Hazardous Cargo, Marina, and Landscape & Amenity — but which structures are permitted in which subzone is left to each port authority’s ordinance, so subzones bearing the same name differ in substance from port to port. Comparing the text at the six ports, the treatment of inns and hotels divides as follows.
Nagoya Port and Osaka Port list “inns and hotels” in the Landscape & Amenity Subzone with no restriction on who may use them. Kobe Port does the opposite: it permits “inns and hotels used exclusively for lodging” in the Commercial Port Subzone rather than the Landscape & Amenity Subzone (excluding port-related land, and subject to mayoral designation). Hakata Port’s Commercial Port Subzone text carries an area-designation clause: “within areas designated by the Mayor… hotels, shops, restaurants and other convenience facilities designated by the Mayor that do not significantly impede the purpose of the Commercial Port Subzone.” Tokyo Port and Yokohama Port, by contrast, go only as far as “rest-and-lodging facilities for workers” in both their Commercial Port and Industrial Port Subzones; the words “inn or hotel” do not appear in the text (Yokohama has “inns and hotels serving the convenience of port-related parties” in the Marina Subzone only).
Waterfront lodging supply is therefore determined not by “does it have a sea view” but by a three-step question: is the site inside a port zone; is a subzone designated; and does the appended table of that subzone’s ordinance list inns and hotels? What follows sets out the legal structure, the port-by-port matrix, and then the quantitative picture from our own data.
The legal structure — Articles 38, 39 and 40 of the Ports and Harbours Act, and the exemption under Article 58(1)
A port zone is one category of the area and district classifications under Article 8 of the City Planning Act, and refers either to a district established under the City Planning Act or to a district established by the port authority under Article 38 of the Ports and Harbours Act (Ports and Harbours Act, Article 2(4)). Designation as a port zone alone does not change use regulation. Within an urbanisation promotion area, use districts continue to be designated as well.
The change occurs when a subzone is designated. Under Article 39(1) of the Ports and Harbours Act, a port authority may designate nine types of subzone, and under Article 40(1) it may enact an ordinance prohibiting the construction of “buildings and other structures that significantly impede the purpose of each subzone.” In practice, these ordinances are drafted as a whitelist: everything other than the structures set out in the appended table is prohibited. Nagoya Port Ordinance Article 3, Osaka Port Ordinance Article 3, Yokohama Port Ordinance Article 3 and Tokyo Metropolitan Ordinance Article 3 all share this structure. Uses not enumerated cannot, as a rule, be built.
And within a designated subzone, Articles 48 and 49 of the Building Standards Act do not apply (Ports and Harbours Act, Article 58(1)). The Tokyo Metropolitan Bureau of Port and Harbor states this explicitly in its published material: “In a port zone where a subzone has been designated, the provisions of Article 48 (use districts, etc.) and Article 49 (special use districts) of the Building Standards Act do not apply (Ports and Harbours Act, Article 58(1)).” However, the Building Standards Act provisions on floor area ratio, building coverage ratio and the like continue to apply inside a subzone in accordance with the use district (Urban Research Center, Organization for Promotion of Urban Development, “On the Regulation of Structures in Port Zones”). It is an asymmetric structure: only the yardstick for use is swapped out, while the yardstick for volume remains. In waterfront districts, an airport obstacle limitation surface can also overlap that volume side, in which case a height cap feeds directly into achievable room count and per-room land cost.
Port-by-port matrix — how inns and hotels are written into the six ordinances
We checked the text of all six ordinances and organised how inns, hotels, lodging facilities and workers’ rest-and-lodging facilities are described in each subzone’s appended table. “A” marks a subzone where inns and hotels are listed with no restriction on users; “B” marks a subzone where inns and hotels are listed but with a restriction on who may use them (port-related parties, those engaged in the business, users of recreational vessels, and so on); “R” marks a subzone listing only rest-and-lodging facilities (lodging for workers and port labourers); “—” marks a subzone with no lodging-related entry; and a blank cell means that subzone is not designated at that port.
| Subzone | Tokyo | Yokohama | Nagoya | Osaka | Kobe | Hakata |
|---|---|---|---|---|---|---|
| Commercial Port | R | R | B | B | A | A |
| Special Cargo | R | — | — | — | ||
| Industrial Port | R | R | — | R | R | — |
| Fishing Port | R | |||||
| Hazardous Cargo | — | — | — | — | ||
| Marina | B | B | B | — | B | |
| Landscape & Amenity | — | R | A | A | — | R |
| Subzones designated | 7 | 4 | 5 | 6 | 4 | 6 |
A = inns and hotels listed with no user restriction / B = listed with a restriction on users / R = rest-and-lodging facilities only / — = no lodging-related entry / blank = subzone not designated. Sources: Tokyo Metropolitan Ordinance on Structures in Subzones of Port Zones (Ordinance No. 37 of 1966); Yokohama Port Ordinance on the Regulation of Structures in Subzones of the Port Zone (Ordinance No. 34 of 1965); Nagoya Port Ordinance on the Regulation of Structures in Subzones of the Port Zone (Ordinance No. 9 of 1965); Osaka Port Ordinance on the Regulation of Structures in Subzones of the Port Zone (Ordinance No. 32 of 1965); Kobe Port Ordinance on the Regulation of Structures in Subzones of the Port Zone (Ordinance No. 28 of 1993); Hakata Port Ordinance on the Regulation of Structures in Subzones of the Port Zone (Ordinance No. 37 of 1962). Compiled by MetroEngines Research & Consulting
Setting the actual wording side by side makes the difference in the strength of the qualifiers clear. Nagoya Port’s Commercial Port Subzone (Appended Table 1, item 9) reads “inns and hotels for port-related parties (excluding those used for the business defined in Article 2(6)(iv) of the Act on Control and Improvement of Amusement Business, etc.),” narrowing the users to port-related parties. At the same port, the Landscape & Amenity Subzone (Appended Table 5, item 3) reads “inns and hotels, shops, restaurants and other convenience facilities designated by the administrator,” with the qualifier removed. Osaka Port follows the same pattern: its Commercial Port Subzone (Appended Table, Commercial Port (11)) reads “inns and hotels serving the convenience of those engaged in the business referred to in item 2,” while the Landscape & Amenity Subzone (item (4)) reads “inns and hotels, public bathhouses, clinics, retail shops…” with no restriction.
Kobe Port stands in contrast to these two. In the use-restriction table published by the city, “inns and hotels used exclusively for lodging (including those with restaurants and other convenience facilities for guests)” is marked permitted in the Commercial Port Subzone and not permitted in the Industrial Port, Marina or Landscape & Amenity Subzones. The public notice giving effect to “inns, hotels, shops, restaurants and other convenience facilities designated by the Mayor” in Appended Table 1, item 8 of the ordinance limits the scope to “areas within the district excluding port-related land.” At Kobe Port, the design is that the portion of the Commercial Port Subzone other than port-related land — exchange and amenity land and the like — serves as the receptacle for lodging supply.
Hakata Port shows the most recent movement of the six. Appended Table 1 (10) of its Commercial Port Subzone reads “within areas designated by the Mayor, exhibition facilities and conference facilities, together with hotels, shops, restaurants and other convenience facilities designated by the Mayor that do not significantly impede the purpose of the Commercial Port Subzone” — a two-tier construction layering a further area designation inside the subzone. In addition, its Landscape & Amenity Subzone (Appended Table 6) was newly created by Ordinance No. 3 of 2024, and the current text goes only as far as rest-and-lodging facilities, shops and restaurants. At ports where the subzone design itself keeps being updated, it is worth going back through the ordinance amendment history.
Tokyo Port and Yokohama Port position lodging, in the text, as welfare provision for port workers. Tokyo Port’s Commercial Port Subzone (Appended Table 1, item 11) reads “rest-and-lodging facilities, clinics and other welfare facilities designated by the Governor, for workers in the Commercial Port Subzone,” and the Special Cargo, Industrial Port and Fishing Port Subzones carry the same wording. Only the Marina Subzone (Appended Table 6, item 3) lists “lodging facilities and meeting halls for users of yachts and similar vessels.” At Yokohama Port likewise, the Commercial Port Subzone (Appended Table 1, paragraph 9) reads “rest-and-lodging facilities, clinics and other welfare facilities for port-related parties,” and the words “inn and hotel” appear only in the Marina Subzone (Appended Table 3, paragraph 4). This may seem to contradict the concentration of lodging properties on both ports’ waterfronts — the answer lies in the area breakdown in the next section.
Breaking down Tokyo Port’s 1,048.9 ha — zoning is usable on only 201.8 ha (19.2%)
According to the history of designated port zone area published by the Tokyo Metropolitan Bureau of Port and Harbor, Tokyo Port’s port zone was first designated at 234.4 ha in February 1966 and, through repeated designations and revocations in step with port plan revisions, now stands at approximately 1,048.9 ha. The breakdown by subzone is as follows.
Source: prepared by MetroEngines Research & Consulting from Tokyo Metropolitan Bureau of Port and Harbor, “The Port Zone of Tokyo Port”
The largest is the Commercial Port Subzone at 630.7 ha (60.1% of the total), accounting for six-tenths of Tokyo Port’s port zone. Under the ordinance, this is an area that goes only as far as rest-and-lodging facilities for workers, not inns and hotels. Next come the Special Cargo Subzone at 111.8 ha, the Industrial Port Subzone at 40.7 ha, the Fishing Port Subzone at 22.6 ha and the Hazardous Cargo Subzone at 6.3 ha; the only subzone with a lodging-related entry is the Marina Subzone at 9.7 ha (lodging facilities for users of yachts and similar vessels). The Landscape & Amenity Subzone covers 25.3 ha, but Appended Table 7 of the Tokyo Metropolitan ordinance lists only “restaurants, kiosks and other convenience facilities that the Governor recognises as necessary and designates in the Landscape & Amenity Subzone” — lodging facilities are not enumerated.
What deserves attention is the 201.8 ha (19.2%) with no subzone designation. In areas inside a port zone where no subzone has been designated, Articles 48 and 49 of the Building Standards Act remain in force, so the site can be judged on the use-district yardstick as normal. This 201.8 ha has accumulated in stages since 1996, and the record shows in particular that 138.8 ha was transferred out of the Commercial Port Subzone in December 1999. Much of the land on which lodging supply has been realised in Tokyo’s waterfront area is either in this “no subzone designation” category or outside the port zone altogether. The first thing to check when looking for a waterfront site is the subzone map, and areas with no subzone designation stand out as scarce waterfront land where the use-district yardstick still works directly.
For a sense of scale, the largest port zone area in Japan belongs to Nagoya Port at approximately 4,200 ha (per the Urban Research Center, Organization for Promotion of Urban Development, and the Japan Port and Harbour Association’s “Ports and Harbours in Figures”). That is roughly four times Tokyo Port’s land area operating under a yardstick separate from use-district zoning. According to the Ports and Harbours Bureau of the Ministry of Land, Infrastructure, Transport and Tourism, as of 1 April 2025 there were 993 ports (5 international strategic ports, 18 international hub ports, 102 major ports, 807 local ports and 61 ports under Article 56 of the Ports and Harbours Act), and a subzone ordinance exists for each port authority.
Room stock within 3 km of nine major ports — a 69.9-fold gap between Hakata’s 43,727 and Nagoya’s 626
To connect the regulatory picture to conditions on the ground, we aggregated the lodging properties located within a 3 km radius of the representative terminal point of nine major ports. The nine points are Tokyo Port (Tokyo International Cruise Terminal), Yokohama Port (Osanbashi International Passenger Terminal), Nagoya Port (Garden Pier), Osaka Port (Tempozan Passenger Terminal), Kobe Port (Kobe Port Terminal), Hakata Port (Hakata Port International Terminal), Kitakyushu Port (Moji Port), Shimizu Port (Hinode Wharf) and Sakai Port (Takeuchi South District Terminal).
Source: MetroEngines Research & Consulting (property master; N=1,177 properties, of which 1,117 have a registered room count)
Across the nine ports the total is 1,177 properties and 98,102 rooms. The largest is Hakata Port with 653 properties and 43,727 rooms — a 69.9-fold gap in room count against the smallest, Nagoya Port (13 properties, 626 rooms). This gap stems not from the size of the port but from the character of its hinterland. Hakata Port International Terminal sits close enough for Hakata Station and the Nakasu-Tenjin commercial core to fall inside the 3 km radius, so the total picks up a large volume of downtown business hotels rather than properties on port land. Yokohama Port’s 221 properties and 22,760 rooms are likewise a figure that includes the Kannai and Minato Mirai urban districts.
By contrast, the 3 km radius around Nagoya Port’s Garden Pier holds just 626 rooms. That is consistent with Nagoya Port having Japan’s largest port zone at roughly 4,200 ha, most of which is operated as Commercial Port, Industrial Port and Special Cargo Subzones. Osaka Port Tempozan’s 51 properties and 7,353 rooms owe much to the large hotel cluster on the Universal City side, which sits in Konohana Ward outside the port zone.
Circle size indicates room count within 3 km. Source: MetroEngines Research & Consulting (map)
Depth of the hinterland — office-sector share runs from 39.6% at Aomi to 4.7% at Garden Pier
Whether lodging supply works is not decided by regulation alone. We checked, against public statistics, how much business demand and resident population sits behind each port. For a 1.5 km radius around each terminal point, we aggregated establishment counts, employee counts and office-sector share from the Economic Census, together with the 250 m mesh future population projections from National Land Numerical Information.
| Port / point (1.5 km radius) | Establishments | Employees | Office-sector share | Resident population (2025 projection) |
Population change to 2040 |
|---|---|---|---|---|---|
| Tokyo Port — Aomi | 797 | 24,958 | 39.6% | 3,281 | +35.3% |
| Yokohama Port — Osanbashi | 8,886 | 173,315 | 31.0% | 25,999 | +4.7% |
| Nagoya Port — Garden Pier | 799 | 11,342 | 4.7% | 12,729 | -20.5% |
| Osaka Port — Tempozan | 1,084 | 21,583 | 5.5% | 13,779 | -19.7% |
| Kobe Port — Port Terminal | 1,038 | 20,272 | 8.7% | 14,445 | +1.8% |
| Hakata Port — Chuo Wharf | 4,387 | 67,532 | 21.0% | 45,347 | +4.5% |
Sources: Ministry of Internal Affairs and Communications / Ministry of Economy, Trade and Industry, “Economic Census” (establishments, employees, office-sector share); Ministry of Land, Infrastructure, Transport and Tourism, National Land Numerical Information, “250 m Mesh Future Population Projections” (resident population, change to 2040). Compiled by MetroEngines Research & Consulting. Resident population is a projection on a national census basis and does not represent daytime or transient population.
Source: prepared by MetroEngines Research & Consulting from the Economic Census (circle size indicates room count within 3 km)
Office-sector share is led by Tokyo Port’s Aomi at 39.6%, followed by Yokohama Port at 31.0% and Hakata Port at 21.0%, with a clear step down to Nagoya Port at 4.7%, Osaka Port at 5.5% and Kobe Port at 8.7%. The ports with a high office-sector share are all districts where the waterfront has been developed into business use, and their 3 km room stock is correspondingly deep. Conversely, the three ports with single-digit shares have hinterlands made up of logistics and industrial uses — which matches their subzone composition as well (centred on Commercial Port, Industrial Port and Special Cargo Subzones).
The population outlook also divides by port. Tokyo Port’s Aomi is projected to grow 35.3% from 3,281 residents in 2025 to 2040, a figure that reflects housing supply in the waterfront sub-centre, albeit off a small base. Yokohama Port at +4.7%, Hakata Port at +4.5% and Kobe Port at +1.8% show slight increases, while Nagoya Port at -20.5% and Osaka Port at -19.7% decline. At ports facing a projected fall in surrounding population, the condition for lodging supply to work is how to capture transient, leisure and business-travel demand rather than local demand.
Estimated transacted ADR in port cities — ¥17,500 around Tokyo Port, ¥7,600 around Shimizu Port
As material for working back to the ADR level at which waterfront lodging works, we compiled the estimated transacted ADR of the wards and cities where the port terminals are located. These are averages over the 13 months from August 2025 to August 2026. Wards and cities with fewer than ten properties in the sample are not shown.
Source: MetroEngines Research & Consulting (13-month average, August 2025 to August 2026; figures are the median across properties in each ward or city; only wards and cities with N=10 or more properties are shown)
The highest is Minato City, Tokyo, where the Tokyo Port terminal is located, at approximately ¥17,500 (N=131 properties). It is followed by Hakata Ward, Fukuoka (Hakata Port) at around ¥14,200 (N=146), Minato Ward, Osaka (Osaka Port) at around ¥12,800 (N=10), Chuo Ward, Kobe (Kobe Port) at around ¥12,200 (N=64), Naka Ward, Yokohama (Yokohama Port) at around ¥11,700 (N=51) and Shimizu Ward, Shizuoka (Shimizu Port) at around ¥7,600 (N=18). Top to bottom, the spread is about 2.3-fold.
These levels serve as a realistic anchor for investment decisions on waterfront lodging. Port land can be assembled at scale, but its use is constrained by the subzone ordinance, and construction costs have continued to rise in recent years. On an industry benchmark derived from the Ministry of Land, Infrastructure, Transport and Tourism’s construction starts statistics, hotel construction cost stood at an all-structures average of ¥1.95 million per tsubo (approximately 3.3 m²) as of 2024. To make a new development work in a port city where estimated transacted ADR is around ¥12,000, the premise has to be either an advantage in land acquisition cost or a layering of revenue sources through the mixed uses the subzone ordinance permits (integrated development with exhibition facilities, conference facilities and convenience facilities). That the texts of Nagoya, Osaka and Hakata all list hotels in the same item as “exhibition facilities and conference facilities” and “convenience facilities” can be read as a sign that the port authorities themselves anticipate this mixed-use structure.
The waterfront planning pipeline — 1,565 rooms concentrated in 2027
From planning data on a building confirmation application basis, we extracted hotel projects that fall into port or waterfront locations. These are eight projects sited on waterfront or redevelopment land in port cities.
Source: prepared by MetroEngines Research & Consulting from the Ministry of Land, Infrastructure, Transport and Tourism, “Building Dynamics Statistics Survey” (N=8 projects)
| Scheduled completion | Location | Rooms | Floors | Principal uses |
|---|---|---|---|---|
| April 2025 | Higashikaigan-cho, Atami, Shizuoka | 277 | 18 | Hotel |
| December 2025 | Arukaporto, Shimonoseki, Yamaguchi | 190 | 12 | Hotel |
| March 2026 | Minato Mirai 6-chome, Nishi Ward, Yokohama, Kanagawa | 338 | 14 | Hotel, pool, spa, aquarium, restaurants, condominiums, wedding venue |
| April 2026 | Minatocho 1-chome and others, Naka Ward, Yokohama, Kanagawa | 280 | 33 | Offices, university, hotel, retail, live-viewing arena and others |
| May 2027 | Kitanakadori 6-chome and others, Naka Ward, Yokohama, Kanagawa | 272 | 40 | Apartments, hotel, parking |
| July 2027 | Onogaradori, Chuo Ward, Kobe, Hyogo | 223 | 12 | Hotel |
| December 2027 | Kumoidori 5-chome, Chuo Ward, Kobe, Hyogo | 70 | 32 | Hotel, offices, retail, tourism functions, bus terminal, library |
| December 2027 | Hibino 1-chome, Mihama Ward, Chiba, Chiba | 1,000 | 23 | Hotel, cinema, restaurants, bathing facility |
Source: prepared by MetroEngines Research & Consulting from the Ministry of Land, Infrastructure, Transport and Tourism, “Building Dynamics Statistics Survey”
By year, the count runs 467 rooms in 2025, 618 in 2026 and 1,565 in 2027, with weight falling in the later years. It would be wrong, however, to read that skew as “supply concentrates in 2027 and dries up from 2028.” Building confirmation applications are normally filed one to two years before opening, so counts for future years are structurally undercounted. The figures shown here are a lower bound on the confirmed pipeline for which applications can be identified at this point, and are expected to rise as further applications are filed.
Looking at individual projects, Shimonoseki’s Arukaporto district (190 rooms, 12 floors) is instructive as a case of lodging raised on waterfront land inside a port zone, and Hibino, Mihama Ward, Chiba (1,000 rooms, 23 floors, combining hotel, cinema, restaurants and a bathing facility) as a large-scale project bundling mixed uses on bayside redevelopment land. Kumoidori 5-chome, Chuo Ward, Kobe (70 rooms, 32 floors) stacks hotel, office, retail, tourism functions, a bus terminal and a library into a single building — a composition well aligned with the design thinking of port land, where ordinances list convenience facilities and shared-use facilities side by side.
The viability range for waterfront lodging — two-axis sensitivity on ADR and full-year OCC
The estimated transacted ADR figures above are measured values, but what an investment decision needs is whether lodging works at that level. This section takes the estimated transacted ADR range of the six wards and cities shown above (Shimizu Ward at roughly ¥7,600 up to Minato City at roughly ¥17,500) as the input range and, as an illustrative case assuming 200 rooms operating 365 days a year, shows the swing in RevPAR across two axes: ADR and full-year OCC. The OCC here is not a measured value but a full-year assumption, and the figures are derived by the arithmetic of RevPAR = ADR × full-year OCC alone. Costs, NOI and yield are outside the scope of this article.
| Full-year OCC 65% | Full-year OCC 70% | Full-year OCC 75% | Full-year OCC 80% | Full-year OCC 85% | |
|---|---|---|---|---|---|
| ADR ¥7,600 | ¥4,940 | ¥5,320 | ¥5,700 | ¥6,080 | ¥6,460 |
| ADR ¥10,000 | ¥6,500 | ¥7,000 | ¥7,500 | ¥8,000 | ¥8,500 |
| ADR ¥12,000 | ¥7,800 | ¥8,400 | ¥9,000 | ¥9,600 | ¥10,200 |
| ADR ¥14,500 | ¥9,425 | ¥10,150 | ¥10,875 | ¥11,600 | ¥12,325 |
| ADR ¥17,500 | ¥11,375 | ¥12,250 | ¥13,125 | ¥14,000 | ¥14,875 |
The ADR axis is the measured range of estimated transacted ADR in this article (13-month average, August 2025 to August 2026); the full-year OCC axis is an assumption for the illustrative case. Source: MetroEngines Research & Consulting
Organised into three cases, the picture is as follows. The base case corresponds to the “port city with estimated transacted ADR of around ¥12,000” described in this article.
| Case | ADR | Occupancy assumption | RevPAR | Annual room revenue |
|---|---|---|---|---|
| Pessimistic | ¥9,600 | Full-year OCC 68% | ¥6,528 | ¥477 million |
| Base | ¥12,000 | Full-year OCC 75% | ¥9,000 | ¥657 million |
| Optimistic | ¥14,400 | Full-year OCC 82% | ¥11,808 | ¥862 million |
Illustrative case. ADR is within the measured range in this article; full-year OCC is an assumption. Room revenue = RevPAR × 200 rooms × 365 days. Source: MetroEngines Research & Consulting
Between the optimistic and pessimistic cases, annual room revenue differs by roughly 1.8-fold. On a waterfront where the subzone ordinance narrows permitted uses, competing supply is thin and the upside occupancy is there to be taken — but there is little room to convert the asset to an alternative use, so the exit in a downside scenario is limited. That downside resilience means something different in Type A (no subzone designation) than it does in Types B and C (subzones whose ordinance lists hotels), which are set out next. These are assumptions for an illustrative case and are not a substitute for the business plan of an individual project.
How to find waterfront sites — three types where lodging can work
Translating the ordinance text and the numbers above into the practice of site acquisition and collateral valuation, the port zones where lodging can work fall into three types.
Articles 48 and 49 of the Building Standards Act apply, so the use-district yardstick works as normal. At Tokyo Port, 201.8 ha (19.2%) of the 1,048.9 ha falls into this category. Because it can be run through the standard development process, this is the first category to pin down in initial screening.
The Landscape & Amenity Subzone at Nagoya and Osaka, and the Commercial Port Subzone (excluding port-related land) at Kobe. Lodging aimed at general guests is contemplated in the text. It is enumerated alongside libraries, museums, exhibition facilities and observation facilities, which suits integrated development with visitor-attracting mixed uses.
The “within areas designated by the Mayor… hotels” framework in Hakata Port’s Commercial Port Subzone. A two-tier construction layering a further area designation inside the subzone, letting the port authority create a receptacle for lodging as a matter of policy. The starting point is to confirm with the port authority whether an area designation exists.
From a developer’s perspective, Type A involves the fewest steps, while Types B and C presuppose consultation with the port authority but secure a waterfront location that cannot be substituted. From the perspective of funds and regional banks, when acquiring or valuing an existing property it pays to confirm which subzone and which item of the ordinance the building was built under, since that reveals both the scope for future change of use and the risk. Article 40(1) of the Ports and Harbours Act also prohibits turning a structure into a prohibited one through reconstruction or change of use — so if, for example, lodging permitted under a port-related-parties qualifier were converted to serve general guests, its footing in the ordinance text would become an issue.
Subzone designations are also not fixed. As the history of Tokyo Port’s designated area shows, transfers from the Commercial Port Subzone to no-subzone status, and changes between subzones, have been made repeatedly in step with port plan revisions. The same applies to Hakata Port’s Landscape & Amenity Subzone, newly created in 2024. The port plan revision cycle is also the moment at which the potential of waterfront land changes. There is real value in following the deliberation materials for long-term visions and port plans on an ongoing basis.
Finally, the severity of the regulation is, seen the other way round, scarcity of supply. The 626 rooms within 3 km of Nagoya Port’s Garden Pier and the 7,353 rooms within 3 km of Osaka Port’s Tempozan are an extremely thin supply environment compared with central urban areas. Precisely because a different yardstick for use raises the barrier to entry, the competitive environment for anyone who does secure a qualifying site is limited. Public waterfront land continues to move on the institutional side as well — the fishing-port facility utilisation scheme, for instance, now allows leases of fishing-port land for up to 30 years. How much public land actually reaches the market in the first place is a separate question of primary supply, and port zones need to be read within that context.
⚠ On assessing an individual site: the extent of subzone designation and the content of subzone ordinances differ by port authority, and even subzones with the same name permit different structures from port to port. The appended tables also contain many delegating provisions of the form “as designated by the administrator (Governor or Mayor),” so what is actually permitted is determined by public notices, guidelines and operational criteria. This article is a compilation based on the ordinance texts published as of September 2026, and for an individual site you must always confirm with the relevant port authority. In addition, floor area ratio and building coverage ratio apply in accordance with the use district even inside a subzone.
Summary
Subzones in port zones are a mechanism that locally replaces the nationally common yardstick of use-district zoning. The names of the nine types defined in Article 39 of the Ports and Harbours Act are shared, but the substance is set by each port authority’s ordinance — so even within the same “Commercial Port Subzone,” Tokyo and Yokohama go only as far as rest-and-lodging facilities for workers, Nagoya and Osaka permit inns and hotels with a user restriction, and Kobe and Hakata permit hotels without one. All six ports differ. Conversely, the “Landscape & Amenity Subzone” serves as the receptacle for lodging at Nagoya and Osaka, while at Tokyo, Yokohama, Kobe and Hakata it either has no lodging entry or goes only as far as rest-and-lodging facilities. Inference from the subzone name does not hold.
On the quantitative side, of Tokyo Port’s 1,048.9 ha port zone, only the 201.8 ha (19.2%) with no subzone designation can be judged on the use-district yardstick as normal. Room stock within 3 km of the nine major port terminals totals 98,102 rooms (N=1,177 properties), but the breakdown runs from 43,727 rooms at Hakata Port to 626 at Nagoya Port — a 69.9-fold gap that corresponds closely to the character of the hinterland as shown by office-sector share (39.6% at Aomi down to 4.7% at Garden Pier). Estimated transacted ADR spans roughly 2.3-fold, from about ¥17,500 in Minato City, Tokyo to about ¥7,600 in Shimizu Ward, Shizuoka.
Initial screening of a waterfront site starts not with the use-district map but with the subzone map. Hold on to the three entry points — areas with no subzone designation, subzones whose ordinance lists hotels without restriction, and the flexible clause by area designation — and you can search for an irreplaceable waterfront location together with the regulatory grounds on which it stands.
Related reading
References and sources
■ Laws and ordinances (primary sources)
- Ports and Harbours Act (Act No. 218 of 1950), Articles 2, 38, 39, 40, 40-2, 41 and 58
- Building Standards Act (Act No. 201 of 1950), Articles 48 and 49
- Tokyo Metropolitan Ordinance on Structures in Subzones of Port Zones (Ordinance No. 37 of 31 March 1966)
- Ordinance on the Regulation of Structures in Subzones of the Yokohama Port Zone (Ordinance No. 34 of 31 July 1965)
- Ordinance on the Regulation of Structures in Subzones of the Nagoya Port Zone (Ordinance No. 9 of 27 November 1965) / Nagoya Port Authority, “Table of Structure Regulations”
- Ordinance on the Regulation of Structures in Subzones of the Osaka Port Zone (Ordinance No. 32 of 1 April 1965, amended 5 October 2016) / City of Osaka, “Port zone regulation, town-planning guidelines and other waterfront regulations”
- Ordinance on the Regulation of Structures in Subzones of the Kobe Port Zone (Ordinance No. 28 of 5 October 1993) / City of Kobe, “On the regulation of structures in the Kobe Port Zone”
- Ordinance on the Regulation of Structures in Subzones of the Hakata Port Zone (Ordinance No. 37 of 9 August 1962, amended 26 February 2024)
■ Public materials and statistics
- Tokyo Metropolitan Bureau of Port and Harbor, “The Port Zone of Tokyo Port” (designation procedure and designated area)
- MLIT Ports and Harbours Bureau, “List of ports and location map of international strategic ports, international hub ports and major ports” (as of 1 April 2025)
- Kazushige Watanabe, Urban Research Center, Organization for Promotion of Urban Development, “On the Regulation of Structures in Port Zones”
- MLIT, “Building Dynamics Statistics Survey” (planning data on a building confirmation application basis)
- MLIT, National Land Numerical Information, “250 m Mesh Future Population Projections” (2024 edition, based on National Institute of Population and Social Security Research projections)
- Ministry of Internal Affairs and Communications / Ministry of Economy, Trade and Industry, “Economic Census” (establishments, employees, industry composition)
- MLIT, “Building Construction Starts Statistics” (hotel construction cost per tsubo)
■ Data sources
The description of subzone ordinances references the ordinance texts (appended tables) published by each port authority directly, reflecting the latest amendments as of September 2026. Room stock is the sum of registered room counts for lodging properties within a 3 km radius of each port terminal point (nine major ports, N=1,177 properties, 98,102 rooms). Estimated transacted ADR is a 13-month average from August 2025 to August 2026; wards and cities with fewer than ten properties in the sample are not shown. Hinterland indicators aggregate the Economic Census (establishments, employees, office-sector share) and National Land Numerical Information 250 m mesh future population projections over a 1.5 km radius. The pipeline extracts N=8 projects from planning data on a building confirmation application basis.
■ Assumptions
ADR is an estimated transacted rate (tax-exclusive equivalent) calculated by applying a segment-specific adjustment coefficient to the lowest publicly listed plan rate on OTA sites (two guests per room, per-room rate, tax-inclusive); cross-checked against property-level results disclosed by listed hotel REITs (91 properties, most recent three months), the median error is approximately 7%. Area-level ADR is the median across the properties covered. The sensitivity illustration assumes 200 rooms and 365 days a year and is derived by the arithmetic of RevPAR = ADR × full-year OCC alone; the ADR axis is the measured range in this article (¥7,600 to ¥17,500) and the full-year OCC axis (65-85%) is an assumption. Costs, NOI and yield are out of scope.
■ Limitations and caveats
The extent of subzone designation and the content of ordinance appended tables differ by port authority, and the texts contain many delegating provisions such as “as designated by the administrator,” so what is actually permitted is determined by public notices, guidelines and operational criteria. An individual site must always be confirmed with the relevant port authority. Floor area ratio and building coverage ratio follow the use district even inside a subzone. Because the pipeline is on a building confirmation application basis, future years are structurally undercounted and the figures are a lower bound on the confirmed portion. ADR is an estimate and differs from each property’s actual transacted rates and accounting figures. The ADR for Naka Ward, Yokohama could not be re-verified in this pass because the aggregation platform did not respond. The sensitivity analysis is an illustration and is not a substitute for the business plan of an individual project.
■ Market data
- MetroEngines Research & Consulting — estimated transacted ADR (August 2025 to August 2026) and room stock aggregation based on the property master (within a 3 km radius of nine major port terminals, N=1,177 properties)