

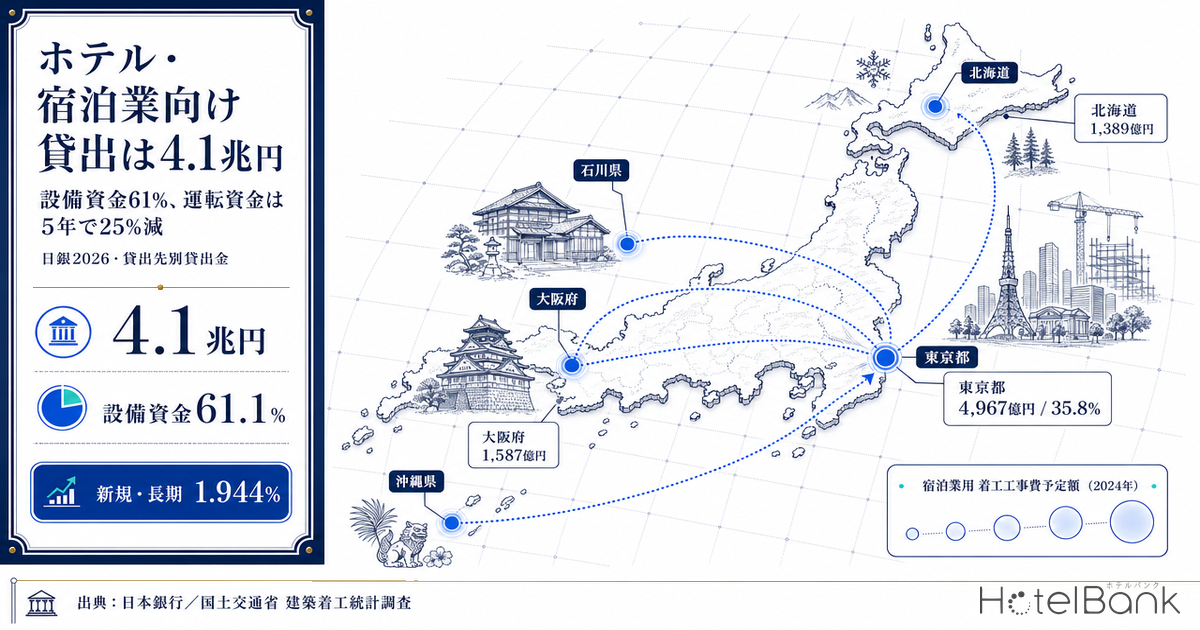
When people discuss how capital reaches Japan’s hotel industry, the conversation usually turns to REIT equity offerings and fund acquisitions. Yet for the large majority of lodging operators, the door to capital is still the bank. So how much is the banking sector as a whole lending to the lodging industry? The Bank of Japan’s quarterly survey “Loans and Bills Discounted by Sector” contains an industry code 52, “Accommodations,” and publishes the outstanding balance, capital investment funds, borrower counts and a breakdown by company size. This article reads that statistic back to 2005 and quantifies the shape of hotel debt as of 2026 along four dimensions: total volume, composition, borrower mix and cost of funds.
Metric Definitions Used in This Article
- Period-end loan balance: The outstanding balance of loans held by financial institutions at each quarter-end. Figures are for industry code 52, “Accommodations,” in the Bank of Japan’s “Loans and Bills Discounted by Sector.” Units are ¥100 million. The Resolution and Collection Corporation and Japan Post Bank are excluded.
- Capital investment funds / working capital: Capital investment funds are used to acquire or renovate land, buildings and equipment. Working capital is the balance less capital investment funds, and covers procurement, payroll and bridge financing. Working capital in this article is calculated as balance minus capital investment funds.
- Number of borrowers: The number of entities receiving loans. In the same Bank of Japan survey this figure is published only for end-March and end-September. An operator borrowing from multiple financial institutions is counted more than once.
- New capital investment lending: The value of capital investment loans newly executed during the quarter. This is a flow, not a stock.
- Average contracted interest rate on new loans (long-term): The value-weighted average contracted rate on loans with terms of one year or longer newly executed during the month, from the Bank of Japan’s “Average Contracted Interest Rates on Loans and Discounts.” It covers all industries and is not a rate specific to the lodging sector.
- Planned construction cost: The construction cost declared at the time of the building confirmation application, from the Ministry of Land, Infrastructure, Transport and Tourism’s “Statistical Survey on Building Construction Starts.” It does not match actual construction cost.
- Data sources: Bank of Japan, “Loans and Bills Discounted by Sector” and “Average Contracted Interest Rates on Loans and Discounts” / Ministry of Land, Infrastructure, Transport and Tourism, “Statistical Survey on Building Construction Starts” / MetroEngines Research & Consulting
- — ¥4.117 trillion — the lodging-sector loan balance at end-June 2026 (three lender types combined). That is 7.4% below the end-December 2021 peak, but still 18.8% above the pre-COVID level of end-March 2019, and it has plateaued there.
- — Capital investment share of 61.1% — up 9.0 points from 52.1% at end-March 2021. The total looks flat only because a 25.4% decline in working capital and a 7.8% rise in capital investment funds have almost exactly offset each other.
- — New capital investment lending of ¥438.8 billion — FY2025 is up 53.8% from the FY2022 trough and equal to 89.3% of FY2019. Measured as a share of all industries, however, it has only moved from 1.095% to 0.747% — roughly 70% of the way back.
- — SPC lending up 3.45x — over the same seven years, balances to real estate securitization SPCs rose from ¥5.4094 trillion to ¥18.6865 trillion. Hotel debt has split into two separate channels: lodging-sector credit and real estate finance.
- — Cost of funds up 2.8x — the average rate on new long-term loans rose from 0.699% in March 2022 to 1.944% in June 2026. Applied to the entire balance, that equates to roughly ¥32.2 billion of additional annual interest, or about ¥2.98 million per borrower.
Lodging lending totals ¥4.12 trillion — and the lenders split three ways
As of end-June 2026, the lodging-sector loan balance held by the financial institutions the Bank of Japan tracks totalled ¥4.117 trillion. Domestic banks accounted for ¥2.585 trillion (62.8%), shinkin banks for ¥610.5 billion (14.8%) and other financial institutions for ¥921.5 billion (22.4%). “Other financial institutions” here comprises six bodies — the Norinchukin Bank, the Shoko Chukin Bank, the Development Bank of Japan, the Japan Finance Corporation (micro business, SME and agriculture-forestry-fisheries units), the Japan Bank for International Cooperation and the Okinawa Development Finance Corporation. Credit cooperatives, labor banks and insurance companies are not included in the tally. This was the layer through which public liquidity support was concentrated during the pandemic: its balance swelled 1.9-fold in one year and nine months, from ¥530.5 billion at end-March 2020 to ¥1.0216 trillion at end-December 2021.
The combined peak across the three lender types was ¥4.4454 trillion at end-December 2021, from which the total had fallen 7.4% by end-June 2026 (the domestic-bank peak on its own was ¥2.8119 trillion at end-March 2021). Compared with pre-COVID end-March 2019 (¥3.4666 trillion), however, the balance is still 18.8% higher. In other words, the industry has not finished repaying what emergency lending added: borrowings remain elevated, roughly ¥650 billion above where they stood before the pandemic.
| Lender type | End-Mar 2019 | End-Mar 2021 | End-Jun 2026 | vs 2019 | vs peak |
|---|---|---|---|---|---|
| Domestic banks (three accounts combined) | 23,550 | 28,119 | 25,850 | +9.8% | −8.1% |
| Shinkin banks | 6,012 | 6,732 | 6,105 | +1.5% | −9.3% |
| Other financial institutions | 5,104 | 9,227 | 9,215 | +80.5% | −0.1% |
| Total | 34,666 | 44,078 | 41,170 | +18.8% | −6.6% |
The total is flat; inside it, working capital has been swapped for capital investment
Look only at the headline balance and lodging lending has barely moved for years. On a domestic-bank basis it was ¥2.598 trillion at end-March 2023 and ¥2.585 trillion at end-June 2026 — a decline of just 0.5% over three years. Break the total apart, though, and an entirely different picture emerges.
The capital investment balance rose 7.8%, from ¥1.4656 trillion at end-March 2021 to ¥1.5804 trillion at end-June 2026. Over the same period, working capital (balance minus capital investment funds) fell 25.4%, from ¥1.3463 trillion to ¥1.0046 trillion. The total looks flat because the repayment of working capital piled up during the pandemic and the accumulation of investment lending have offset one another almost exactly.
As a result, the capital investment share climbed 9.0 points, from 52.1% at end-March 2021 to 61.1% at end-June 2026. That is 14.0 points above the 47.1% average across all industries — a numerical statement of the fact that lodging is an industry that ties up capital in buildings. The scale of the working-capital contraction also suggests that the repayment phase for pandemic liquidity support, epitomised by Japan’s interest-free, unsecured “zero-zero” loans, is entering its final stretch, and that balance sheets are returning to their normal shape.
New capital investment lending is back to 89% of FY2019
A balance is a stock, and does not directly reflect appetite for investment. What does the flow show? The Bank of Japan also publishes the value of capital investment loans newly executed during each quarter, and summing these by fiscal year makes the investment cycle clearly visible.
New capital investment lending to the lodging sector fell from its inbound-boom peak — ¥495.3 billion in FY2018 and ¥491.5 billion in FY2019 — to ¥285.3 billion in FY2022, a drop of 42.4% from the peak. It has risen for three consecutive years since: ¥314.1 billion in FY2023, ¥396.3 billion in FY2024 and ¥438.8 billion in FY2025, bringing the latest figure back to 89.3% of FY2019. Measured from the FY2022 trough, that is an increase of 53.8%.
Viewed as a share of all industries, however, the recovery still has some way to run. In FY2018, 1.095% of all new capital investment lending went to the lodging sector; in FY2025 the figure was 0.747%. Roughly 90% of the amount has returned, but only about 70% of the relative allocation. The reason is that capital investment lending across all industries has itself been growing strongly, which makes the lodging recovery look thinner in relative terms.
Borrowers have shifted toward SMEs as large companies moved away from banks
The breakdown by company size shows where the sector’s funding structure has polarised. Of the ¥2.5765 trillion domestic-bank balance at end-March 2026, ¥2.0088 trillion (78.0%) went to SMEs, ¥381.6 billion (14.8%) to mid-sized companies and ¥186.0 billion (7.2%) to large companies. At end-March 2019 the split was 74.1% SME, 14.4% mid-sized and 11.5% large — so over seven years the SME share rose 3.9 points while the large-company share fell 4.3 points.
Large-company lending has been the most volatile of the three. It contracted 57.5%, from ¥337.8 billion at end-December 2020 to ¥143.6 billion at end-December 2023, then recovered to ¥203.5 billion by end-June 2026. That is consistent with major hotel operators diversifying away from pandemic-era emergency borrowing into bonds, equity and private funds, and more recently rebuilding their bank debt. In an era of roughly 1% policy rates, the choice between bank debt and those alternatives comes down to a comparison of cost of capital instrument by instrument.
The borrower counts are more telling still. The number of lodging borrowers at domestic banks fell continuously from a peak of 11,625 at end-March 2021, bottoming at 10,775 at end-September 2025. The most recent reading, 10,781 at end-March 2026, is a marginal increase. The fact that the decline has stopped can itself be read as a signal that closures and restructurings have run their course. Shinkin banks, meanwhile, saw borrower counts rise 11.7%, from 5,878 at end-March 2019 to 6,566 at end-March 2026. Their average balance per borrower is ¥93 million against ¥239 million at domestic banks — small-ticket lending, which suggests regional financial institutions are picking up funding demand from small ryokan and guesthouses. For how that regional-institution capital is being deployed deal by deal, see our structural analysis of regional bank-led small-scale continuous development and renovation funds, which compares it with large REIT acquisitions.
| Metric | End-Mar 2019 | End-Mar 2021 | End-Mar 2026 |
|---|---|---|---|
| Borrowers (domestic banks) | 10,623 | 11,625 | 10,781 |
| Balance per borrower (domestic banks) | ¥222mn | ¥242mn | ¥239mn |
| Of which SME borrowers | 10,077 | 11,144 | 10,389 |
| Balance per SME borrower | ¥173mn | ¥189mn | ¥193mn |
| Borrowers (shinkin banks) | 5,878 | 6,633 | 6,566 |
| Balance per borrower (shinkin banks) | ¥102mn | ¥102mn | ¥93mn |
Lodging is the one sector not growing — because the money went to “real estate”
Widen the lens for a moment. Indexed to end-March 2019 = 100, domestic-bank loan balances at end-June 2026 stand at 132.8 for all industries and 147.6 for real estate, against just 109.8 for lodging. Even food service is at 118.7. On the numbers alone it is tempting to conclude that banks are not lending to hotels — but that is not an accurate reading of the statistic.
Over the same period, balances under industry code 89, “SPCs for real estate securitization and similar purposes,” swelled 3.45-fold, from ¥5.4094 trillion to ¥18.6865 trillion. When a hotel is acquired through a special purpose company, that funding is recorded under “real estate” in the Japan Standard Industrial Classification and never appears under “accommodations.” The same is true of the non-recourse loans used by REITs and private funds to acquire hotels. For reference, the seven listed hotel REITs hold hotels with a combined acquisition price of ¥1.7909 trillion (287 properties, per the ownership master as of August 2026; one REIT’s 15 properties were excluded because of column inconsistencies).
The Bank of Japan’s “accommodations” figure is therefore a statistic about credit extended to operating companies. Real estate finance routed through securitization and funds does not show up in it. A flat lodging balance is not the same thing as a thinning supply of capital to hotels; if anything, the widening gap between the two series is the evidence that funding routes have split in two over these seven years. Today’s investment environment, with cap rates near record lows, reflects that second channel.
Funding costs have risen 2.8x in just over four years — 2% is now in sight on new long-term loans
Interest rates moved alongside balances. The Bank of Japan’s average contracted rate on new long-term loans rose on a domestic-bank basis from 0.699% in March 2022 to 1.944% in June 2026, an increase of 1.245 points — a multiple of 2.8. In May 2026 the monthly figure reached 2.066%, above the 2% mark. The Bank of Japan raised its policy rate from around 0.75% to around 1.0% at the June 2026 Monetary Policy Meeting, and lending rates have followed.
The spread between lender types is worth noting too. As of the same month, June 2026, regional banks were at 1.797% and shinkin banks at 2.155%. Shinkin banks started high — 1.330% back in March 2022 — so their increase (0.825 points) is smaller than that of domestic banks. In level terms, however, theirs remains the highest: the pattern in which smaller operators bear the heaviest absolute cost of funds has not changed. Note also that these rates are all-industry averages, not figures specific to the lodging sector.
To size the impact roughly: if the entire ¥2.585 trillion domestic-bank lodging balance were repriced to current new-loan levels, the 1.245-point spread would add about ¥32.2 billion of annual interest. In practice, fixed-rate tranches on existing borrowings remain in place, so this figure is only a theoretical ceiling. For an operator carrying the average balance of ¥239 million, the same calculation equates to roughly ¥2.98 million of additional annual cost. With a capital investment share of 61%, lodging borrowings run long and refinancing dates are spread out, so the impact emerges gradually — which also means it takes a long time to work through in full. For the economics of new development, we work backwards to the break-even ADR by market in our analysis of a 1.00% policy rate and hotel development.
Confirmation from the physical side — 2024 lodging construction starts hit a record ¥1.0385 trillion
If capital investment balances are building up, real investment must be moving somewhere. Tracking planned construction cost for lodging buildings in the MLIT “Statistical Survey on Building Construction Starts,” 2024 (the latest annual final figures) recorded ¥1.0385 trillion across 2,836 buildings and 1.756 million square metres — above the ¥1.0086 trillion of 2018 and the highest since 2011. That is 2.76 times the trough year of 2023, at ¥376.2 billion.
It normally takes one to three years from construction start to completion and opening. Because payments on projects begun in 2024 are drawn down in instalments from 2025 through 2027, the rise in the capital investment balance from ¥1.4871 trillion at end-March 2025 to ¥1.5804 trillion at end-June 2026 lines up with that wave of construction starts on the time axis. On the building-plan data MetroEngines Research & Consulting tracks, 27 projects with 5,184 rooms are scheduled for completion in 2026, 22 projects with 3,738 rooms in 2027, and 9 projects with 1,473 rooms in 2028. These counts are based on confirmation applications as of the survey date and are expected to rise as further applications are filed, so they should be read as a floor for the currently confirmed pipeline.
New construction is not the whole of the investment story. Renewal demand across the existing stock is another important source of capital investment funding. Given that 236,000 hotel rooms sit in buildings under the pre-1981 seismic code and that 42.7% of rooms in 32 regional core cities opened before 1996, renovation investment should continue to underpin capital investment demand for years to come.
| Prefecture | Planned construction cost | Share of national |
|---|---|---|
| Tokyo | ¥496.7bn | 35.8% |
| Osaka | ¥158.7bn | 11.5% |
| Hokkaido | ¥138.9bn | 10.0% |
| Kanagawa | ¥55.3bn | 4.0% |
| Ishikawa | ¥54.3bn | 3.9% |
| Okinawa | ¥45.2bn | 3.3% |
| Hyogo | ¥32.1bn | 2.3% |
| Chiba | ¥30.5bn | 2.2% |
| Shizuoka | ¥24.7bn | 1.8% |
| Kagawa | ¥24.4bn | 1.8% |
The geographic distribution is starkly uneven. Of the ¥1.3861 trillion of national 2024 construction starts for accommodation and food service use (planned cost), Tokyo accounted for ¥496.7 billion, or 35.8%, followed by Osaka at ¥158.7 billion and Hokkaido at ¥138.9 billion. The top three prefectures represent 57.3% of the national total. Ishikawa’s appearance in fifth place at ¥54.3 billion very likely reflects recovery and reconstruction investment following the Noto Peninsula Earthquake. That capital investment demand is not spread evenly across the country, but concentrated in the major metropolitan areas and in specific reconstruction markets, is worth bearing in mind when thinking about regional financial institutions’ credit portfolios.
Sensitivity and three scenarios — how far can interest costs swing, and where does the flow land?
Everything above is actual data. To close, we use only those observed values to measure the range of possible outcomes. The “roughly ¥32.2 billion a year” cited earlier is a theoretical ceiling that assumes the entire balance reprices to current new-loan rates; in reality the figure depends heavily on how fast refinancing progresses and which lender type’s rate level it lands on.
| Refinancing progress | Regional banks 1.797% (+1.098pt) | Domestic banks 1.944% (+1.245pt) | May 2026 monthly 2.066% (+1.367pt) | Shinkin banks 2.155% (+1.456pt) |
|---|---|---|---|---|
| 20% refinanced | 57 | 64 | 71 | 75 |
| 40% refinanced | 114 | 129 | 141 | 151 |
| 60% refinanced | 170 | 193 | 212 | 226 |
| 80% refinanced | 227 | 257 | 283 | 301 |
| 100% refinanced | 284 | 322 | 353 | 376 |
The floor is the case where only 20% is refinanced and rates settle at the regional bank level: about ¥5.7 billion a year. The ceiling is full repricing to the shinkin bank level, at roughly ¥37.6 billion. That is nearly a sevenfold range, which shows why any single-number claim about “how much higher rates will add to the industry’s interest bill” does not hold up. Applying the same conditions to the average balance of ¥239 million per borrower, the additional cost at 100% refinancing ranges from ¥2.624 million at the regional bank rate to ¥2.976 million at the domestic bank rate, ¥3.267 million at the May 2026 monthly rate and ¥3.480 million at the shinkin bank rate.
| Scenario | Assumption (derived from observed values cited above) | FY2026 new capital investment lending | vs FY2019 | Share of all industries |
|---|---|---|---|---|
| Bear | Plateaus at the FY2025 level (growth stops) | ¥438.8bn | 89.3% | 0.747% |
| Base | Extends the average annual increase of the past three years — ¥51.2bn per year (FY2022 to FY2025: +¥153.5bn / 3) — by one more year | ¥490.0bn | 99.7% | 0.834% |
| Bull | Recovers to the FY2018 actual peak of ¥495.3bn | ¥495.3bn | 100.8% | 0.843% |
In all three scenarios, a return to FY2019 levels is within sight in absolute terms. The share of all industries, though, reaches only 0.843% even in the bull case — short of the 1.095% recorded in FY2018. Recovery in amount and recovery in share are not the same, and how far the sector’s relative allocation of capital returns will be settled by a tug-of-war between the industry’s own investment opportunities and capital investment appetite elsewhere in the economy.
Three things this tells us
1. It is the composition that is moving, not the volume
Lodging lending is flat at ¥4.12 trillion in total, but the capital investment share has climbed from 52.1% to 61.1%. Repayment of pandemic working capital and the accumulation of investment lending are happening at once, and balance sheets are returning to their normal shape.
2. The statistical “lodging sector” is only half the industry
Acquisition funding routed through SPCs is recorded under real estate. Given that SPC balances have grown 3.45-fold in seven years, measuring debt supply to hotels requires looking at both lodging-sector credit and real estate finance.
3. Costs are up, and the recovery is only half done
The average rate on new long-term loans rose 1.245 points in four years. New capital investment lending is back to 89% of FY2019, but only about 70% of the way back as a share of all industries. Capital is returning; its relative priority is still catching up.
A closing word on how to use this statistic. The Bank of Japan’s “Loans and Bills Discounted by Sector” is published quarterly, with data currently available through end-June 2026. Few other official statistics allow the lodging sector to be tracked under a dedicated industry code, which makes it useful for setting business-plan assumptions, for conversations with lenders and for verifying industry reports. Because it updates every quarter, the capital investment share and the flow of new lending are both worth monitoring continuously as leading indicators of the hotel investment cycle.
Frequently Asked Questions
¥4.117 trillion as of end-June 2026, comprising ¥2.585 trillion from domestic banks, ¥610.5 billion from shinkin banks and ¥921.5 billion from other financial institutions. The source is industry code 52, “Accommodations,” in the Bank of Japan’s “Loans and Bills Discounted by Sector,” which excludes the Resolution and Collection Corporation and Japan Post Bank.
Capital investment funds are long-term money used to acquire or renovate land, buildings and equipment; working capital covers day-to-day operations such as procurement, payroll and bridge financing. For domestic bank lending to the lodging sector at end-June 2026, capital investment funds were ¥1.5804 trillion (61.1%) and working capital ¥1.0046 trillion (38.9%). That capital investment share is 14.0 points above the all-industry average of 47.1%.
The total has fallen 7.4% from its peak of ¥4.4454 trillion at end-December 2021 and has moved sideways since. On a flow basis, however, new capital investment lending has risen for three consecutive years from its FY2022 trough of ¥285.3 billion, reaching ¥438.8 billion in FY2025 — 89.3% of the FY2019 level.
No. When a hotel is acquired through a special purpose company (SPC), the lending is recorded under “real estate” or “SPCs for real estate securitization and similar purposes” in the Japan Standard Industrial Classification. Balances to those SPCs have grown 3.45-fold, from ¥5.4094 trillion at end-March 2019 to ¥18.6865 trillion at end-June 2026.
On the new long-term series of the Bank of Japan’s “Average Contracted Interest Rates on Loans and Discounts,” domestic banks rose 1.245 points, from 0.699% in March 2022 to 1.944% in June 2026. Regional banks were at 1.797% and shinkin banks at 2.155% (both June 2026). These are all-industry averages, not rates specific to the lodging sector.
At domestic banks, as of end-March 2026, a balance of ¥2.5765 trillion was spread across 10,781 borrowers, or ¥239 million each. Limiting this to SMEs gives 10,389 borrowers and ¥2.0088 trillion, or ¥193 million each; shinkin banks had 6,566 borrowers and ¥611.8 billion, or ¥93 million each. Note that an operator borrowing from multiple financial institutions is counted more than once.
It is published on the Bank of Japan’s statistics site under “Loans and Bills Discounted by Sector.” The latest values can be retrieved from the Bank’s time-series data search site by specifying the series for industry code 52, “Accommodations.” The survey is quarterly, and borrower counts are published only for end-March and end-September.
Related Reading
- Policy Rate 1.00%: Break-Even ADR Across Japan’s 8 Hotel Markets
- Japan’s Pre-1981 Hotel Stock: 236k Rooms, 19.1% — Retrofit or Rebuild
- Own a Hotel from ¥100,000 — Security Tokens Open a Third Funding Route
- Hotel Builder Ranking 2026: Daiwa House 99 Projects, 55% Undecided
- Regional Bank-Led Small-Scale Continuous Hotel Funds — Capital Supply vs. Large REIT Acquisitions
- Hotel Acquisition Costs 7.1%: A 6.5% Gross Yield Becomes 4.65% Net
- 226k Hotel Rooms in 32 Regional Cities: 42.7% Built Before 1996
References and Sources
■ Data sources
Bank of Japan, “Loans and Bills Discounted by Sector” (quarterly survey; series from 2005 to end-June 2026 for industry code 52 “Accommodations,” 89 “SPCs for real estate securitization and similar purposes,” and 90 “Total”); Bank of Japan, “Average Contracted Interest Rates on Loans and Discounts” (new long-term loans; domestic banks / regional banks / shinkin banks, 2018 to June 2026); Ministry of Land, Infrastructure, Transport and Tourism, “Statistical Survey on Building Construction Starts” (by use and by builder type, table ID 0003114490; by prefecture, 0003114510; 2011-2024). The 85-project lodging pipeline based on building plans, and the listed hotel REIT ownership master (7 REITs, 302 properties, as of August 2026), are compiled by MetroEngines Research & Consulting.
■ Calculation assumptions
Working capital is calculated as period-end loan balance minus capital investment funds. Fiscal-year totals for new capital investment lending are summed from April to March. The interest cost estimate takes as its ceiling the case in which the entire domestic-bank lodging balance of ¥2.585 trillion (end-June 2026) reprices to the average rate on new long-term loans, using the spread against 0.699% in March 2022. The rate levels in the columns of Table 4 are only observed values cited in the text (regional banks 1.797%, domestic banks 1.944%, the May 2026 monthly figure of 2.066%, shinkin banks 2.155%), and refinancing progress is a pro-rata share of the balance repriced. The three scenarios in Table 5 are set as follows: bear = plateau at the FY2025 actual; base = the observed average annual increase of ¥51.2 billion across FY2022-FY2025 extended by one year; bull = recovery to the FY2018 actual peak of ¥495.3 billion. The share of all industries holds total new capital investment lending across all industries at its FY2025 level (approximately ¥58.7 trillion). The REIT acquisition price total covers 287 properties, excluding one REIT’s 15 properties that had column inconsistencies.
■ Limitations and caveats
Borrower counts double-count operators that borrow from multiple financial institutions, and are published only for end-March and end-September, so consecutive quarterly comparison is not possible. The average contracted interest rate is an all-industry figure, not a rate specific to the lodging sector. Hotel lending routed through SPCs or securitization is not recorded under industry code 52, so the balances in this article cover only credit extended to lodging operating companies. Planned construction cost is the value declared at the time of the building confirmation application and does not match actual construction cost; prefecture-level figures use the major use category “M: accommodation and food service buildings” and therefore include food service (nationally, lodging use accounts for 74.9%). The building-plan pipeline is based on confirmation applications as of the survey date and is a floor that will rise as further applications are filed. The Resolution and Collection Corporation and Japan Post Bank, along with credit cooperatives, labor banks and insurance companies, are not included in the Bank of Japan’s tally. Tables 4 and 5 are mechanical sensitivity calculations using only observed values cited in the text, and are not forecasts of future interest rates or investment volumes.
■ Financial statistics
- Bank of Japan, “Loans and Bills Discounted by Sector” (quarterly survey; industry code 52 Accommodations / 89 SPCs for real estate securitization and similar purposes / 90 Total)
- Bank of Japan time-series statistical data search site (Loans and Bills Discounted by Sector, LA01; Average Contracted Interest Rates on Loans and Discounts, IR04)
■ Government statistics
■ Market data
- MetroEngines Research & Consulting — lodging pipeline based on building plans (85 projects) and the listed hotel REIT ownership master (as of August 2026)
■ Policy rate and market environment