

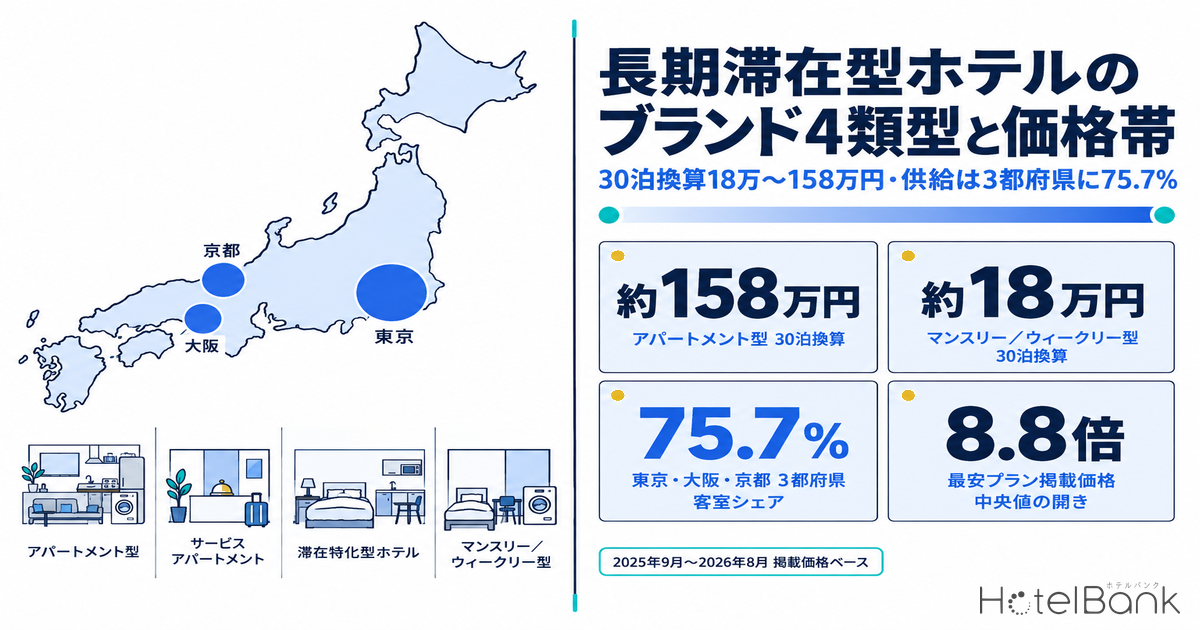
Long-stay hotels are no longer a single format. Residential-style apartment hotels, international serviced apartments, extended-stay hotels that put a kitchen and washing machine in every room, and monthly/weekly properties built around month-based billing all sit under the same “long-stay” banner, yet they differ completely in room design, price band and where they are located. This article sorts the 104 domestic properties that MetroEngines Research could identify as long-stay by brand name into four types, and uses observed data to show the listed prices (per night and on a 30-night basis) and the geographic concentration of supply for each type.
This is an overview of market structure for operators, investors and developers; it is not a guide to choosing where to stay. Readers looking for an individual long-stay property should consult consumer-oriented brand guides and comparisons of serviced apartments and monthly apartments instead.
Metric Definitions Used in This Article
- Listed price (all-plan average): The average across all plans of the selling prices each property publishes on OTAs and other channels. Per-room rate for two guests sharing one room, tax included. Covers everything from room-only to meal-inclusive plans.
- Lowest-plan listed price: The cheapest level among the plans each property publishes. Per-room rate for two guests sharing one room, tax included. Used as a floor that approximates actual long-stay pricing.
- 30-night equivalent: A reference value obtained by mechanically multiplying the lowest-plan listed price by 30. It does not reflect monthly-contract discounts, changes in housekeeping frequency or utility charges, so it will not match actual monthly contract rates.
- Period: The 12 months from September 2025 to August 2026. Each property’s value is the median of its monthly values; medians and quartiles are then calculated for each type.
- Data source: MetroEngines Research. This article does not use ADR (estimated settled rate) and is based consistently on listed prices.
- — Four types: The 104 domestic properties identified as long-stay split into apartment hotels, serviced apartments, extended-stay hotels and monthly/weekly properties, each with different room design and billing.
- — 8.8x: Median lowest-plan listed prices range from ¥6,000 to ¥52,500 (two guests, per room, tax included). On a 30-night basis the band widens to roughly ¥180,000 to ¥1.58 million.
- — Inverse relationship: The median property size is 41 rooms for apartment hotels versus 167 rooms for extended-stay hotels. Price band is determined not by property scale but by how each unit is built.
- — 75.7%: Of the 83 observable properties with 8,242 rooms, Tokyo, Osaka and Kyoto account for 75.7% of rooms, and none of the 26 apartment hotels is yet located outside these three cities.
- — 1,446 plans: Existing hotels selling multi-night plans form a fifth source of supply. There are 1,446 long-stay-related plan names; 96% emphasize multi-night discounts, while only 20% promote the stay experience.
Dividing Long-Stay Hotels into Four Types
The term “long-stay hotel” tends to be used in a way that mixes up room facilities, billing method and operator. To compare them as businesses, these three dimensions need to be separated and then mapped into types. Sorting the 104 domestic properties that could be identified as long-stay by brand name in MetroEngines Research’s property master, according to how the room unit is built and how billing is structured, yields the following four types.
| Type | Room unit design | Billing structure | Representative brands (in no particular order) |
|---|---|---|---|
| Apartment hotels | Residential units with a living room plus bedroom. Kitchen, tableware and washing machine as standard. Mainly large units for 4-6 guests | Per night, designed around multi-night use | MIMARU / MIMARU SUITES and others |
| Serviced apartments | Residences from studios to multi-bedroom units. Kitchen and washing machine plus hotel services such as front desk and housekeeping | Nightly and monthly billing side by side. Some properties now require stays of 30 nights or more | Citadines / Somerset / Oakwood / Ascott / Fraser and others |
| Extended-stay hotels | Standard hotel rooms with a kitchenette, microwave and washer-dryer added. Room format for 1-3 guests | Per night, with multi-night discounts built into plan design | Tokyu Stay (東急ステイ) and others |
| Monthly/weekly properties | Simple single-occupancy rooms, often with shared laundry and a basic kitchen in the building | Mainly weekly or monthly contracts; nightly sales are supplementary | Weekly Sho (ウィークリー翔) and other small regional operators |
Source: Compiled by HotelBank Editorial Team from MetroEngines Research (104 identified properties)
The fourth type, monthly/weekly properties, historically grew up as a business closer to real estate than to hospitality, built on construction-work and business-trip demand in regional cities. The other three types, by contrast, are all designed as investment products aimed at inbound travelers and long-stay business demand in major cities. Even under the same “long-stay” label, the source of demand is fundamentally different.
Beyond these four types, there is a fifth source of supply: existing full-service and business hotels that participate partially in the long-stay market through multi-night plans. This is covered later in the article.
Price Bands by Type — From ¥180,000 to ¥1.58 Million on a 30-Night Basis
Of the 104 identified properties, 83 properties with a combined 8,242 rooms had listed prices observed continuously on OTAs and other channels over the past 12 months. The table below aggregates these 83 properties by type. On a median lowest-plan listed price basis, monthly/weekly properties sit at ¥6,000 while apartment hotels reach ¥52,500, a gap of 8.8 times.
| Type | Properties | Total rooms | Rooms per property (median) |
Listed price all-plan average |
Lowest-plan listed price |
30-night equivalent (reference) |
|---|---|---|---|---|---|---|
| Apartment hotels | 26 | 1,387 | 41 rooms | ¥92,500 | ¥52,500 | approx. ¥1.58M |
| Serviced apartments | 11 | 1,594 | 130 rooms | ¥43,500 | ¥26,800 | approx. ¥800K |
| Extended-stay hotels | 29 | 4,596 | 167 rooms | ¥34,000 | ¥18,800 | approx. ¥560K |
| Monthly/weekly properties | 17 | 665 | 38 rooms | ¥6,600 | ¥6,000 | approx. ¥180K |
Source: Compiled by HotelBank Editorial Team from MetroEngines Research (N=83 properties, 8,242 rooms, September 2025 – August 2026)
Source: Compiled by HotelBank Editorial Team from MetroEngines Research (N=83 properties)
This multiple should not, however, be read as a price difference for the same product. Listed prices are per-room rates for two guests, so an apartment hotel showing a 4-6 person unit at the two-guest rate and a monthly property showing a single-occupancy room at the two-guest rate are offering different floor area and capacity per room to begin with. With four guests, the per-person level drops substantially. The comparison across types is about how much revenue each room captures, not about which is expensive or cheap per person.
There is also a geographic confound. Seven of the 17 monthly/weekly properties are in Gifu, and none in the sample is in Tokyo. Apartment hotels, serviced apartments and extended-stay hotels, on the other hand, are concentrated in Tokyo, Kyoto and Osaka. The price gaps in the table above therefore mix differences in type with differences in location. Limiting the comparison to Tokyo, median lowest-plan listed prices are ¥57,700 for apartment hotels (N=15), ¥60,700 for serviced apartments (N=5) and ¥21,100 for extended-stay hotels (N=20), and the gap between the top two types essentially disappears. Since the median listed price across all properties in Tokyo is ¥25,500 (about 1,716 properties observed per month), extended-stay hotels are priced close to the overall market, while the top two types sit in a band just over twice that level.
Unit Design, Not Property Scale, Sets the Price Band
Overlaying median rooms per property with price band by type reveals a clean inverse relationship. Extended-stay hotels have the largest median size at 167 rooms, followed by serviced apartments at 130, apartment hotels at 41 and monthly properties at 38. Apartment hotels, the type with the highest price band, are actually small as properties.
Source: Compiled by HotelBank Editorial Team from MetroEngines Research (bubble size = number of properties, N=83 properties)
This directly reflects different business models. Apartment hotels limit the number of units per building and load each unit with generous floor area and equipment to command a high rate. Extended-stay hotels stack up room count and earn through turnover and occupancy. Neither is inherently superior; they are different kinds of assets chosen at the development stage. The former is a design that converts floor area into rate, the latter one that converts floor area into room count. The conditions under which residential-style units work once revenue is recalculated per unit of floor area differ considerably between central business districts and resort locations.
By total room count, extended-stay hotels account for 4,596 of the 8,242 rooms across these 83 properties, or 55.8%. Contrary to the impression given by brand or property counts, the majority of long-stay stock is currently provided by mid- to large-scale hotels that have added kitchens to standard rooms.
Supply Geography — 75.7% of Rooms in Tokyo, Osaka and Kyoto
The geographic skew of supply is even sharper than the price differences between types. Of the 83 properties and 8,242 rooms, Tokyo has 40 properties with 4,577 rooms (55.5% of rooms), Osaka 8 properties with 943 rooms (11.4%) and Kyoto 11 properties with 722 rooms (8.8%), bringing the three prefectures to 75.7% of rooms. The remaining 24.3% is thinly spread across Gifu, Hokkaido, Fukuoka, Okinawa and elsewhere.
Source: Compiled by HotelBank Editorial Team from MetroEngines Research (by number of properties, top 8 prefectures)
The character of the distribution differs by type. All 26 apartment hotels are located in Tokyo (15), Kyoto (7) and Osaka (4), with not a single property yet outside these three cities. Nine of the 11 serviced apartments are also in the same three prefectures. Extended-stay hotels, by contrast, are anchored by 20 properties in Tokyo but also dotted across Hokkaido, Ishikawa, Fukuoka, Okinawa and Gifu, reflecting expansion into major regional cities and tourist destinations. Monthly/weekly properties show the opposite pattern, with only one property in the three major prefectures and the rest scattered across regional areas including Gifu, Hokkaido, Aomori, Toyama, Tochigi, Hiroshima, Wakayama, Nagasaki and Miyazaki.
Source: Compiled by HotelBank Editorial Team from MetroEngines Research. Circle size = number of rooms, color = type (N=83 properties)
Adding opening years shows where this distribution sits on the timeline. All 26 apartment hotels opened in 2018 or later, with a median opening year of 2020. The median is 2017 for serviced apartments, 2014 for extended-stay hotels and 2010 for monthly/weekly properties. In other words, the top two types concentrated in the three cities are new stock launched within the last eight years, while the two types spread across regional areas are stock built by an earlier generation. Urban long-stay supply is close to the stage where only its first generation has fully arrived.
The Fifth Supplier — Multi-Night Plans at Existing Hotels
Counting only dedicated brands, the long-stay market comprises 104 properties, but in practice many times that number of rooms are supplied to long-stay demand through multi-night plans at existing hotels. Among the plan names MetroEngines Research tracks as active within the last 90 days, 1,446 distinct plan names contain terms such as “multi-night” (連泊), “long stay” (長期滞在), “monthly”, “weekly” or “long-stay” (ロングステイ).
Breaking these plan names down by selling point, 96% carry a multi-night discount message in the name, 32% explicitly include breakfast and 27% explicitly state room-only. Notably, 20% promote the stay experience itself, such as “long stay” or “living like a local”, indicating a partial shift from simple length-of-stay discounts toward naming that sells the quality of the stay. Some 18% incorporate environmental options (such as choosing housekeeping frequency), a design that simultaneously cuts operating costs on multi-night stays and appeals to guests.
| Selling point in plan name | Frequency | Business implication |
|---|---|---|
| Multi-night discount (price appeal tied to length of stay) | 96% | Almost every plan is built around price |
| Breakfast included | 32% | Designed to capture guests’ dining during the stay |
| Room only | 27% | Tailored to long-stay guests who cook for themselves or eat out |
| Long stay / living (experience appeal) | 20% | A segment trying to differentiate on something other than price |
| Environmental options (e.g., choice of housekeeping frequency) | 18% | Balances operating costs with guest appeal |
Source: Compiled by HotelBank Editorial Team from MetroEngines Research (long-stay-related plan names, N=1,446)
The investment decision to develop a dedicated brand and the operational decision for an existing hotel to pursue long-stay demand through multi-night plans involve completely different capital requirements and payback periods. The former requires residential-style design and equipment plus a long development lead time, while the latter can start tomorrow simply by redesigning plans and reorganizing housekeeping operations. The fact that there are two routes to capturing market growth matters for how prospective developers read the competitive landscape, and for how existing operators decide what to do first.
Expansion Plans in Operators’ Published Figures
The expansion plans that operators have announced can be checked as primary information separate from our own aggregation. Because each operator counts differently, the figures cannot be compared with one another, but they are useful for reading direction. The figures below are quoted as published by each company.
Among apartment hotels, Cosmos Initia (a Daiwa House Group company) announced that opening “MIMARU Osaka Shinsaibashi CENTRAL” on September 1, 2026 brings its total to 1,500 rooms, and that it aims for 3,000 rooms by 2030. The company says it has multiple properties under development in the Osaka area in addition to its five existing properties there (Source: Daiwa House Group and Cosmos Initia releases).
Among serviced apartments, The Ascott Japan has announced that it operates five brands in Japan (Ascott, Somerset, Citadines, Oakwood and lyf) with 22 properties in Tokyo, Yokohama, Osaka, Kyoto and Fukuoka. On June 25, 2026 it opened “Oakwood Oimachi Tracks Tokyo” (オークウッド大井町トラックス東京), a serviced residence dedicated to long stays that requires a minimum stay of 30 nights. It also plans to open “Citadines North Shinjuku Tokyo” (シタディーンノース新宿東京) on October 28, 2026 (Source: The Ascott Japan press releases).
The adoption of a 30-night minimum stay in a new opening is noteworthy as an indicator of how mature the long-stay market has become in Japan’s major cities. Rather than running nightly sales and month-long stays side by side on the same inventory, the decision to carve out inventory exclusively for monthly stays reflects a judgment that enough demand exists, at least in station-connected locations in Tokyo. As an inventory management philosophy, this belongs to a different lineage from conventional extended-stay hotels.
The global extended-stay hotel market is estimated to grow from US$58.97 billion in 2025 to US$99.15 billion in 2031, a compound annual growth rate of 10.62% (Source: Mordor Intelligence). This is a worldwide estimate and does not indicate the size of the domestic market, but it does show the international context of capital flowing toward long-stay formats.
Summary — Don’t Lump the Types Together
Three practical takeaways follow from this analysis.
First, treating long-stay hotels as a single market leads to poor decisions. Median lowest-plan listed prices span 8.8 times, from ¥6,000 to ¥52,500, and rooms per property range from 38 to 167. Competitive analysis should compare only properties of the same type in the same area.
Second, urban long-stay stock is still in its first generation. All 26 apartment hotels opened in 2018 or later, and none is yet located outside Tokyo, Kyoto and Osaka. Other designated cities and regional core cities remain essentially blank for this type. Whether that blank space will be filled by demand is a separate question, however, and it should be read alongside the fact that monthly/weekly properties already serve demand in regional areas at a different price band.
Third, new development is not the only route into the market. Some 1,446 plan names are already on the market as multi-night plans at existing hotels, and 96% of them are built around price. Conversely, the 20% segment named around something other than price is still thin. For properties with facilities and services that can promote the quality of the stay, this is an area where they can still differentiate using their existing stock.
For Hotels: Tips for Naming Long-Stay Plans
Most common selling points in multi-night plan names (N=1,446) ——
Multi-night discount 96%Breakfast included 32%Room only 27%Long stay / living 20%Eco (e.g., choice of housekeeping frequency) 18%Discount 13%
*These are trends based on published plan names and do not show that naming causes sales.
Related Articles
- Tokyo 23 Wards Supply Pressure 2026: Arakawa 16.0%, Minato Just 4.5%
- Japan Hotel Long-Stay Discounts: 15% at 7 Nights, 20% at 30 Nights
- Tokyo 2026: 2,055 New Rooms, 55.6% Business Hotels, ADR Turns Negative
References and Sources
■ Data Sources
MetroEngines Research property data and observed OTA listed prices (the 12 months from September 2025 to August 2026). Of the 104 domestic properties identified as long-stay by brand name, the 83 properties with 8,242 rooms whose listed prices were observed continuously during the period were aggregated. Plan names are the 1,446 distinct long-stay-related plan names tracked as active within the last 90 days. Operators’ property counts, room counts and opening schedules are quoted from published materials.
■ Calculation Assumptions
Listed prices are per-room rates for two guests sharing one room, tax included. Each property’s value is the median of its monthly values, and medians are calculated for each type. The 30-night equivalent is a reference value obtained by mechanically multiplying the lowest-plan listed price by 30 and does not reflect monthly-contract discounts, changes in housekeeping frequency or utility charges. This article does not use estimated settled rates (ADR) and is based consistently on listed prices.
■ Limitations
Type identification is based on brand names and is limited to what we could identify. Listed prices are shown on a two-guest basis; because residential units for 4-6 guests and single-occupancy rooms differ in floor area and capacity per room, the figures cannot be used to compare per-person value. Price differences by type are confounded by differences in location mix, so the article also presents a comparison limited to Tokyo. Operators’ published figures use different counting definitions and cannot be compared with one another.
■ Market Data
- MetroEngines Research — listed prices (September 2025 – August 2026, N=83 properties, 8,242 rooms), property master (104 identified properties), long-stay-related plan names (N=1,446)
■ Corporate Disclosures and Press Releases
- Apartment hotel “MIMARU” restarts new openings toward 3,000 rooms by 2030 (Daiwa House Group, August 26, 2026) [Japanese]
- Family-favored apartment hotel “MIMARU” accelerates expansion in the Osaka area (Cosmos Initia, March 2026) [Japanese]
- Citadines opens “Citadines North Shinjuku Tokyo” in Shinjuku on October 28, 2026 (The Ascott Japan) [Japanese]
- “Oakwood Oimachi Tracks Tokyo” opens June 25, 2026 [Japanese]
■ Market Research Reports