

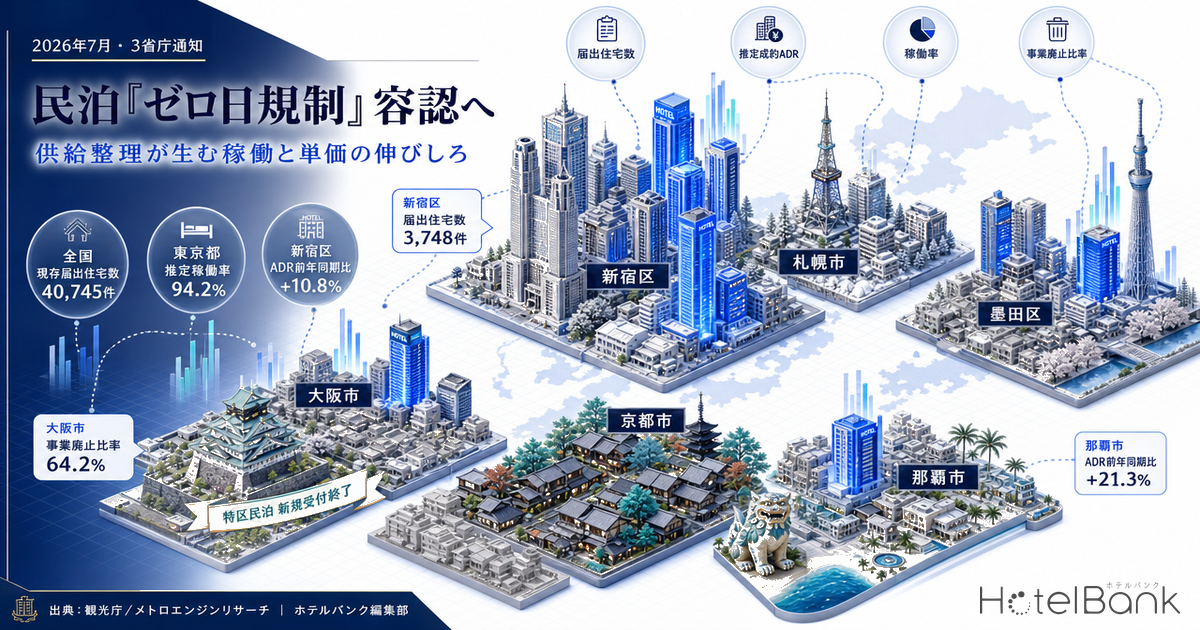
On July 15, 2026, three government bodies — the Japan Tourism Agency (JTA), the Ministry of Land, Infrastructure, Transport and Tourism (MLIT), and the Ministry of Health, Labour and Welfare (MHLW) — jointly issued a notice to local governments nationwide titled “On Zero-Day Regulations and Related Measures for Notified Dwellings under the Private Lodging Business Act (Technical Advisory).” The notice explicitly positions two measures as matters of municipal discretion: reducing permitted operating days to effectively zero by local ordinance, and mandating ICT-based management systems. In central urban wards and tourist cities where minpaku (private lodging) is concentrated, the composition of accommodation supply itself could shift. This article overlays private lodging registration statistics with hotel-side supply-demand data to read, area by area, what upside this supply consolidation creates for the occupancy and rates of existing hotels and ryokan.
- — The three-agency notice (July 15, 2026) clarifies that reducing operating days to effectively zero by ordinance, and mandating ICT-based management, both fall within municipal discretion. Tightening is not automatic — it takes effect asymmetrically, starting with the municipalities that actually pass ordinances.
- — 40,745 notified dwellings currently exist nationwide. The top 10 municipalities account for roughly 19,000 of them — about half the total — concentrated in Shinjuku Ward (3,748), Sapporo (2,895), Sumida Ward (2,426), and Osaka City (2,200).
- — Hotel ADR is rising precisely in the areas where minpaku clusters. Year-on-year change in the trailing 12-month average: Naha +21.3%, Chuo Ward of Sapporo +16.1%, Shibuya Ward +11.5%, Shinjuku Ward +10.8%.
- — The transmission channel differs by area. In Tokyo, Hokkaido, and Okinawa, where estimated occupancy exceeds 90%, supply consolidation feeds first into rate; in Osaka and Kyoto, in the 80% range, it feeds first into occupancy.
- — Osaka City closed new applications for special-zone minpaku on May 29, 2026. In a market that holds the bulk of the nation’s 23,452 certified units, the tap on new supply has been shut off — a driver of tighter inventory from the second half of 2026 onward.
Metric Definitions Used in This Article
- ADR (average daily rate): An estimated transacted rate (tax-exclusive equivalent) calculated by applying category-specific adjustment coefficients to the lowest publicly listed plan level on OTAs and similar channels (double occupancy, per-room rate, tax-inclusive). Cross-checked against property-level results disclosed by listed hotel REITs (91 properties, trailing three months), the median error is approximately 7%. These are estimates and differ from each property’s actual transacted prices or accounting figures. Area-level ADR is the median across the target properties (the level of a typical property in that area).
- OCC (occupancy rate): The share of sold rooms against total rooms in an area (an estimate based on OTA sales inventory; consistency checks against monthly REIT disclosures confirm accuracy generally within a few percentage points). It is an estimate based on the depletion of inventory sold on OTAs and differs from a property’s full actual occupancy. It is used only as a macro indicator at the prefectural and municipal level.
- Number of notified dwellings: The number of notified dwellings existing as of the aggregation date — notifications filed under the Private Lodging Business Act minus business terminations (JTA published figures).
- Data sources: MetroEngines Research; JTA “Status of Notifications and Registrations under the Private Lodging Business Act” and “Overnight Travel Statistics Survey”
The Ordinance Drawer the Three-Agency Notice Opened — Zero-Day Rules and ICT Management
Although this technical advisory takes the form of guidance under the Local Autonomy Act, in practice it substantially widens the design space available to municipalities drafting ordinances. Two points are central.
First is the acceptance of so-called “zero-day regulation.” The Private Lodging Business Act caps operations at 180 days per year while permitting ordinances to restrict areas and periods. Historically, however, the national government took a restrained stance toward regulations that would effectively reduce operating days to zero. The new notice clarifies that, to the extent reasonably deemed necessary, ordinances may impose siting restrictions — including prohibiting new private lodging operations and limiting operating days. For areas where impacts on the surrounding environment have already materialized, restrictions on existing notified dwellings are also listed among the available options.
Second is the ordinance-based mandating of ICT-enabled management systems. Concrete examples cited include monitoring via noise meters and cameras at entrances, and retention of data for a set period such as the preceding year. The aim is to secure after-the-fact verifiability, thereby deterring neighborhood disputes and enabling faster resolution. In addition, restrictions on check-in and check-out times and caps on facility capacity were both organized as measures available by ordinance.
What deserves emphasis here is that this notice addresses a different issue from “cracking down on illegal minpaku.” Enforcement against unregistered operations has long existed as a matter of applying the Hotel Business Act and the Private Lodging Business Act. What moved this time is the scope of institutional discretion — how far a municipality may design additional layers of regulation on lawfully notified private lodging businesses in light of local conditions. The extent to which removing unregistered and gray-zone properties lifts hotel rates is quantified separately in Illegal Minpaku Removal System Goes Live in FY2026: Estimating the ADR Uplift in Japan’s Five Largest Cities. The impact will therefore appear asymmetrically — in the areas where notified dwellings actually cluster, and in proportion to how each ordinance is applied.
| Measure permitted by ordinance | What the notice states | Implication for existing accommodation |
|---|---|---|
| Zero-day regulation (siting restrictions) | To the extent reasonably deemed necessary, new operations may be prohibited and operating days limited. Where harm has arisen, restrictions on existing businesses are also an option | In targeted zones, a net decline in alternative lodging supply is expected over the medium term |
| Mandatory ICT management | Monitoring via noise meters and entrance cameras; retention of data for a set period such as the preceding year | Operating costs rise for small operators, accelerating the winnowing of who stays in business |
| Restrictions on check-in/check-out times | Time-window restrictions may be set by ordinance | Late-night and early-morning arrivals shift back toward properties with staffed front desks |
| Caps on facility capacity | Occupancy caps may be set by ordinance | Group and large-party stays migrate toward ryokan and connecting rooms |
Source: JTA, “Notice Issued to Local Governments Regarding Minpaku” (July 15, 2026); compiled by the HotelBank Editorial Team
Where Minpaku Actually Clusters — A Map Drawn from Notified Dwelling Counts
To gauge the reach of the rule change, the first step is to confirm from primary statistics where notified dwellings physically exist. According to the JTA’s “Status of Notifications and Registrations under the Private Lodging Business Act” (as of May 15, 2026), cumulative notifications nationwide total 63,658, of which 22,913 have terminated operations, leaving 40,745 notified dwellings in existence. Registered private lodging management operators number 4,334, and registered brokers 64.
Those 40,745 units are not evenly distributed. The top 10 municipalities alone account for roughly 19,000 — about half the national total. The largest is Shinjuku Ward in Tokyo with 3,748, followed by Sapporo with 2,895, Sumida Ward with 2,426, Osaka City with 2,200, and Toshima Ward with 1,851. In other words, the real supply impact implied by the phrase “tighter minpaku regulation” is concentrated in a handful of wards and cities.
Source: JTA, “Status of Notifications and Registrations under the Private Lodging Business Act” (as of May 15, 2026); compiled by the HotelBank Editorial Team
Digging one layer deeper into the same data reveals differences in the character of each area: the ratio of terminated businesses to cumulative notifications — in effect, the intensity of churn. The national average is 36.0%, but Osaka City records 3,941 terminations against 6,141 notifications, a ratio reaching 64.2%. Sapporo also exceeds half at 50.6%. By contrast, Shinjuku Ward stands at 30.5%, Sumida Ward at 27.5%, and Naha at 19.3% — notifications there have settled in as durable stock.
This gap suggests differing response speeds when supply consolidation occurs. In high-churn areas, tighter rules bite mainly by suppressing new entry, and once the balance between terminations and new entries breaks, the stock turns to net decline quickly. In settled areas, by contrast, the pivot point is whether ordinances impose restrictions on existing businesses.
For Osaka, a separate regime also comes into play: the special-zone foreign-visitor accommodation business under the National Strategic Special Zones framework, commonly called special-zone minpaku. Osaka City received Prime Ministerial certification of an amendment to the “Kansai Region National Strategic Special Zone Area Plan” dated November 28, 2025, and ended new applications for special-zone minpaku as of May 29, 2026. Because already-certified facilities may continue operating as before, there is no immediate reduction in supply — but the tap on new supply has been closed. Nationwide, certified special-zone minpaku units totaled 23,452 as of the end of February 2026, the bulk of them concentrated in Osaka.
| Area | Notified dwellings May 15, 2026 |
Change vs. Jan 2026 |
Termination ratio |
Hotel-side ADR trailing 12-mo avg |
YoY change |
|---|---|---|---|---|---|
| Shinjuku Ward, Tokyo | 3,748 | +128 | 30.5% | ¥16,200 | +10.8% |
| Sapporo, Hokkaido (Chuo Ward) | 2,895 | +322 | 50.6% | ¥14,500 | +16.1% |
| Sumida Ward, Tokyo | 2,426 | +437 | 27.5% | ¥15,600 | +7.5% |
| Osaka City, Osaka (Chuo Ward) | 2,200 | +5 | 64.2% | ¥13,200 | +5.6% |
| Toshima Ward, Tokyo | 1,851 | — | 37.3% | ¥12,600 | +8.5% |
| Shibuya Ward, Tokyo | 1,622 | — | 40.8% | ¥25,000 | +11.5% |
| Taito Ward, Tokyo | 1,385 | +44 | 41.5% | ¥14,500 | +5.9% |
| Kyoto City, Kyoto (Shimogyo Ward) | 1,238 | +150 | 28.6% | ¥15,900 | +9.3% |
| Naha, Okinawa | 392 | +13 | 19.3% | ¥10,200 | +21.3% |
| Kutchan Town, Hokkaido | *included in Hokkaido’s 1,377 | — | — | ¥27,500 | +2.5% |
Notified dwellings and termination ratios from JTA, “Status of Notifications and Registrations under the Private Lodging Business Act.” ADR from MetroEngines Research (average of monthly estimated transacted ADR for July 2025–June 2026 / median number of target properties: Shinjuku Ward N=100, Chuo Ward of Sapporo N=133, Sumida Ward N=29, Chuo Ward of Osaka N=192, Toshima Ward N=62, Shibuya Ward N=33, Taito Ward N=176, Shimogyo Ward of Kyoto N=164, Naha N=141, Kutchan Town N=21). Government-designated cities and Hokkaido are aggregated using a representative ward. Compiled by the HotelBank Editorial Team
What the two rightmost columns show is that in precisely those areas where minpaku clusters, hotel-side estimated transacted ADR has tracked above the prior year for the trailing 12 months. Naha is up 21.3%, Chuo Ward of Sapporo 16.1%, Shibuya Ward 11.5%, and Shinjuku Ward 10.8%. Even in a market with an already high rate level, such as Kutchan Town, the figure holds above the prior year at +2.5%. Starting from the fact that hotel rates are rising even while minpaku coexists helps avoid over- or under-estimating the effect of supply consolidation. Which price bands and guest segments distributed supply has actually absorbed is examined in depth across the three markets of Kyoto, Okinawa, and Tokyo in Minpaku Hits 10% of Inbound Stays: Kyoto, Okinawa, Tokyo Analysis.
Hotel-Side Supply and Demand — Inventory Is Already Thin, and Rate Upside Lies Beyond It
So how much inventory remains on the hotel and ryokan side to absorb demand when supply is consolidated? Two yardsticks are used together here. One is the official room occupancy rate from the JTA’s “Overnight Travel Statistics Survey”; the other is the estimated occupancy rate based on OTA-listed inventory compiled by MetroEngines Research. The former covers the macro level nationally and by facility type; the latter provides granularity at the area × category level.
According to the JTA’s first preliminary report for May 2026, the national room occupancy rate was 60.6% (down 1.1 points year on year). By facility type, business hotels held a high 74.1% (-1.6 pt) and city hotels 72.6% (-2.4 pt), while ryokan at 41.7% (+3.2 pt) and resort hotels at 59.3% (+5.0 pt) came in above the prior year. Simple lodgings stood at 28.9% (-0.8 pt). Total guest nights were 53.39 million (down 4.8% year on year), of which foreign visitors accounted for 13.82 million (down 13.4%).
| Facility type | Room occupancy May 2026 |
YoY change | How to read it |
|---|---|---|---|
| Business hotels | 74.1% | -1.6pt | Highest of all types. In central urban areas, effectively sold-out days accumulate at this level |
| City hotels | 72.6% | -2.4pt | Sustains high occupancy. Can absorb large-party and extended stays |
| Resort hotels | 59.3% | +5.0pt | Improved from the prior year; the recovery in domestic leisure demand contributes |
| Ryokan | 41.7% | +3.2pt | Largest gain, and the widest remaining headroom for occupancy |
| Simple lodgings | 28.9% | -0.8pt | The category that absorbs conversions from minpaku. Ample occupancy headroom |
| Total | 60.6% | -1.1pt | Total guest nights 53.39 million (down 4.8% year on year) |
Source: JTA, “Overnight Travel Statistics Survey,” May 2026, first preliminary report; compiled by the HotelBank Editorial Team
Next, narrowing to minpaku-cluster areas, consider estimated occupancy by category. Aggregating check-in dates in June 2026, Tokyo reaches 94.2% on an all-property basis (1,336 properties, 181,869 rooms). By category, capsule stands at 97.8% (26 properties), deluxe at 95.9% (39 properties), business at 93.7% (861 properties), and city at 92.9% (100 properties). Even ryokan reach 89.7% (34 properties).
Source: MetroEngines Research; compiled by the HotelBank Editorial Team (June 2026 check-ins; estimate based on OTA-listed inventory)
Hokkaido follows at 93.2% (1,316 properties) and Okinawa at 91.7% (1,136 properties), with Kyoto at 87.5% (967 properties) and Osaka at 85.6% (695 properties). Osaka’s somewhat lower level likely reflects the payback from large-scale event demand in 2025, compounded by the depth of alternative supply including special-zone minpaku.
It is worth being careful about the direction of causation here. In areas and categories where occupancy exceeds 90%, there is already little room to accept additional demand. If alternative supply thins under these conditions, displaced demand flows to existing properties — but the room count does not grow, so the adjustment happens through price rather than volume. In other words, the effect of supply consolidation is more likely to appear as rising rates than as rising occupancy. Conversely, in areas or categories with occupancy in the low 80s, the build-up of occupancy comes first and pass-through to rate follows. The same regulatory change therefore transmits in a different order depending on the area.
The rate trajectory is also worth confirming. For Shinjuku Ward, which has the largest minpaku count nationwide, overlaying monthly estimated transacted ADR by year shows that the shape of the seasonal peaks and troughs is largely unchanged while the level alone steps up year after year.
Source: MetroEngines Research; compiled by the HotelBank Editorial Team (Shinjuku Ward / median number of target properties N=100)
The waveform — peaks in the busy March–April stretch and the November foliage season, troughs in June and January — is common across the three years. The level, however, has stepped up from ¥12,400 in June 2024 to ¥20,700 by April 2026. Stripping out seasonality, the underlying trend is +10.8% year on year on a trailing 12-month average.
Extending the same calculation to 13 major areas, every one of them came in above the prior year. A configuration in which rates are rising in markets whose occupancy is already elevated means the ground is prepared for that growth to accelerate should supply consolidation occur.
Source: MetroEngines Research; compiled by the HotelBank Editorial Team (average monthly estimated transacted ADR for July 2025–June 2026 and its year-on-year change)
As a reference point, results disclosed by listed hotel REITs are instructive. Invincible Investment Corporation (インヴィンシブル投資法人) reported June 2026 operating results for 101 domestic hotels: occupancy of 82.7% as of June 2026 (disclosed actuals, N=101 properties; 82.8% in the same month a year earlier), ADR of ¥12,412 (down 3.9% year on year), and RevPAR of ¥10,264 (down 4.0%). The portfolio centers on limited-service hotels nationwide, and occupancy is holding roughly flat year on year while rate is in an adjustment phase. Even on a disclosure basis, one can confirm the shared theme: how to design rate when the ceiling on occupancy is near.
When Minpaku Slots Are Squeezed, Which Formats Step Up?
Reading supply consolidation as an opportunity requires a view on who fills the vacated slots. In locations where filing a private lodging notification becomes difficult, operators’ options converge on either conversion to simple lodging operations under the Hotel Business Act, or exit. It is worth checking here the composition of formats actually appearing in the market as new openings.
Aggregating by year and category the newly opened facilities that MetroEngines Research identifies on an OTA-listing-confirmed basis, the largest count belongs consistently to vacation rentals: 725 in 2023, 831 in 2024, and 720 in 2025, holding above 700 per year. Guesthouses have trended down at 205, 180, and 115; hostels have been roughly flat at 107, 93, and 96; and machiya have moved between 27, 38, and 27. Business hotels have been resilient at 244, 215, and 264.
Source: MetroEngines Research & Consulting (OTA-listing-confirmed basis); compiled by the HotelBank Editorial Team. *2026 is a partial-year count. Because OTA listings appear several months before opening, counts for the most recent years will increase as further listings are confirmed
The depth of the vacation rental segment shows that the main battleground for alternative supply has shifted from single units in residential neighborhoods toward whole-house rentals and group stays. Ordinance requirements such as capacity caps and ICT management would naturally apply to whole-house properties as well, but the cost of resident management and recording equipment is easier to absorb where the room rate is higher and party sizes are larger. The stricter the ordinances, therefore, the more natural it is to expect alternative supply to shift from “small, low-rate, dispersed” toward “mid-sized, high-rate, consolidated.”
This structural shift carries two implications for existing hotels and ryokan. One is that for business hotels, capsule hotels, and simple lodgings that have competed with minpaku in the room-only, low-rate band, price competition pressure eases. The other is that in the four-or-more-guest group-stay segment, competition with whole-house rentals persists, leaving headroom in product design for large parties — connecting rooms, Japanese-Western rooms, and the large rooms typical of ryokan. In this context, the fact that ryokan occupancy stands at 41.7% in JTA statistics (May 2026, first preliminary report), leaving far more headroom than other types, reads as an opportunity.
A Map of the Opportunity — Factoring In Differences in Municipal Appetite
Finally, a framework for translating this into operator and investor decisions. This technical advisory merely clarifies municipal discretion in designing ordinances; regulation is not automatically tightened. Enacting or amending an ordinance requires a council vote, and judgment reflecting local conditions enters the process. The impact will therefore appear not as a uniform national shift but as differences in appetite across municipalities.
Three practical signals help read that appetite. First, the absolute level of notified dwellings and the recent pace of increase. In clusters such as Shinjuku Ward (3,748), Sapporo (2,895), and Sumida Ward (2,426), resident petitions readily become the motive for amending ordinances. Sumida Ward in particular added 437 units in the four months from January to May 2026 — a pace well above the national increase rate of 6.9%. Second, the termination ratio. In high-churn areas such as Osaka City (64.2%) and Sapporo (50.6%), suppressing new entry translates directly into net decline. Third, whether the municipality already operates its own ordinance ahead of the curve. Municipalities such as Kyoto City, which has limited operating periods in exclusively residential zones, have ample room to refine their application of the rules in light of this advisory.
On that basis, the moves available to existing properties can be organized along both rate and occupancy. In areas where occupancy exceeds 90% — specifically Tokyo (94.2%), Hokkaido (93.2%), and Okinawa (91.7%), all on a June 2026 check-in estimated-occupancy basis — supply consolidation works mainly through rate in the business, city, and capsule segments. The upside here depends on how finely lead-time-based pricing can be designed for peak dates. As Shinjuku Ward’s monthly trajectory shows, the April and November peaks have already risen to around ¥20,000, and there is room to build those peaks higher still.
In areas with occupancy in the 80s — for example Osaka (85.6%) and Kyoto (87.5%), likewise on a June 2026 check-in basis — the build-up of occupancy comes first. Osaka adds a clear supply-side change in the end of new special-zone minpaku applications, so inventory is expected to tighten further from the second half of 2026 into 2027. In Kyoto, ryokan estimated occupancy stands at 86.6% as of June 2026 (estimate; Kyoto Prefecture ryokan category aggregate, N=127 properties), giving ryokan a larger presence than in other areas. This is also a segment that competes with whole-house rentals for large-party stays, so designing stay value including cuisine and experiences translates directly into rate upside.
| Estimated occupancy June 2026 check-ins, by prefecture |
Settled type (termination ratio under 40%) | Churn type (termination ratio 40% or above) |
|---|---|---|
| Above 90% Tokyo 94.2% / Hokkaido 93.2% / Okinawa 91.7% |
Shinjuku Ward 30.5% · Sumida Ward 27.5% · Naha 19.3% Channel: rate (immediate) Notifications have settled in as stock, so the pivot is whether ordinances add restrictions on existing businesses. With little room left in inventory, the adjustment happens through price. |
Sapporo 50.6% · Taito Ward 41.5% · Shibuya Ward 40.8% Channel: rate (accelerated) High churn means suppressing new entry alone flips the stock to net decline quickly. With the occupancy ceiling near, this feeds straight into rate. |
| 85–90% Kyoto 87.5% / Osaka 85.6% |
Shimogyo Ward, Kyoto 28.6% Channel: occupancy → rate An early-mover municipality that has limited operating periods in exclusively residential zones. Ample room to refine application in light of this advisory, with occupancy build-up coming first. |
Osaka City 64.2% Channel: occupancy (from H2 2026) On top of the highest termination ratio nationally, the end of new special-zone minpaku applications overlaps. The only area where the supply tap closes twice over. |
Estimated occupancy from MetroEngines Research (June 2026 check-ins; estimate based on OTA-listed inventory); notified dwellings and termination ratios from JTA, “Status of Notifications and Registrations under the Private Lodging Business Act” (as of May 15, 2026). Compiled by the HotelBank Editorial Team
What this matrix shows is that even if municipalities enact the same ordinance in response to the same notice, the form in which it reaches existing properties splits four ways. The vertical axis — occupancy — separates markets that can only adjust through price from those that can still absorb through volume. The horizontal axis — termination ratio — separates markets where suppressing new entry alone shrinks supply from those that require restrictions on existing businesses. The first thing to establish in any investment or operating decision is which of these four quadrants the target area sits in.
Resort markets such as Kutchan Town call for a different reading. Trailing 12-month average estimated transacted ADR stands at ¥27,500 — among the highest in Japan — and jumps above ¥60,000 in winter. Alternative supply in this market consists mainly of condominiums and whole-house rentals, and the supply impact of development and unit sales activity outweighs that of regulation based on private lodging notifications. Rather than applying the regulatory change uniformly, judgment should follow a review of each market’s supply structure.
Taken together, the three-agency notice of July 2026 is best positioned as institutional support for the transition of accommodation supply from a phase of quantitative expansion to one of qualitative consolidation. When part of the 40,745 notified dwellings that make up alternative supply is consolidated, existing hotels and ryokan — whose occupancy has already built to around 90% — will see the opportunity arrive in the form of rate redesign. Getting ahead of which areas and which categories receive that opportunity, and in what order, from both notification statistics and occupancy and rate data, will determine the precision of decisions from here.
Note on data use: The estimated occupancy rates in this article are estimates based on the depletion of inventory sold on OTAs and differ from properties’ full actual occupancy. They are used only as macro indicators at the prefectural level; occupancy for individual properties is not calculated. Estimated transacted ADR is an estimate with a median error of approximately 7% when cross-checked against property-level disclosures by listed hotel REITs. In addition, new opening counts are aggregated on an OTA-listing-confirmed basis, and because listings appear several months before opening, counts for the most recent years will increase as further listings are confirmed.
Related Articles
- Simple Lodging × Vacant Home Reuse 2026: Kyoto, Osaka & Naha Whole-House IRR
- Vacation Rentals Lead Japan’s 2026 Hotel Supply — 48.2% of 758 New Openings
- Minpaku Hits 10% of Inbound Stays: Kyoto, Okinawa, Tokyo Analysis
- Illegal Minpaku Removal System Goes Live in FY2026: Estimating the ADR Uplift in Japan’s Five Largest Cities
- Toshima Halts 23 Minpaku, OTA Purge FY2026: ADR Shift Scenarios
- Vacation Rentals Take 45% of Japan’s 2026 New Hotel Openings (247 Villas)
References and Sources
■ Regulatory and primary sources
- JTA, “Notice Issued to Local Governments Regarding Minpaku — On the Issuance of ‘Zero-Day Regulations and Related Measures for Notified Dwellings under the Private Lodging Business Act (Technical Advisory)'” (July 15, 2026)
- JTA Minpaku Portal Site, “Implementation Status of the Private Lodging Business Act” / “Status of Notifications and Registrations under the Private Lodging Business Act” (as of May 15, 2026 and January 15, 2026)
- Osaka City, “On the End of New Applications for the Osaka City National Strategic Special Zone Foreign Visitor Accommodation Business”
■ Government statistics
- JTA, “Overnight Travel Statistics Survey (April 2026 second preliminary report, May 2026 first preliminary report, and 2025 annual figures (final))”
- JTA, “Overnight Travel Statistics Survey” statistics top page
■ Market data
- MetroEngines Research — estimated transacted ADR (by municipality, monthly); estimated occupancy based on OTA-listed inventory (by prefecture × category)
- MetroEngines Research & Consulting (OTA-listing-confirmed basis) — annual counts of newly opened facilities by category
■ REIT disclosures
■ Press coverage