

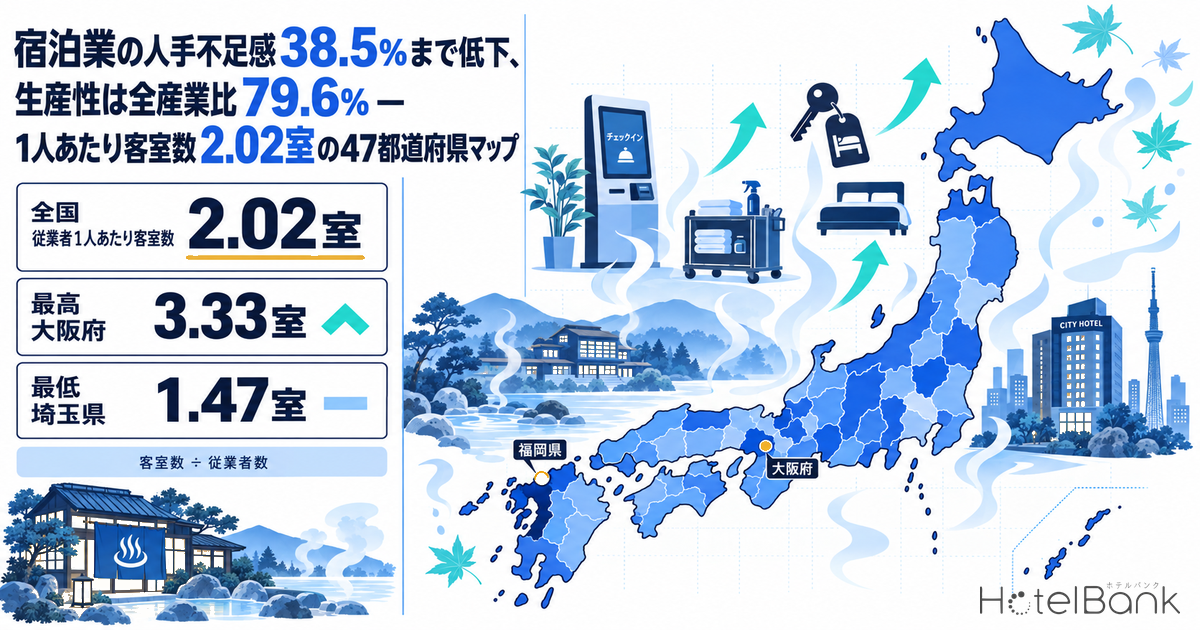
The wage-hike debate in Japan’s hotel industry has so far centered on the numerator: how much must room rates rise to absorb higher labor costs? But the labor productivity formula also has a denominator — the operational design side, i.e. how many rooms a single employee can handle. This article combines the Ministry of Finance’s Financial Statements Statistics of Corporations by Industry, the Economic Census by the Ministry of Internal Affairs and Communications (MIC) and the Ministry of Economy, Trade and Industry (METI), and the nationwide room stock tracked by MetroEngines Research to quantify accommodation-industry productivity from the denominator side.
Metric Definitions Used in This Article
- Labor productivity (value added per employee): value added ÷ (average number of employees during the period + average number of officers during the period), calculated from fiscal-year figures in the Ministry of Finance’s Financial Statements Statistics of Corporations by Industry. The survey is a sample survey of corporations capitalized at ¥10 million or more; because the accommodation sample is small, figures fluctuate considerably from year to year.
- Rooms per employee: room stock in a prefecture ÷ number of accommodation-industry employees. Room stock covers operating properties tracked by MetroEngines Research (as of September 2026, N=27,162 properties); employee counts are from the 2021 (June 2021) Economic Census for Business Activity, industry sub-division “75 Accommodations”. Because the two sources differ in survey date and coverage, the ratio is used for relative comparison between prefectures, not as an absolute level.
- Minimum wage: the revised amounts recommended in the Ministry of Health, Labour and Welfare (MHLW) “FY2026 Regional Minimum Wage Recommendations” (published September 3, 2026). Effective dates vary by prefecture from October 1 to December 2, 2026, and amounts may change following objections after the recommendations are announced.
- Data sources: MetroEngines Research (room stock) / Ministry of Finance, MIC, METI and MHLW (official statistics)
- — Value added per accommodation employee reached ¥6.03 million, 79.6% of the all-industry level (FY2025) — the highest ratio since FY2014.
- — Nationwide, there are 2.02 rooms per employee. This closely matches the 2.08 rooms per employee tabulated directly in the 2016 Economic Census, supporting the validity of the level.
- — Prefectures range from 1.47 to 3.33 rooms, a 2.3x spread. The correlation with the room share of properties with 101+ rooms is +0.63; the correlation with the minimum wage is just +0.14, effectively none.
- — 75.0% of properties have 50 rooms or fewer, yet 59.2% of rooms sit in properties with 101+ rooms. The effective levers differ completely by size band.
- — From October 2026, the national weighted-average minimum wage will be ¥1,177 (+¥56). Wage increases can be absorbed not only through pricing but also through how many rooms each employee is designed to handle.
Looking at Labor Productivity from the Denominator — “Rooms per Employee” as a Proxy for Operational Efficiency
Labor productivity is defined as value added divided by the number of employees. For the accommodation industry specifically, the formula can be decomposed as follows.
Value added per employee = (rooms ÷ employees) × 365 × occupancy × ADR × value-added ratio
*A simplified formula covering the rooms division only; food & beverage, banquet and other revenue are excluded. The three terms on the right (occupancy, ADR, value-added ratio) belong to the demand and pricing side, while the leftmost term, (rooms ÷ employees), belongs to the operational design side.
The three terms on the right concern demand and pricing — for example, how far ADR would need to rise to pass the 2026 minimum wage increase through to guests. This article does not revisit them and focuses solely on the leftmost term: how many rooms each employee handles. Because this ratio directly reflects how operating workflows are designed, it is also one of the few variables that can be moved without changing room rates.
According to Teikoku Databank’s “Survey on Corporate Trends Regarding Labor Shortages (April 2026)”, the share of ryokan and hotel companies reporting a shortage of non-regular staff fell to 38.5% — back in the 30% range for the first time in four years and two months, since February 2022. Teikoku Databank attributes this to productivity gains from digitalization (DX) and the spread of on-demand “spot work” staffing. With hiring conditions easing, now looks like a good moment to revisit the denominator side.
Value Added per Accommodation Employee Hits ¥6.03 Million — 79.6% of All Industries, the Highest Since FY2014
The chart below compares value added per employee for the accommodation industry and for all industries (excluding finance and insurance) by fiscal year, based on the Ministry of Finance’s Financial Statements Statistics of Corporations by Industry. In FY2025, the accommodation industry stood at ¥6.03 million versus ¥7.58 million for all industries, a ratio of 79.6%. Compared with 63.1% in FY2019 and 37.4% in FY2020, the recovery has been substantial.
Source: Compiled by HotelBank Editorial Team from Ministry of Finance, Financial Statements Statistics of Corporations by Industry (time-series data)
Tracking the figures year by year, the step change occurred between FY2023 and FY2024. The accommodation industry was at ¥4.09 million (59.4% of all industries) in FY2023, jumped to ¥5.61 million (77.3%) in FY2024, and rose further to ¥6.03 million (79.6%) in FY2025. The recovery in inbound demand and higher room rates lifted value added, while employee numbers have not returned to pre-COVID levels. The ratio improved because the numerator grew while the denominator was held down.
| Fiscal year | Accommodation (¥10k per employee) | All industries (¥10k per employee) | Ratio to all industries |
|---|---|---|---|
| FY2018 | 474 | 647 | 73.3% |
| FY2019 | 400 | 633 | 63.1% |
| FY2021 | 246 | 641 | 38.4% |
| FY2023 | 409 | 688 | 59.4% |
| FY2024 | 561 | 726 | 77.3% |
| FY2025 | 603 | 758 | 79.6% |
Source: Compiled by HotelBank Editorial Team from Ministry of Finance, Financial Statements Statistics of Corporations by Industry (time-series data). Value added ÷ (average employees + average officers during the period)
These figures cannot, however, be read at face value as the industry’s true capability. The survey is a sample survey, and the average number of accommodation employees swung sharply from 731,000 in FY2024 to 548,000 in FY2025. Because the figures include noise from sample rotation, they are best read as a multi-year direction rather than as single-year levels. As a direction, it is clear that the ratio has surpassed FY2018’s 73.3% and reached its highest level since FY2014.
2.02 Rooms per Employee Nationwide — Closely Matching the Figure Tabulated Directly in Official Statistics
Next, we turn to measuring the denominator. MetroEngines Research tracks 27,162 operating properties with 1,266,919 rooms (as of September 2026). Dividing this by the 625,912 accommodation-industry employees (45,072 establishments) in the 2021 Economic Census for Business Activity gives 2.02 rooms per employee.
Whether this ratio is reasonable can be cross-checked within official statistics. The 2016 Economic Census for Business Activity directly tabulated rooms and employees for “751 Hotels and ryokan”: 991,925 rooms ÷ 476,731 employees = 2.08 rooms per employee. Two routes that differ in survey year and coverage land at almost the same level. Even allowing for differences in the underlying populations, a level of around 2.0 rooms can be regarded as capturing how the accommodation industry actually operates.
Note also that the number of accommodation-industry employees fell 7.8%, from 678,833 in 2016 to 625,912 in 2021 (both Economic Census, industry sub-division 75). Over the same period, room stock kept accumulating, mainly in urban areas. With the denominator shrinking, the number of rooms handled per employee is structurally trending upward.
75% of Properties Have 50 Rooms or Fewer — Yet 59% of Rooms Are in Properties with 101+ Rooms
Breaking down the nationwide room stock by size band reveals very different pictures depending on whether you count properties or rooms. Properties with 50 rooms or fewer number 20,377, or 75.0% of the total, but they hold only 299,254 rooms, 23.6% of the total. Conversely, properties with 201+ rooms number just 1,234 (4.5%) yet hold 380,939 rooms (30.1%).
Source: Compiled by HotelBank Editorial Team from MetroEngines Research (based on confirmed OTA listings, N=27,162 properties / 1,266,919 rooms, as of September 2026)
| Size band | Properties | Property share | Rooms | Room share | Avg. rooms per property |
|---|---|---|---|---|---|
| Up to 50 rooms | 20,377 | 75.0% | 299,254 | 23.6% | 14.7 rooms |
| 51–100 rooms | 2,956 | 10.9% | 217,558 | 17.2% | 73.6 rooms |
| 101–200 rooms | 2,595 | 9.6% | 369,168 | 29.1% | 142.3 rooms |
| 201+ rooms | 1,234 | 4.5% | 380,939 | 30.1% | 308.7 rooms |
Source: Compiled by HotelBank Editorial Team from MetroEngines Research (based on confirmed OTA listings, N=27,162 properties)
By property type, the distribution diverges further. Of the 644,066 business hotel rooms, 204,322 are in properties with 201+ rooms and 256,964 in the 101–200 band, so large and mid-sized properties dominate. Ryokan, by contrast, have 116,703 of their 179,897 rooms (64.9%) in properties with 50 rooms or fewer. City hotels concentrate 99,822 of their 176,313 rooms in properties with 201+ rooms, while resort hotels’ 94,357 rooms are spread relatively evenly across the four size bands. Even within the single “accommodation industry”, the room for redesigning the denominator is a different matter for each property type (all breakdowns by type from MetroEngines Research, N=27,162 properties / 1,266,919 rooms, as of September 2026).
Prefectures with a Higher Share of Rooms in Large Properties Have More Rooms per Employee (Correlation +0.63)
The hypothesis that “larger properties find it easier to raise rooms per employee” cannot be tested property by property, because property-level employee counts are not published. Rather than asserting a conclusion based on estimates, we test it within the range of published statistics, using prefectures as the unit.
Across the 47 prefectures, the correlation between the room share of properties with 101+ rooms and rooms per employee is +0.63. For the share of properties with 201+ rooms it is +0.68, and for the share of properties with 50 rooms or fewer it is −0.56. Re-sorting by quartile of large-property room share reveals a nearly monotonic relationship, as shown below.
The % on the horizontal axis is the median “room share of properties with 101+ rooms” among prefectures in each quartile. Source: Compiled by HotelBank Editorial Team from MetroEngines Research (room stock) / MIC and METI, 2021 Economic Census for Business Activity (accommodation employees). N=47 prefectures
The 11 prefectures with the lowest large-property room share (median 36.7%) have a combined 1.78 rooms per employee, versus 2.30 for the 12 with the highest (median 68.0%) — a 29% gap. The second quartile dips slightly to 1.76, so the increase is not strictly monotonic, but the jump in the top quartile is unmistakable.
This relationship cannot, however, be attributed solely to a “scale effect”. Prefectures with a high large-property room share are dominated by urban business and city hotels, whose business models do not assume two meals per stay. Scale and property type push in the same direction, and the two cannot be separated within published statistics. What can be read is only that the combination of scale and property type strongly shapes the denominator.
Minimum Wage × Rooms per Employee — Splitting the 47 Prefectures into Four Quadrants
On September 3, 2026, the MHLW published the recommended regional minimum wages for all 47 prefectures. The national weighted average is ¥1,177, up ¥56 from ¥1,121 in the previous fiscal year. The new rates take effect in stages between October 1 and December 2, 2026. The map below plots the recommended wage on the horizontal axis and rooms per employee on the vertical axis, divided at the respective medians (¥1,108 / 1.88 rooms).
Source: Compiled by HotelBank Editorial Team from MHLW, “FY2026 Regional Minimum Wage Recommendations” (September 3, 2026) / MetroEngines Research (room stock) / MIC and METI, 2021 Economic Census for Business Activity. N=47 prefectures
The upper-right quadrant contains 12 prefectures where large urban hotels cluster, including Osaka (¥1,231, 3.33 rooms), Fukuoka (¥1,114, 3.06 rooms), Aichi (¥1,195, 2.55 rooms) and Kyoto (¥1,180, 2.31 rooms). Wages are high, but each employee already handles many rooms, so these markets have built room to absorb wage increases on the operational efficiency side.
By contrast, the 23 prefectures in the lower-left and lower-right quadrants still have substantial headroom on the denominator side. Especially in areas such as Kanagawa (¥1,279, 1.59 rooms), Saitama (¥1,196, 1.47 rooms) and Hyogo (¥1,172, 1.54 rooms), where wages are above the median but rooms per employee are below it, redesigning operations is likely to translate directly into higher productivity.
| Quadrant | Prefecture (minimum wage, rooms per employee) |
|---|---|
| High wage × high rooms per employee 12 prefectures | Osaka (¥1,231, 3.33 rooms) / Fukuoka (¥1,114, 3.06 rooms) / Aichi (¥1,195, 2.55 rooms) / Kyoto (¥1,180, 2.31 rooms) / Hokkaido (¥1,131, 2.26 rooms) / Hiroshima (¥1,141, 2.26 rooms) / Toyama (¥1,119, 2.25 rooms) / Tokyo (¥1,280, 2.09 rooms) / Chiba (¥1,195, 1.97 rooms) / Ishikawa (¥1,113, 1.95 rooms) / Niigata (¥1,108, 1.94 rooms) / Gunma (¥1,120, 1.92 rooms) |
| Standard wage × high rooms per employee 12 prefectures | Kagawa (¥1,092, 2.53 rooms) / Miyagi (¥1,098, 2.36 rooms) / Okayama (¥1,104, 2.32 rooms) / Okinawa (¥1,086, 2.19 rooms) / Miyazaki (¥1,085, 2.12 rooms) / Ehime (¥1,093, 2.12 rooms) / Aomori (¥1,090, 2.05 rooms) / Tokushima (¥1,103, 1.99 rooms) / Nagasaki (¥1,087, 1.96 rooms) / Kagoshima (¥1,090, 1.89 rooms) / Akita (¥1,090, 1.88 rooms) / Oita (¥1,096, 1.88 rooms) |
| High wage × large headroom 12 prefectures | Nagano (¥1,117, 1.80 rooms) / Mie (¥1,143, 1.79 rooms) / Gifu (¥1,121, 1.78 rooms) / Tochigi (¥1,125, 1.72 rooms) / Ibaraki (¥1,136, 1.67 rooms) / Fukui (¥1,112, 1.64 rooms) / Shizuoka (¥1,154, 1.61 rooms) / Kanagawa (¥1,279, 1.59 rooms) / Yamanashi (¥1,113, 1.59 rooms) / Hyogo (¥1,172, 1.54 rooms) / Shiga (¥1,136, 1.53 rooms) / Saitama (¥1,196, 1.47 rooms) |
| Standard wage × large headroom 11 prefectures | Yamaguchi (¥1,101, 1.82 rooms) / Iwate (¥1,090, 1.80 rooms) / Tottori (¥1,090, 1.80 rooms) / Kochi (¥1,086, 1.76 rooms) / Yamagata (¥1,092, 1.75 rooms) / Saga (¥1,095, 1.75 rooms) / Kumamoto (¥1,092, 1.74 rooms) / Wakayama (¥1,101, 1.73 rooms) / Fukushima (¥1,094, 1.71 rooms) / Shimane (¥1,092, 1.65 rooms) / Nara (¥1,107, 1.55 rooms) |
Source: Compiled by HotelBank Editorial Team from MHLW, “FY2026 Regional Minimum Wage Recommendations” / MetroEngines Research / MIC and METI, 2021 Economic Census for Business Activity
Note that the correlation between the minimum wage and rooms per employee is +0.14, effectively zero. Higher-wage regions do not automatically have higher operational efficiency. It is precisely because the two are determined independently that reading them in four quadrants is meaningful.
Investments That Work on the Denominator — Self Check-in, Housekeeping Flow and Longer Stays
Investments that raise rooms per employee fall into three broad groups. All of them take the existing room stock as given and restructure only the operating workflow.
First, reducing front-desk staffing. Self check-in kiosks and smart locks make it possible to thin out round-the-clock staffing in late-night and early-morning hours. As noted above, properties with 50 rooms or fewer account for 75.0% of the national total, and in this size band front-desk staff weigh heavily as a fixed cost. The lower a size band’s rooms per employee, the greater the impact of each staffed time slot that can be cut.
Second, redesigning housekeeping flow. Housekeeping is the largest block of labor input in the accommodation industry, and the number of rooms each person can turn over depends on room layout, linen room location and check-out time design. For the same number of rooms, shorter flows mean a smaller denominator. The 101–200 room band (2,595 properties / 369,168 rooms) is large enough to organize teams floor by floor while still capturing the scale benefits of centralization, making it the range where this investment is likely to pay off most.
Third, encouraging longer stays. Multi-night stays reduce the number of cleanings in the first place. Compared with filling a two-night stay with two separate one-night guests, only one full cleaning is needed and check-in/check-out handling is halved. Long-stay plans are typically priced lower per night, but because labor input per room falls at the same time, they still act as a smaller denominator in the productivity formula.
All three can be implemented without changing room rates. Combined with pricing measures, they widen the room to absorb wage increases even further. Staff housing, which shapes how far a property can recruit from, is a further related lever that lies outside the scope of this article.
Summary
Value added per accommodation employee reached ¥6.03 million in FY2025, 79.6% of the all-industry level and the highest ratio since FY2014. The recovery on the numerator side is well underway. Turning to the denominator, there are 2.02 rooms per employee nationwide, with a 2.3x spread from 1.47 to 3.33 rooms across prefectures.
Much of this spread can be explained by the size and property-type composition of the room stock. The correlation between the room share of properties with 101+ rooms and rooms per employee was +0.63, and the gap between the top and bottom quartiles of large-property room share was 29%. The correlation with the minimum wage, meanwhile, was +0.14 — essentially unrelated. In other words, the burden of wage increases is set by region, but the operational efficiency that absorbs it is set by design, not by region.
From October 2026, the national weighted-average minimum wage will be ¥1,177. Pricing on the numerator side is already something every operator is working on; the differentiator from here is likely to be the design side — running the same number of rooms with fewer steps. The structure in which 75.0% of properties have 50 rooms or fewer while 59.2% of rooms sit in properties with 101+ rooms shows that each size band needs a completely different set of measures.
Related Articles
- Japan Minimum Wage 2026: Chiba & Aichi ¥1,195, Oct 1-15 Rollout
- Japan’s Customer Harassment Mandate Oct 1: The 14.0% Retention Upside
References and Sources
■ Data sources
Labor productivity is based on the fiscal-year time series of the Ministry of Finance’s Financial Statements Statistics of Corporations by Industry (value added ÷ average employees + officers during the period). Employee counts are from the MIC/METI Economic Census for Business Activity, industry sub-division 75 “Accommodations” (2021, as of June 2021: 45,072 establishments and 625,912 employees nationwide). Room stock covers operating properties tracked by MetroEngines Research (based on confirmed OTA listings, N=27,162 properties / 1,266,919 rooms, as of September 2026). Minimum wages are the amounts recommended in the MHLW “FY2026 Regional Minimum Wage Recommendations” (published September 3, 2026).
■ Calculation assumptions
Rooms per employee = room stock in the prefecture ÷ accommodation-industry employees. Because the numerator (as of September 2026) and denominator (as of June 2021) differ in both survey date and coverage, the ratio is used for relative comparison between prefectures rather than as an absolute level. Size bands are divided into four groups: up to 50 / 51–100 / 101–200 / 201+ rooms. Quartiles are formed by sorting the 47 prefectures by “room share of properties with 101+ rooms” and computed from each group’s aggregate (total rooms ÷ total employees). The four quadrants are divided at the medians of the minimum wage and rooms per employee (¥1,108 / 1.88 rooms). Correlation coefficients are Pearson product-moment correlations, N=47 prefectures.
■ Limitations
The Financial Statements Statistics of Corporations by Industry is a sample survey of corporations capitalized at ¥10 million or more; the accommodation sample is small and fluctuates considerably from year to year (average employees: 731,000 in FY2024 → 548,000 in FY2025). Figures should be read as a multi-year direction rather than single-year levels. Economic Census employee counts cover the entire accommodation industry (industry sub-division 75), including simple lodging and other facilities besides ryokan and hotels. Because property-level employee counts are not published, the relationship between scale and rooms per employee is limited to prefecture-level correlation, and the effect of scale cannot be separated from that of property-type composition. Minimum wages are recommended amounts and may change following objections.
■ Official statistics
- MHLW, “FY2026 Regional Minimum Wage Recommendations” (published September 3, 2026; in Japanese)
- Ministry of Finance, “Financial Statements Statistics of Corporations by Industry: Time-Series Data (industries other than finance and insurance)” (e-Stat table ID: 0003060791)
- MIC and METI, “2021 Economic Census for Business Activity: Private establishments and employees by industry (sub-division)” (e-Stat table ID: 0004005684)
- MIC and METI, “2016 Economic Census for Business Activity: Private establishments and employees by industry (sub-division)” (e-Stat table ID: 0003218646)
- MIC and METI, “2016 Economic Census for Business Activity: Private establishments, employees, sales (revenue), capacity and rooms of hotels, ryokan and simple lodging (by minor group)” (e-Stat table ID: 0003215481)
- e-Stat, Portal Site of Official Statistics of Japan
■ Private-sector research
- Teikoku Databank, “Survey on Corporate Trends Regarding Labor Shortages (April 2026)” (May 19, 2026; in Japanese)
- MetroEngines Research — room stock of operating accommodation properties nationwide (based on confirmed OTA listings, N=27,162 properties / 1,266,919 rooms, as of September 2026)