

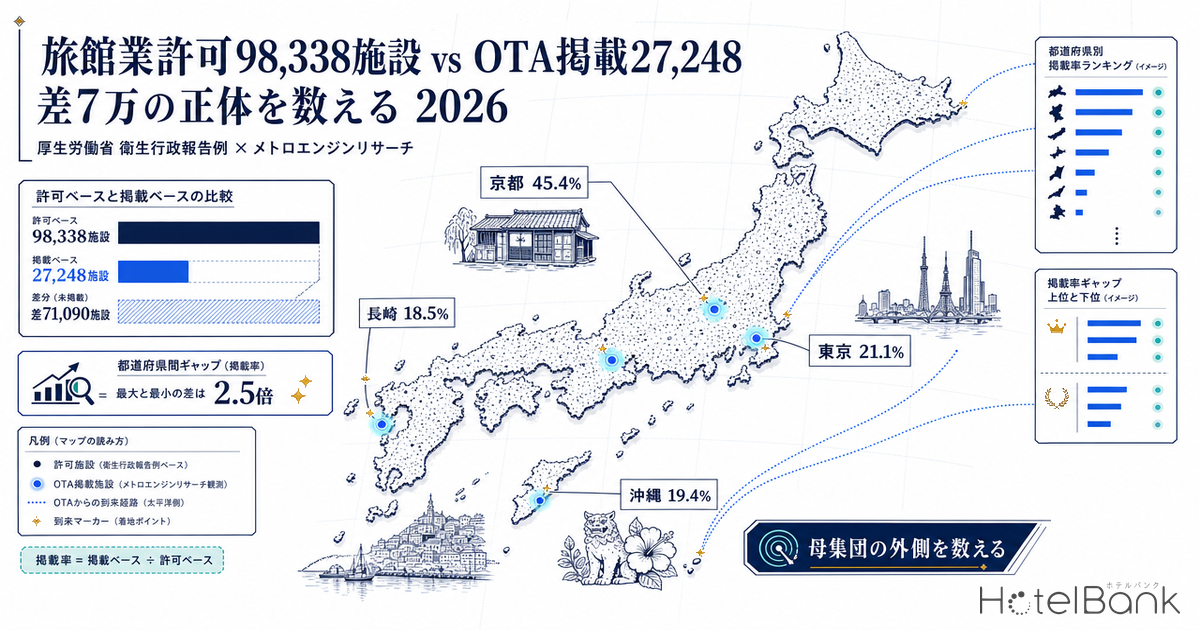
According to the Ministry of Health, Labour and Welfare’s “FY2024 Report on Public Health Administration and Services,” 98,338 facilities nationwide held an operating license under the Ryokan Business Act as of the end of FY2024. Meanwhile, MetroEngines Research can continuously observe prices and inventory on OTAs for just 27,248 facilities. The gap is 71,090 facilities. Reading that 71,000 as “there are 71,000 invisible lodgings out there” is wrong; the correct reading is that the two statistics are counting fundamentally different things. This article breaks down what that gap is actually made of, from three angles: license category, prefecture, and room count.
Metric Definitions Used in This Article
- License base: The number of facilities licensed under the Ryokan Business Act as reported in the MHLW “Report on Public Health Administration and Services (annual report).” There are three license categories: “Ryokan/Hotel Operation,” “Simple Lodging Operation,” and “Boarding House Operation.” Figures are as of the end of FY2024 (March 31, 2025).
- Listing base: Of the 134,727 domestic lodging facility records tracked by MetroEngines Research, the 27,248 facilities (1,266,645 rooms) whose operation can be confirmed on OTAs. As of August 2026. Facilities not listed on OTAs or other channels, and facilities that have suspended their listings, are excluded.
- Listing ratio: Listing-base facility count ÷ license-base facility count. Because the numerator and denominator differ in compiling body, reference date, and definition, this should be read not as a “capture rate” for facilities but as a reference indicator of how far the two populations overlap.
- Data sources: MHLW “FY2024 Report on Public Health Administration and Services”; MetroEngines Research
- — The 71,090-facility gap is not a pool of “invisible lodgings.” There are 98,338 licensed lodging businesses and 27,248 facilities whose prices and inventory are observable on OTAs; the two statistics count fundamentally different things.
- — Of the 4,863-facility increase on the license base, 61.5% was Simple Lodging Operation — a category that broadly includes mountain huts, corporate retreat houses, seasonal operations and other facilities not intended for general public sale.
- — On the listing base, small-format property types account for 33.0% of facilities but only 6.2% of rooms (8.7 rooms per facility). Counting facilities and counting rooms produce entirely different pictures of the market.
- — From the same two datasets: 27.7% by facility count, 51.5% if the denominator is Ryokan/Hotel Operation only, and 71.1% by room count. The method of counting alone yields three different answers.
- — Prefectural listing ratios run from 45.4% in Kyoto to 18.5% in Nagasaki — a 2.5x spread. The correlation with the Simple Lodging share is -0.396 (N=47), so the figure is heavily driven by the composition of the denominator.
How this differs from our earlier coverage
We have previously examined the internal structure of the 27,248-property OTA-listed population, including its chain-affiliation rate. That was a story about slicing the inside of the population. This article takes up the outside of that population — the gap against the government’s licensing statistics itself. We have separately covered how to read preliminary versus final figures in the Japan Tourism Agency’s Overnight Travel Statistics Survey and the change in its stratification criteria; this article is a population-level comparison between MHLW licensing statistics and our own observed data, which is a different angle.
Inside the 98,338 — growth is in Simple Lodgings, and in a shrunken Ryokan/Hotel category
First, the license-base breakdown. The 98,338 licensed lodging businesses at the end of FY2024 consist of 52,946 Ryokan/Hotel Operations (53.8%), 44,901 Simple Lodging Operations (45.7%), and 491 Boarding House Operations (0.5%). Of the 4,863-facility increase from the prior fiscal year, Simple Lodging Operations accounted for 2,992 facilities (61.5%) and Ryokan/Hotel Operations for 1,908 facilities (39.2%), while Boarding House Operations declined by 37.
Looking at the five-year trend, Ryokan/Hotel Operations fell from 50,703 facilities in FY2020 to 50,321 in FY2022, then added 2,625 facilities over the following two years. Simple Lodging Operations, by contrast, have risen continuously from 37,847 facilities in FY2020, adding 7,054 facilities (+18.6%) over four years. Over a longer horizon the picture is even clearer. Ryokan/Hotel Operations numbered 76,751 facilities in FY1997 and fell 36% over twenty years to 49,024 in FY2017. FY2017 was the bottom; the count has been rising since FY2018. Simple Lodging Operations bottomed out in the opposite direction, at 22,396 facilities in FY2005, and have since doubled.
Source: Compiled by the HotelBank Editorial Team from MHLW “Report on Public Health Administration and Services”
One reason the trend turned around FY2018 is a change on the regulatory side. The revised Ryokan Business Act, which took effect on June 15, 2018, merged the previously separate “Hotel Operation” and “Ryokan Operation” categories into a single “Ryokan/Hotel Operation” category and abolished the minimum room-count standards (10 rooms or more for Hotel Operation, 5 or more for Ryokan Operation). Operating without a staffed front desk also became permissible, subject to conditions such as an emergency response capability and ICT-based identity verification. In other words, the “Ryokan/Hotel Operation” category from FY2018 onward is not the same box it was before: facilities of just a few rooms began entering the same category. How that removal of the minimum-room standard actually showed up in new openings is something we have tracked separately using data on 554 newly opened properties.
Why you cannot read this as “71,000 facilities are operating”
Reading the 71,090-facility gap as “operating lodgings that simply have not appeared on OTAs yet” fails on several counts. Let us set them out.
First, the Simple Lodging category covers a very wide range. Under the Ryokan Business Act, a simple lodging is a facility “whose structure and equipment are chiefly designed for shared use of sleeping accommodation by multiple persons,” and the Japan Tourism Agency’s Overnight Travel Statistics Survey cites bed houses, mountain huts and capsule hotels as examples of the category. It includes not only the guesthouses and hostels an ordinary traveler can book on a reservation site, but also mountain huts, rider houses, corporate and organizational retreat facilities, and seasonally operated properties. A substantial number of these were never intended for general public sale in the first place.
Second, some facilities hold a live license but have no operating activity. A Ryokan Business Act license does not lapse automatically once granted; it remains in the statistics until a notice of discontinuation is filed. In FY2024 there were 7,720 licenses granted and 2,817 business discontinuations. License grants are recorded immediately as an act occurring within the fiscal year, whereas discontinuations are only reflected once the operator files. Structurally, this leaves behind facilities that are dormant, or effectively closed but never deregistered.
Third, filings under the Private Lodging Business Act (the “minpaku” law) are not included in the 98,338. Private lodging is not a Ryokan Business Act license but a notification to the prefectural governor or equivalent, and it sits under a separate regime administered by the Japan Tourism Agency. Facilities operating under a Ryokan Business Act license and dwellings operating under a private-lodging notification are counted entirely separately in the statistics. Whether you add the two together when discussing “the number of lodging facilities” naturally changes the number.
Fourth, some operators choose not to list on OTAs at all. Lodgings that run on repeat guests, direct sales, travel agencies or corporate contracts alone, members-only retreat houses, and facilities dedicated to group intake do not surface on OTAs even while operating. The 27,248 facilities on the listing base are “facilities that use OTAs and similar channels as a distribution channel,” not “facilities that are operating.”
Inside the listing base — 33% of facilities are small formats, but only 6% of rooms
Next, we break down the listing base. By property type, the 27,248 facilities include conventional lodging formats such as 7,753 ryokan, 6,387 business hotels, 1,102 city hotels and 1,224 resort hotels, alongside small formats: 1,911 pensions, 1,829 minshuku, 1,515 guesthouses, 1,042 hostels, 825 rental villas, 663 machiya townhouses, 405 cottages, 397 lodges, 166 dormitories and 128 farm-stay inns. Summing these small formats (14 categories including youth hostels, glamping and campsites, and rider houses) gives 8,998 facilities, or 33.0% of the entire listing base.
Recount by rooms, however, and the picture changes. Those same 8,998 facilities hold 78,623 rooms in total — just 6.2% of the listing base’s 1,266,645 rooms. That is 8.7 rooms per facility. By comparison, the 6,387 business hotels hold 643,452 rooms (100.7 per facility), and the 1,102 city hotels hold 176,355 rooms (160.0 per facility). Whether you count facilities one by one or rooms one by one, the picture of the market is entirely different.
Source: Compiled by the HotelBank Editorial Team from MetroEngines Research (N=27,248 facilities / 1,266,645 rooms, as of August 2026)
This property of being “numerous by facility count but thin by room count” is the flip side of the fact that Simple Lodging Operations make up 45.7% of the license base. The segment where the government’s licensing statistics are growing is a very thin layer in terms of room inventory.
Listing ratios by prefecture — 45.4% at the top, 18.5% at the bottom, a 2.5x spread
We placed the license base and the listing base side by side for each prefecture and computed the listing ratio (listed ÷ licensed). The national average is 27.7%. The highest is Kyoto at 45.4% (4,657 licensed, 2,112 listed), followed by Aichi at 44.7%, Toyama at 43.2% and Osaka at 41.5%. The lowest is Nagasaki at 18.5% (2,065 licensed, 382 listed), followed by Okinawa at 19.4%, Tokyo at 21.1% and Kagawa at 21.2%. The spread between highest and lowest is 2.5x.
Source: Compiled by the HotelBank Editorial Team from MHLW “FY2024 Report on Public Health Administration and Services” and MetroEngines Research
What deserves emphasis here is that a low listing ratio is neither a lag in distribution nor a difference in effort. The listing ratio is heavily driven by the composition of the denominator (licensed facilities). In fact, across the 47 prefectures, the correlation coefficient between the listing ratio and the Simple Lodging share is -0.396, and between the listing ratio and “rooms per licensed facility” it is +0.431. Both are moderate relationships: there is indeed a tendency for prefectures with more small licensed facilities to show lower listing ratios, but not strongly enough to explain the whole picture. On how far prefectural rankings can reshuffle depending on which denominator you choose, our analysis of Japan’s lodging supply denominator works through concrete examples built on the same 44,901 Simple Lodging facilities.
Source: Compiled by the HotelBank Editorial Team from MHLW “FY2024 Report on Public Health Administration and Services” and MetroEngines Research (N=47 prefectures)
The outliers in the scatter plot are Tokyo and Okinawa. Okinawa has the smallest figure in the country for rooms per licensed facility, at 17.8, and its 3,804 Simple Lodgings slightly exceed its 3,799 Ryokan/Hotel Operations. The density of small facilities feeding straight through into a 19.4% listing ratio broadly explains the case.
Tokyo is a different story. Its Simple Lodging share is 17.6%, the second-lowest in the country, yet its listing ratio of 21.1% is third from the bottom. The key lies in a change within the Ryokan/Hotel Operation category itself. Tokyo’s Ryokan/Hotel Operations rose from 3,774 facilities at the end of FY2022 to 5,858 at the end of FY2024 — 2,084 facilities (+55.2%) in two years. Over the same period, room count rose only from 205,381 to 212,888, an increase of 7,507 rooms. That works out to just 3.6 rooms per added facility. Average rooms per facility fell from 54.4 to 36.3. In FY2024, 1,589 lodging-business licenses were granted in Tokyo, 20.6% of the national total of 7,720; discontinuations numbered 113. Against the backdrop of the abolished minimum room-count standard discussed in the previous section, the natural reading is that facilities of just a few rooms are flowing in large numbers into the Ryokan/Hotel Operation category.
Count by rooms and the gap turns from 71,000 facilities into 510,000 rooms
The Report on Public Health Administration and Services compiles room counts only for Ryokan/Hotel Operations (Simple Lodging and Boarding House Operations are facility-count only). The 52,946 Ryokan/Hotel Operations at the end of FY2024 held 1,782,232 rooms. The 27,248 facilities on the listing base hold 1,266,645 rooms.
Compared by facility count: 27,248 ÷ 98,338 = 27.7%. With only Ryokan/Hotel Operations as the denominator: 27,248 ÷ 52,946 = 51.5%. Compared by room count: 1,266,645 ÷ 1,782,232 = 71.1%. The same two datasets are being matched against each other, yet simply changing how you count yields three numbers — 27.7%, 51.5% and 71.1%. If you want to discuss the scale of market inventory, use rooms; if you want to discuss the distribution of operators, use facilities. The choice has to follow the purpose.
Source: Compiled by the HotelBank Editorial Team from MHLW “FY2024 Report on Public Health Administration and Services” and MetroEngines Research
One more shift worth noting on the license-base side is how room counts are growing. Ryokan/Hotel Operation rooms totaled 1,770,752 in FY2022, 1,776,994 in FY2023 and 1,782,232 in FY2024. The FY2024 increase was 5,238 rooms (+0.3%), which against the same year’s increase of 1,908 facilities works out to 2.7 rooms per facility. In FY2023 the comparable figures were +717 facilities against +6,242 rooms (8.7 rooms per facility), so the average unit size shrank sharply within a single year.
This is not a story about the volume of new supply thinning out. It means the average size of the “one facility” recorded in the government’s licensing statistics has changed. Discuss supply pressure in the lodging market using the growth rate in licensed facilities (+3.7%) and you land on a conclusion an order of magnitude away from the growth in actual room inventory (+0.3%). On our listing base, average rooms per facility is 46.5, above the 33.7 for Ryokan/Hotel Operations on the license base. Facilities that stay continuously listed on OTAs skew toward the relatively larger end of the size distribution.
Full prefecture table (license base vs listing base)
All 47 prefectures, ordered by listing ratio from high to low. “Rooms/licensed facility” is the room count for Ryokan/Hotel Operations divided by the facility count for the same category, indicating the typical scale of the licensed facilities in that prefecture.
| # | Prefecture | Licensed total | Ryokan/Hotel | Simple Lodging | Listed | Listing ratio | Simple Lodging share | Rooms/licensed facility |
|---|---|---|---|---|---|---|---|---|
| 1 | Kyoto | 4,657 | 955 | 3,647 | 2,112 | 45.4% | 78.3% | 52.4 |
| 2 | Aichi | 1,380 | 1,220 | 158 | 617 | 44.7% | 11.4% | 56.0 |
| 3 | Toyama | 586 | 371 | 214 | 253 | 43.2% | 36.5% | 41.0 |
| 4 | Osaka | 2,425 | 1,646 | 773 | 1,006 | 41.5% | 31.9% | 78.1 |
| 5 | Yamagata | 1,007 | 737 | 270 | 389 | 38.6% | 26.8% | 25.7 |
| 6 | Miyagi | 1,016 | 663 | 335 | 389 | 38.3% | 33.0% | 50.4 |
| 7 | Iwate | 1,012 | 713 | 292 | 354 | 35.0% | 28.9% | 29.2 |
| 8 | Hyogo | 2,421 | 1,411 | 986 | 827 | 34.2% | 40.7% | 33.1 |
| 9 | Niigata | 2,215 | 1,926 | 279 | 753 | 34.0% | 12.6% | 22.6 |
| 10 | Saga | 524 | 329 | 194 | 175 | 33.4% | 37.0% | 28.5 |
| 11 | Gunma | 2,047 | 1,121 | 926 | 676 | 33.0% | 45.2% | 26.5 |
| 12 | Fukuoka | 1,716 | 1,315 | 400 | 559 | 32.6% | 23.3% | 49.1 |
| 13 | Nara | 789 | 418 | 371 | 253 | 32.1% | 47.0% | 24.9 |
| 14 | Shizuoka | 4,556 | 2,535 | 2,016 | 1,437 | 31.5% | 44.2% | 26.9 |
| 15 | Kanagawa | 2,428 | 1,308 | 1,116 | 760 | 31.3% | 46.0% | 44.8 |
| 16 | Mie | 1,564 | 1,275 | 284 | 488 | 31.2% | 18.2% | 23.5 |
| 17 | Saitama | 846 | 703 | 143 | 252 | 29.8% | 16.9% | 38.1 |
| 18 | Gifu | 1,913 | 1,065 | 838 | 571 | 29.8% | 43.8% | 25.1 |
| 19 | Akita | 817 | 497 | 307 | 238 | 29.1% | 37.6% | 30.8 |
| 20 | Oita | 1,993 | 990 | 991 | 580 | 29.1% | 49.7% | 23.8 |
| 21 | Fukushima | 2,135 | 1,382 | 652 | 604 | 28.3% | 30.5% | 29.8 |
| 22 | Ehime | 950 | 414 | 532 | 267 | 28.1% | 56.0% | 42.7 |
| 23 | Yamaguchi | 797 | 552 | 241 | 222 | 27.9% | 30.2% | 31.7 |
| 24 | Hiroshima | 1,482 | 748 | 733 | 411 | 27.7% | 49.5% | 44.3 |
| 25 | Wakayama | 1,458 | 588 | 870 | 396 | 27.2% | 59.7% | 28.3 |
| 26 | Ibaraki | 1,165 | 878 | 266 | 315 | 27.0% | 22.8% | 32.7 |
| 27 | Ishikawa | 1,535 | 715 | 819 | 414 | 27.0% | 53.4% | 40.8 |
| 28 | Nagano | 7,022 | 2,656 | 4,361 | 1,891 | 26.9% | 62.1% | 23.8 |
| 29 | Tottori | 772 | 324 | 448 | 208 | 26.9% | 58.0% | 29.9 |
| 30 | Tokushima | 721 | 407 | 313 | 194 | 26.9% | 43.4% | 23.2 |
| 31 | Kumamoto | 1,816 | 962 | 850 | 476 | 26.2% | 46.8% | 28.0 |
| 32 | Tochigi | 2,317 | 1,398 | 919 | 572 | 24.7% | 39.7% | 26.1 |
| 33 | Okayama | 1,145 | 729 | 412 | 277 | 24.2% | 36.0% | 30.4 |
| 34 | Shimane | 890 | 373 | 510 | 209 | 23.5% | 57.3% | 29.3 |
| 35 | Chiba | 2,767 | 1,232 | 1,533 | 634 | 22.9% | 55.4% | 47.9 |
| 36 | Miyazaki | 938 | 409 | 528 | 215 | 22.9% | 56.3% | 41.5 |
| 37 | Aomori | 1,055 | 556 | 493 | 240 | 22.7% | 46.7% | 34.4 |
| 38 | Hokkaido | 6,357 | 2,930 | 3,314 | 1,432 | 22.5% | 52.1% | 41.8 |
| 39 | Shiga | 1,018 | 486 | 527 | 228 | 22.4% | 51.8% | 31.5 |
| 40 | Kochi | 830 | 332 | 497 | 184 | 22.2% | 59.9% | 30.2 |
| 41 | Fukui | 1,421 | 877 | 541 | 312 | 22.0% | 38.1% | 18.0 |
| 42 | Kagoshima | 2,480 | 847 | 1,626 | 532 | 21.5% | 65.6% | 32.0 |
| 43 | Yamanashi | 3,412 | 1,325 | 2,080 | 722 | 21.2% | 61.0% | 20.6 |
| 44 | Kagawa | 1,144 | 332 | 811 | 242 | 21.2% | 70.9% | 41.9 |
| 45 | Tokyo | 7,122 | 5,858 | 1,256 | 1,506 | 21.1% | 17.6% | 36.3 |
| 46 | Okinawa | 7,612 | 3,799 | 3,804 | 1,474 | 19.4% | 50.0% | 17.8 |
| 47 | Nagasaki | 2,065 | 639 | 1,425 | 382 | 18.5% | 69.0% | 35.7 |
Source: Compiled by the HotelBank Editorial Team from MHLW “FY2024 Report on Public Health Administration and Services” (as of end-FY2024) and MetroEngines Research (as of August 2026, N=27,248 facilities)
When you say “number of lodging facilities,” which population do you mean?
Pulling the above together, Japan has at least three different numbers coexisting under the label “number of lodging facilities.”
| Population | Facilities | Definition / reference date | Administering body |
|---|---|---|---|
| Licensed lodging businesses | 98,338 | Facilities licensed under the Ryokan Business Act. As of end-FY2024. Whether the facility is actually operating is not considered | MHLW |
| Overnight Travel Statistics Survey population register | approx. 76,000 | Register adjusted on the basis of the Establishment Frame Database. As of January 1, 2026. Approximately 23,000 facilities of these are surveyed | Japan Tourism Agency |
| OTA-listed, operation-confirmed facilities | 27,248 | Facilities whose prices and inventory are observable on OTAs. As of August 2026. 1,266,645 rooms | MetroEngines Research |
Sources: MHLW “FY2024 Report on Public Health Administration and Services”; Japan Tourism Agency “On the Changes Accompanying the Review of Stratification Criteria for the Overnight Travel Statistics Survey”; MetroEngines Research
The largest figure, 98,338, is 3.6x the smallest, 27,248, with roughly 76,000 sitting in between. All three are legitimate figures, compiled either officially or on a continuous basis. The problem arises when they are cited interchangeably.
On the Overnight Travel Statistics Survey, the sampling method is also worth knowing. From Q2 2010 through the December 2025 survey, the stratification criterion was employee headcount: establishments with 10 or more employees were fully enumerated, those with 5-9 sampled at one in three, and those with 0-4 at one in nine. From the January 2026 survey, the criterion changed to room count: properties with 20 or more rooms are fully enumerated, while those with 1-19 rooms are sampled at rates set for each prefecture. The Japan Tourism Agency states that there is no impact on the population facility count and that the number of surveyed facilities remains around 23,000 as before. In other words, this survey’s guest-night totals and occupancy rates are estimates where small facilities are concerned.
How to compare properly
In practice, checking three things is enough.
1. State which denominator you are using. When you write “there are X lodging facilities in the prefecture,” the meaning and the usable applications differ entirely depending on whether that is the license base, the survey population, or sellable inventory. Using the license base for a municipal tourism plan, the Overnight Travel Statistics Survey for an occupancy discussion, and the OTA listing base for competitive analysis is itself entirely correct as a combined practice. What is dangerous is mixing them inside a single division.
2. Align the reference dates. The Report on Public Health Administration and Services is as of fiscal year-end (March 31), and publication comes in the second half of the following fiscal year: the FY2024 summary was published on October 21, 2025. The Overnight Travel Statistics Survey firms up in stages, from preliminary to second preliminary to final. OTA listing data is a snapshot at the time of observation. It is all too easy to line up figures more than a year apart and discuss increases and decreases.
3. Decide up front whether you are talking facilities or rooms. As this article has shown, the same gap can be expressed as 72.3% by facility count (the inverse of 27.7%) or 28.9% by room count (the inverse of 71.1%). In discussions of oversupply or undersupply, rooms are almost always the more appropriate unit; in contexts of operator support or policy design, facility counts carry meaning.
On the differing depth of lodging inventory between urban and rural Japan, we have covered the topic from other angles in our count of municipalities with one listed property or fewer and our look at “second city” markets outside prefectural capitals. On regional differences in format mix, see our analysis of the category mix across 34 major municipalities.
Conclusion
The 71,090-facility gap between 98,338 licensed lodging businesses and 27,248 OTA-listed facilities is neither a hidden market nor untapped inventory. It is a difference in how the populations are defined, produced by four overlapping factors: the breadth of the license category definitions, licenses that persist after operations cease, a separate notification regime, and the choice of distribution channel.
Simple Lodging Operations, which account for more than 60% of the increase, consist of a very thin layer in room-inventory terms. The fact that comparable small formats make up 33.0% of facilities but only 6.2% of rooms on the listing base corroborates that thinness. Even on the Ryokan/Hotel Operation side, FY2024 added 1,908 facilities but only 5,238 rooms. Since the regulatory revision abolished the minimum room-count standard, the average size of the “one facility” recorded in government statistics has been falling steadily.
Given this structure, the practical implications come down to three. First, do not judge supply pressure by the growth rate in licensed facilities: FY2024 Ryokan/Hotel Operations grew +3.7% by facilities but only +0.3% by rooms, so new supply as room inventory is not as thick as the headline suggests. Second, before reading a region’s low listing ratio as a sales opportunity, check the composition of the denominator: expecting a nationally average listing ratio in a prefecture like Okinawa, at 17.8 rooms per licensed facility, means comparing different populations in the first place. Third, whoever cites the statistics should state the population and the reference date. The three figures — 98,338, roughly 76,000, and 27,248 — are all correct, and all measure something different.
Frequently Asked Questions
Q. So how many lodging facilities does Japan actually have?
The figure you use depends on your purpose. Facilities licensed under the Ryokan Business Act numbered 98,338 at the end of FY2024 (MHLW); the population register for the Japan Tourism Agency’s Overnight Travel Statistics Survey was approximately 76,000 as of January 1, 2026; and facilities whose prices and inventory are observable on OTAs numbered 27,248 as of August 2026. There is a 3.6x spread, but each is correct on its own definition.
Q. Is the 71,000-facility gap between licensed and listed facilities made up of lodgings that operate but are not on reservation sites?
It cannot be read that way. The gap mixes together simple lodgings such as mountain huts and corporate retreat houses that were never intended for general public sale, facilities whose licenses remain on the books because no discontinuation notice was filed, and facilities that operate solely through direct sales or travel agencies. How many genuinely operating but unlisted facilities exist cannot be determined by matching these two statistics alone.
Q. Is private lodging (minpaku) included in the 98,338?
Private lodging under the Private Lodging Business Act operates on a notification system to the prefectural governor or equivalent, administered by the Japan Tourism Agency, rather than on a Ryokan Business Act license. It is therefore not included in the 98,338 licensed lodging businesses compiled by MHLW. Facilities that have obtained a Simple Lodging or Ryokan/Hotel Operation license under the Ryokan Business Act and operate for short stays, on the other hand, are included in the 98,338.
Q. Why do Simple Lodging Operations keep increasing?
Simple Lodging Operations numbered 44,901 at the end of FY2024, an increase of 2,992 facilities (+7.1%) from the prior year. They have doubled from a floor of 22,396 in FY2005. Behind this lie the spread of guesthouse and hostel style accommodation, plus a movement of short-stay properties obtaining Ryokan Business Act licenses in order to operate. Note, however, that these statistics indicate only whether a license exists — they say nothing about operating activity.
Q. Why is Tokyo’s listing ratio as low as 21.1%?
Tokyo’s Simple Lodging share is 17.6%, the second-lowest in the country, yet its Ryokan/Hotel Operation facility count rose 55.2% in two years, from 3,774 at the end of FY2022 to 5,858 at the end of FY2024. Rooms over the same period rose by 7,507 — just 3.6 rooms per added facility. Average rooms per facility fell from 54.4 to 36.3. Since the 2018 revision of the Ryokan Business Act abolished the minimum room-count standard, facilities of just a few rooms have been entering the Ryokan/Hotel Operation category in large numbers, and this appears to be pushing the denominator up.
Q. Does the Overnight Travel Statistics Survey cover every facility?
Not exhaustively. Against a population register of roughly 76,000 facilities, approximately 23,000 are surveyed. From the January 2026 survey, the stratification criterion changed from employee headcount to room count: properties with 20 or more rooms are fully enumerated, while those with 1-19 rooms are sampled at rates set for each prefecture (previously, establishments with 10 or more employees were fully enumerated, those with 5-9 sampled at one in three, and those with 0-4 at one in nine). Figures for small facilities should be read with the understanding that they are estimates.
Related Reading
- Lodging Supply Denominator: 44,901 Simple Lodgings Move Kyoto 21st→5th
- 429 Municipalities Have 1 Hotel or Fewer — Just 51 Are True Blanks
- Japan’s Second Cities: 21 Prefectures Where the Capital Isn’t #1
- Hotel Category Mix Explains Half of City ADR: 34 Municipalities
- Japan’s ¥2.83tn Hotel Room Revenue Pool: Top 5 Prefectures 48.0%
References and Sources
■ Data sources
The license base draws on Statistical Table 4 of the MHLW “FY2024 Report on Public Health Administration and Services (annual report)” and e-Stat Table 8 (FY2022-FY2024), with the long-run series from the same source’s appendix table “Number of lodging businesses, by year, FY1997 onward.” The size and sampling method of the population register come from the Japan Tourism Agency’s “Overview of the Overnight Travel Statistics Survey” and “On the Changes Accompanying the Review of Stratification Criteria.” The listing base is domestic lodging facility data continuously observed by MetroEngines Research (N=27,248 facilities / 1,266,645 rooms, as of August 2026).
■ Calculation assumptions
The listing ratio is calculated as “listing-base facility count ÷ license-base facility count,” with each prefecture’s total lodging businesses (Ryokan/Hotel Operation + Simple Lodging Operation + Boarding House Operation) as the denominator. The Simple Lodging share is Simple Lodging Operations ÷ total lodging businesses, and “rooms/licensed facility” is Ryokan/Hotel Operation rooms ÷ facilities in the same category. Correlation coefficients are Pearson correlations treating each of the 47 prefectures as one observation (N=47). The 8,998 small-format facilities are the sum of 14 of the 27 categories on the listing base.
■ Limitations and caveats
Because the license base (end-FY2024) and the listing base (August 2026) differ in compiling body, reference date and definition, the listing ratio is a reference indicator of population overlap rather than a capture rate for facilities. Ryokan Business Act licenses remain in the statistics until a discontinuation notice is filed, so facilities with no operating activity are included in the denominator. Room counts are published only for Ryokan/Hotel Operations — Simple Lodging and Boarding House Operations are facility-count only — so room-based comparison is limited to Ryokan/Hotel Operations. Facilities filed under the Private Lodging Business Act are not included in the 98,338 on the license base.
■ Government statistics
- MHLW, “Summary of the FY2024 Report on Public Health Administration and Services” (published October 21, 2025) — Table 4, annual trend in the number of environmental health facilities
- Same, Statistical Table 4, “Number of environmental health facilities (operators), by prefecture / designated city / core city (re-tabulated)” (xlsx) — lodging business facility counts by prefecture
- e-Stat, Report on Public Health Administration and Services (annual report), Table 8, “Facility and room counts for Ryokan/Hotel Operation and facility, license, discontinuation and disposition counts for Simple Lodging and Boarding House Operation, by prefecture / designated city / core city (re-tabulated)” — room counts for FY2022, FY2023 and FY2024
- e-Stat, Report on Public Health Administration and Services, appendix table “Number of lodging businesses, by year, FY1997 onward” (table ID: 0004048085) — long-run series for FY1997-FY2021
- Japan Tourism Agency, “Overview of the Overnight Travel Statistics Survey” (PDF) — survey scope, sampling method, and definitions of lodging facility types
- Japan Tourism Agency, “On the Changes Accompanying the Review of Stratification Criteria for the Overnight Travel Statistics Survey” (effective from the January 2026 survey, PDF) — population of approximately 76,000 facilities, of which approximately 23,000 are surveyed
- Japan Tourism Agency, “minpaku” private lodging portal site — the notification system under the Private Lodging Business Act
■ Regulation
- Kanko Keizai Shimbun, “Revised Ryokan Business Act takes effect June 15” (2018) — merger of license categories and abolition of the minimum room-count standard
■ Market data
- MetroEngines Research — OTA-listed facility counts, room counts, and property type composition (N=27,248 facilities / 1,266,645 rooms, as of August 2026)