

When we talk about hotel pricing, we almost always look at the average. Area average ADR, year-on-year change, averages by property type — all are suitable measures of where a market sits. But what a guest actually sees on a booking site is not an average. It is the price range stretching from the cheapest plan to the top-tier plan within the same property, in the same month. This article measures the intra-month plan price range (minimum, average, maximum) for October 2026 across 27 properties in central Kagoshima City (the Tenmonkan and Kagoshima-Chuo Station area; properties with more than 120 rooms for which price data exists for both October 2025 and October 2026), and tests with numbers a simple proposition: two properties can share the same average and still be perceived completely differently if their ranges differ.
Metric Definitions Used in This Article
- Listed price: the selling price published on major booking sites. Per-room rate for two guests in one room (tax included). The “intra-month minimum,” “intra-month average” and “intra-month maximum” in this article are all on this listed-price basis, with all days and all plans in the target month as the population.
- Intra-month plan price range ratio (hereafter “range ratio”): the highest listed price divided by the lowest listed price in the target month. It shows how many times apart the cheapest and the most expensive plan are within the same property in the same month.
- ADR (average daily rate): an estimated settled rate (tax-excluded equivalent) calculated by applying a property-type correction factor to the cheapest plan level each property publishes on booking sites (per-room rate for two guests in one room, tax included). Cross-checked against per-property results disclosed by listed hotel REITs (91 properties, most recent three months), the median error is approximately 7%. It is an estimate and differs from each property’s actual transacted rates and accounting figures. Area-level ADR is the median of the target properties (the level of a typical property in that area).
- OCC (occupancy rate): the share of sold rooms against total rooms in the area (an estimate based on OTA sales inventory).
- Listed ADR: the area-level “listed ADR (all-plan average, tax included)” is a listed-price figure obtained by simply averaging published booking-site prices, and is calculated on a different basis from the estimated settled ADR (tax-excluded equivalent) above. Please do not compare the two directly.
- Data source: MetroEngines Research. Review scores researched by the HotelBank Editorial Team.
* Individual properties are referred to by the anonymous labels Property 01 through Property 27. This article is not intended to evaluate or comment on any particular operator’s pricing; its purpose is to observe the price structure of the market as a whole.
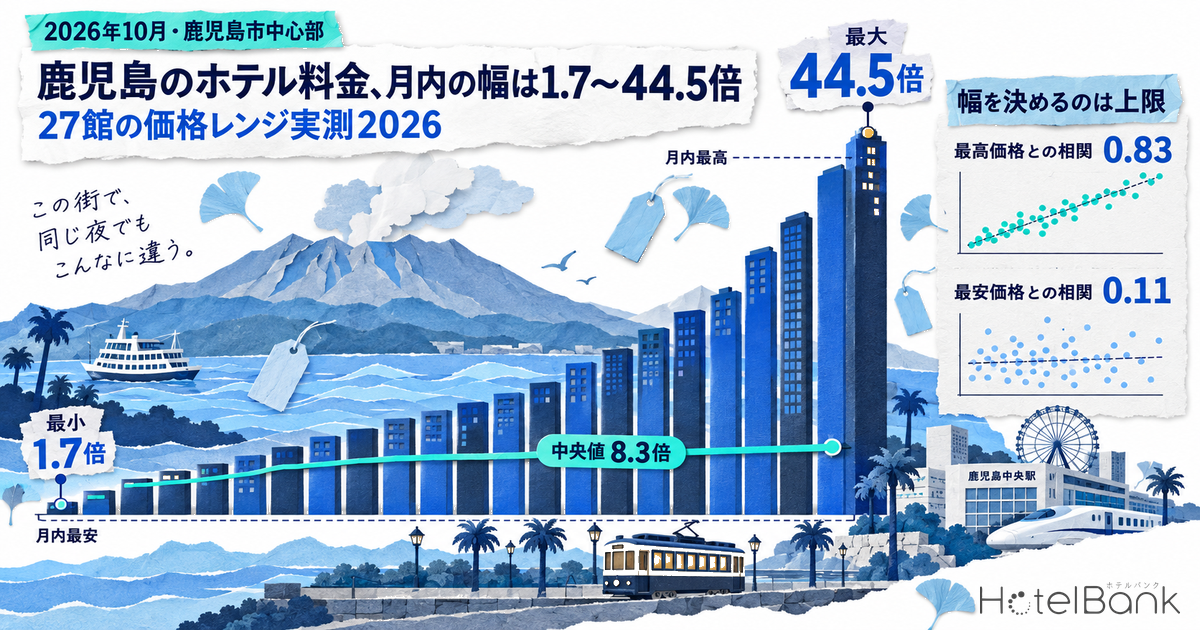
- — Across 27 properties with more than 120 rooms in central Kagoshima City, the October 2026 intra-month plan price range ratio had a median of 8.3x (first to third quartile 5.4x-12.6x; minimum 1.7x, maximum 44.5x).
- — What correlates strongly with the range ratio is the intra-month maximum price (correlation 0.83); the correlation with the intra-month minimum is 0.11. Changing the cut to 90+ rooms or to November leaves this unchanged at 0.83-0.86 and 0.11-0.22.
- — Year on year (median of per-property change rates), the floor rose +6.5% and the ceiling +6.1%, against an intra-month average of +11.7%. However, among the 20 properties with a consistent aggregation source, the average rose +13.8% and the ceiling +14.8% — so the upward shift of the center of gravity holds only in contrast to the floor.
- — Listed ADR for Kagoshima City as a whole was ¥16,300 in October 2026, up 15.3% year on year (property count 96 → 113). The correlation between range ratio and review score is 0.11 — no relationship can be confirmed.
- — Under the Kyushu Recovery Support Program (60% subsidy rate, capped at ¥20,000 per person per night), the effective discount rate starts to decline above roughly ¥67,000 in room rate for two guests in one room; the intra-month maximum exceeds that level at 8 of the 27 properties.
In the same city, in the same month, the price range spans from 1.7x to 44.5x
Start with the measured values. Aggregating listed prices for October 2026 (31 days) by property, the median range ratio across the 27 properties was 8.3x. By quartile, the first quartile is 5.4x and the third quartile 12.6x. The minimum is 1.7x and the maximum 44.5x. Even holding conditions constant — the same central Kagoshima City, the same month, the same two-guests-in-one-room basis — the “width” differs by a factor of 26 between properties.
The narrowest, Property 27 (226 rooms, business hotel), ran from an intra-month minimum of ¥7,300 to a maximum of ¥12,700. Its prices stay inside that band for the whole month. The widest, Property 01 (355 rooms, city hotel), ran from ¥10,900 to ¥484,000 — a 44.5x price gap between products sold inside the same building. The former looks like “roughly the same price whenever you check”; the latter looks like “a different price every time you check.” In a report that lines up only averages, this difference disappears entirely.
Source: compiled by the HotelBank Editorial Team from MetroEngines Research (October 2026; 27 properties with more than 120 rooms in central Kagoshima City; 240,964 cumulative observed plans)
By property type, the five city-hotel properties had a median range ratio of 29.6x and the 22 business-hotel properties 7.2x, so the segment does make a difference. But within those 22 business hotels the spread still runs from 1.7x to 22.5x, so segment alone does not explain it. The width of the range is determined less by property type than by what product mix each property has chosen.
The width is set by how high the ceiling goes, not by how low the floor sits
We ran correlations against the measured values of the 27 properties to see what determines the range ratio. The result is slightly counter-intuitive.
| Correlation with range ratio (N=27, October 2026) | Correlation coefficient |
|---|---|
| Intra-month maximum price (log) | 0.83 |
| Intra-month average price (log) | 0.69 |
| Observed plan count (log) | 0.58 |
| Room count | 0.26 |
| Intra-month minimum price (log) | 0.11 |
Source: compiled by the HotelBank Editorial Team from MetroEngines Research
The correlation between the minimum price and the range ratio is 0.11 — essentially no relationship. The notion that “the cheaper a property sets its lowest plan, the wider its range” does not hold. Against that, the correlation with the maximum price is a strong 0.83. The width of the range is explained almost entirely by how far the ceiling was extended, not by how far the floor was lowered.
The two scatter plots below visualize exactly that contrast. On a related note, where the day-to-day swing — rather than the intra-month spread — is largest by area and property type is analyzed separately in Japan Autumn 2026 Hotel Price Range: 3.3x CV Gap Across 47 Prefectures. Put the minimum price on the horizontal axis and the points scatter like a cloud; put the maximum price there and they converge into an upward-sloping band.
Source: compiled by the HotelBank Editorial Team from MetroEngines Research (N=27 properties; circle size = room count)
Source: compiled by the HotelBank Editorial Team from MetroEngines Research (N=27 properties; circle size = room count)
Translated into pricing practice, the gap reads as follows. The cheapest plan has its floor set by conditions such as room type, no meals and non-refundable terms, so differences between properties are small to begin with. The intra-month minimum across the 27 properties falls within ¥4,300-¥26,600, and 24 of them cluster at ¥9,700 or below. The ceiling, by contrast, is territory a property can freely build up: whether upper-tier rooms exist, whether suites are offered, whether meals or experiences are packaged, whether multi-night and special-date rates are set. In other words, the range ratio is close to a measure of how many upper-tier products a property has prepared.
Year on year, what moved was the center of gravity, not the width
Comparing October 2025 with October 2026 across the same 27 properties reveals an interesting asymmetry.
| 27 properties | Oct 2025 (median) | Oct 2026 (median) | Change between medians | Median of per-property change rates |
|---|---|---|---|---|
| Intra-month minimum price | ¥5,460 | ¥5,940 | +8.8% | +6.5% |
| Intra-month average price | ¥13,325 | ¥14,788 | +11.0% | +11.7% |
| Intra-month maximum price | ¥48,400 | ¥51,000 | +5.4% | +6.1% |
| Range ratio | 7.6x | 8.3x | +0.7x | ±0.0% |
| Observed plan count (cumulative) | 3,423 | 6,323 | +84.7% | +30.7% |
Source: compiled by the HotelBank Editorial Team from MetroEngines Research (same 27 properties in both years, listed-price basis. “Median of per-property change rates” is the median of each property’s year-on-year change; the year-on-year figures in the body text use this measure. For 7 of the 27 properties, the booking site used as the aggregation source in October 2025 differs from October 2026)
Looking at the median of per-property change rates, the floor rose +6.5% and the ceiling +6.1% — both ends of the range moved up at roughly the same rate. Yet the intra-month average rose +11.7%, nearly double the pace of the ends. The reading is that the “shape” of the range barely changed, while the center of gravity of the products inside it shifted upward. The observed plan count also rose +30.7% on the same per-property median basis (median-to-median, from 3,423 to 6,323), which suggests most of the added products were placed in the middle-to-upper band rather than near the floor.
That reading, however, depends on the aggregation scope. For 7 of the 27 properties, the booking site from which October 2025 prices were aggregated differs from October 2026. Limiting the comparison to the 20 properties with a consistent source in both years, the median change rates are +9.9% at the floor, +13.8% at the average and +14.8% at the ceiling. The average still rose faster than the floor, but it does not outpace the ceiling. “The center of gravity shifted upward” is safest read as a statement relative to the floor (see the sensitivity analysis later in this article).
Individual behavior is far from uniform. At 6 of the 27 properties the ceiling did not move at all over the year, and at 5 the floor did not move. Three of those held both ends completely fixed, with range ratios frozen at 1.7x, 1.8x and 2.5x. Deliberately holding the price range steady is an approach that genuinely exists in this market.
Conversely, properties whose floor rose faster than their ceiling saw their range ratio shrink. Property 12 (228 rooms, city hotel), for instance, moved its intra-month minimum from ¥20,800 to ¥26,600 (+28.2%) and its maximum from ¥200,100 to ¥231,100 (+15.5%), narrowing the range ratio from 9.6x to 8.7x. “Prices went up” and “the price range widened” do not necessarily happen together.
Source: compiled by the HotelBank Editorial Team from MetroEngines Research (Property 12, 228 rooms, city hotel segment; vertical axis on a logarithmic scale)
Tracking Property 12 over 16 months, its range ratio oscillates between 7.3x and 13.5x. The widest was 13.5x in December 2025, the narrowest 7.3x in December 2026. The 8.7x of October 2026 sits below this property’s own 16-month median of 9.6x. Which is to say: judging a property’s range as “wide” or “narrow” from a single month means little without knowing its normal range.
Market level: listed ADR in Kagoshima City is up 15.3% year on year
Stepping away from the range discussion for a moment, here is where the market level sits. Listed ADR for Kagoshima City (all-plan average, tax included; 96 properties in October 2025 and 113 in October 2026) was ¥14,100 in October 2025 against ¥16,300 in October 2026, up 15.3% year on year. It is also up from ¥15,000 in September 2026, a rise within a single month. On an estimated settled ADR basis (tax-excluded equivalent, N=72-73 properties), October 2025 was ¥6,600 against ¥8,600 in October 2026 — but that series switches calculation method, using a confirmed-history basis through August 2026 and a listed-snapshot basis from September 2026. For that reason the listed-price series and the measured intra-month ranges are used as the primary year-on-year reference here.
Source: compiled by the HotelBank Editorial Team from MetroEngines Research (Kagoshima City; 95-113 properties depending on the month; listed price, all-plan average, tax included)
A note on the demand side. OCC for Kagoshima Prefecture as a whole (occupancy rate, estimated on an OTA listed-inventory basis) ran 63.0% in June 2026 (N=292 properties, 11,252 rooms), 74.7% in July (N=289), 63.4% in August (N=295) and 71.4% in September (N=301, covering the 21 days through September 21). By property type, September was 81.0% for city hotels, 80.3% for resorts, 72.2% for ryokan and 64.9% for business hotels, with the urban city-hotel segment highest. These are estimates based on the depletion of inventory sold on OTAs and differ from each property’s actual overall occupancy.
The background is the Reiwa 8 Kumamoto Earthquake of July 28, 2026. On the Kyushu Shinkansen, the Shin-Minamata-Kagoshima-Chuo section resumed on August 7 and the Kumamoto-Shin-Minamata section on September 18, restoring the full line (slow running continues near Shin-Yatsushiro Station). October 2026 is the first full month of operation with rail access fully restored.
The upside of a wide range, and its side effect in how prices are advertised
Taking a wide range has a clear benefit: a single property can capture several customer segments at once. Among the 27 properties, the 14 whose range ratio is at or above the median (8.3x) keep their cheapest plan at roughly the same level as the 13 lower-ratio properties, while lining up products in additional price bands above it. The structure is “add above without giving up the floor.”
The side effect most often raised is that the advertised “displayed price” appears to move day to day. The wider a property’s range, the more the first price shown changes with small differences in search conditions, dates and party size. A user who looks at the same property two days apart may come away thinking it belongs to an entirely different price band. The proposition that identical averages can be perceived differently when ranges differ converges here.
So does a wide range affect post-stay evaluation? The correlation between the 27 properties’ overall review scores and their range ratios is 0.11 — no relationship could be confirmed. The 14 properties at or above the median ratio have a median score of 4.02; the 13 below have 4.05, essentially the same. At least for these 27 properties in central Kagoshima City, there is no data supporting the hypothesis that “wide-range properties create a gap in guest expectations.”
| Group (October 2026) | Properties | Median range ratio | Median review score |
|---|---|---|---|
| High-range group (8.3x and above) | 14 | 12.3x | 4.02 |
| Low-range group (below 8.3x) | 13 | 5.4x | 4.05 |
Review score source: HotelBank Editorial Team research (27 properties, cumulative posting basis) / Range source: MetroEngines Research
Where the subsidy scheme bites in the range — the price band where the cap kicks in
Demand from October 2026 also moves with a policy factor. The “Kyushu Recovery Support Program,” announced by the Japan Tourism Agency on August 28, 2026, allocates ¥15.5 billion in reserve funds across the seven Kyushu prefectures, with a 60% subsidy rate for Kumamoto and Kagoshima prefectures (50% for the other five). The cap for accommodation alone is ¥20,000 per person per night, applying to stays from October 1, 2026, with each prefecture setting its own booking start and end dates.
This is where the price range and the scheme intersect. Because the cap is applied per person, converting to this article’s two-guests-in-one-room, per-room basis means the cap starts to bite above a room rate of roughly ¥67,000 (= ¥20,000 ÷ 0.6 × 2 guests). Below that band the effective discount rate is a flat 60%; above it, the effective discount rate falls as the price rises. Nationally, the share of properties in the seven Kyushu prefectures where the ¥20,000 cap actually bites has been estimated at 4-10% on a prefecture-by-prefecture basis.
Source: estimated by the HotelBank Editorial Team based on the Japan Tourism Agency’s “Kyushu Recovery Support Program” (announced August 28, 2026) / Price bands from MetroEngines Research measurements
Applying that to the measured values: of the 27 properties in October 2026, 8 have an intra-month maximum above ¥67,000. Only one has an intra-month average above it, and none has an intra-month minimum above it. All 8 of those properties are among the top 12 by range ratio. To summarize:
- At all 27 properties, the effective discount rate on the cheapest plan is 60% (the cap is not reached).
- On the most expensive plan, the effective discount rate splits between 8.3% and 60% depending on the property. The 19 properties that never reach the cap stay at 60% even on their top plan.
- The further a property extends its range upward, the more the scheme’s effective discount rate thins out at the top end of that range. On a ¥231,100 intra-month maximum plan the effective rate is 17.3%; on a ¥484,000 plan it is 8.3%.
This is simply how the scheme is designed, not an argument that one approach is advantageous over another. Still, the fact that products at the top of the range feel less “discounted” is worth understanding when building product messaging from October onward. Note that for single occupancy the per-person price equals the room rate, so the room-rate level at which the cap starts to bite falls to roughly ¥33,000.
Designing the price range: where to put the floor and the ceiling
From the measurements above, here is what can be said about designing a price range. These are presented as points derivable from the observed structure, stopping short of assertion.
On the floor. The intra-month minimum across the 27 properties is distributed between ¥4,300 and ¥26,600, with a median year-on-year change of +6.5%. The floor is inching up across the market, but it is an area where property-to-property differences are far smaller than at the ceiling. Because the floor functions as “the entry point that gets a property onto the consideration list for that area,” there is value in presenting it continuously through the year. In fact, 5 of the 27 properties did not move their floor at all over the year.
On the ceiling. It is the ceiling that creates the range ratio, and the ceiling is where a property has the most discretion. The results of productization — upper-tier rooms, meal inclusions, multi-night stays, experience packages — show up directly in the ratio. The year-on-year change in the 27 properties’ intra-month maximum has a median of +6.1%, but individually it scatters widely from -61.4% to +186.0%. That reads less like “price increases” than like the result of reshuffling the upper-tier product lineup.
The “hold the floor, earn at the top” approach. Among these 27 properties, 13 had a floor that rose more slowly than their ceiling — that is, they extended more on the upper side. Conversely, 11 saw their floor outpace their ceiling and their range ratio shrink. Neither is the correct answer, but a structure that holds the floor steady while earning revenue at the top is at least easy to explain when someone asks “what is your lowest price?” That said, this article’s data does not establish the effect of that approach with any certainty.
Implementation checklist: operating the range as a metric
| Item | What to check | Frequency |
|---|---|---|
| Year-round presentation of the floor plan | Is the cheapest plan on offer across all periods? Does it disappear in certain periods? | Monthly |
| Monthly monitoring of the range ratio | Your own intra-month maximum ÷ minimum. Is it out of line with your own trailing 12-month median? | Monthly |
| Breakdown of the ceiling | Which room type and which product creates your maximum price? Is it the intended product? | Monthly |
| Position against competitor ranges | Gap against the median ratio for comparable properties in the area (8.3x in central Kagoshima City) | Quarterly |
| Range disclosure on your own website | Does the presentation convey the width of the price band, not just “from ¥X”? | As needed |
| Position against the subsidy cap | From which of your price bands does the subsidy cap start to bite (about ¥67,000 for two guests in one room)? | During the scheme period |
Source: prepared by the HotelBank Editorial Team
Measured intra-month price ranges for the 27 properties (October 2026)
| Property | Segment | Rooms | Intra-month min | Intra-month avg | Intra-month max | Ratio Oct 2026 | Ratio Oct 2025 | Min YoY | Max YoY | Plans | Review |
|---|---|---|---|---|---|---|---|---|---|---|---|
| Property 01 | City | 355 | 10,878 | 82,562 | 484,000 | 44.5x | 66.7x | +49.8% | +0.0% | 22,403 | 4.53 |
| Property 02 | City | 208 | 4,250 | 29,522 | 168,400 | 39.6x | 28.3x | -18.3% | +14.6% | 16,838 | 2.99 |
| Property 03 | City | 265 | 8,100 | 33,549 | 240,000 | 29.6x | 44.0x | +62.0% | +9.1% | 10,357 | 4.31 |
| Property 04 | Business | 217 | 12,825 | 46,331 | 288,000 | 22.5x | 34.9x | +55.5% | +0.0% | 14,681 | 4.02 |
| Property 05 | Business | 196 | 4,540 | 14,997 | 85,380 | 18.8x | 13.4x | -16.8% | +16.5% | 4,128 | 2.71 |
| Property 06 | Business | 165 | 7,140 | 26,827 | 129,200 | 18.1x | 9.3x | -15.2% | +65.4% | 11,063 | 3.84 |
| Property 07 | Business | 207 | 4,900 | 24,610 | 61,800 | 12.6x | 9.2x | -9.3% | +24.1% | 37,037 | 4.13 |
| Property 08 | Business | 165 | 5,500 | 10,847 | 65,200 | 11.9x | 4.7x | +12.2% | +186.0% | 4,283 | 4.14 |
| Property 09 | Business | 156 | 5,800 | 14,720 | 63,720 | 11.0x | 9.3x | +11.1% | +31.7% | 6,544 | 3.66 |
| Property 10 | Business | 351 | 4,800 | 13,052 | 47,900 | 10.0x | 8.9x | -11.1% | +0.0% | 13,786 | 4.24 |
| Property 11 | Business | 247 | 9,000 | 24,602 | 79,200 | 8.8x | 17.1x | +28.6% | -34.0% | 8,344 | 3.87 |
| Property 12 | City | 228 | 26,620 | 63,642 | 231,110 | 8.7x | 9.6x | +28.2% | +15.5% | 3,188 | 4.38 |
| Property 13 | Business | 206 | 4,800 | 14,903 | 41,100 | 8.6x | 10.4x | +0.0% | -17.8% | 5,379 | 4.02 |
| Property 14 | Business | 125 | 6,660 | 20,519 | 55,590 | 8.3x | 6.8x | +38.7% | +69.1% | 27,166 | 3.74 |
| Property 15 | Business | 251 | 5,760 | 14,788 | 42,336 | 7.3x | 6.8x | -2.2% | +6.1% | 4,128 | 2.69 |
| Property 16 | Business | 185 | 5,940 | 13,438 | 41,400 | 7.0x | 4.6x | +6.5% | +60.5% | 4,442 | 4.15 |
| Property 17 | Business | 201 | 5,400 | 13,210 | 37,320 | 6.9x | 6.0x | +0.0% | +15.0% | 8,306 | 4.43 |
| Property 18 | Business | 220 | 5,700 | 11,928 | 38,610 | 6.8x | 21.9x | +25.0% | -61.4% | 1,652 | 4.16 |
| Property 19 | Business | 230 | 8,900 | 24,492 | 51,000 | 5.7x | 7.6x | +36.9% | +3.2% | 6,323 | 3.91 |
| Property 20 | Business | 185 | 9,700 | 27,231 | 53,000 | 5.5x | 7.3x | +38.6% | +4.2% | 5,913 | 4.23 |
| Property 21 | Business | 234 | 5,400 | 12,411 | 28,900 | 5.4x | 3.6x | +1.9% | +52.1% | 6,413 | 2.22 |
| Property 22 | City | 155 | 4,300 | 11,626 | 23,000 | 5.3x | 5.5x | -2.3% | -4.2% | 4,351 | 2.78 |
| Property 23 | Business | 238 | 6,200 | 14,187 | 30,684 | 4.9x | 3.7x | +8.8% | +45.4% | 6,794 | 4.12 |
| Property 24 | Business | 295 | 4,370 | 8,847 | 20,620 | 4.7x | 5.7x | +9.5% | -8.8% | 1,972 | 3.16 |
| Property 25 | Business | 255 | 7,128 | 11,263 | 18,152 | 2.5x | 2.5x | +0.0% | +0.0% | 2,381 | 2.94 |
| Property 26 | Business | 231 | 6,900 | 9,759 | 12,430 | 1.8x | 1.8x | +0.0% | +0.0% | 1,455 | 4.13 |
| Property 27 | Business | 226 | 7,323 | 10,099 | 12,650 | 1.7x | 1.7x | +0.0% | +0.0% | 1,637 | 4.05 |
Source: compiled by the HotelBank Editorial Team from MetroEngines Research (prices are per room for two guests in one room, tax included. Plan counts are cumulative observations for the month. For Properties 08, 15, 22, 24, 25, 26 and 27, the booking site used as the October 2025 aggregation source differs from October 2026, so the Ratio Oct 2025, Min YoY and Max YoY columns include that difference in source) / Review scores researched by the HotelBank Editorial Team
⚠ Note on ADR and listed prices for future dates: Prices from October 2026 onward in this article are averages of the selling prices published on booking sites as of the survey date (aggregated September 20, 2026), and they shift as the check-in date approaches. Current levels may move with last-minute price adjustments, and the intra-month maximum and range ratio will also change as new plans are added. In addition, the estimated settled ADR uses a confirmed-history basis through August 2026 and a listed-snapshot basis from September 2026, so comparisons spanning the two include a difference in calculation method.
Sensitivity analysis: changing the aggregation conditions
The figures in this article rest on a single set of aggregation conditions: more than 120 rooms, October 2026, 27 properties. To check whether the conclusions hold when those conditions change, we tested two axes — scope (38 properties, adding the 11 with 90-120 rooms) and target month (November 2026).
| Aggregation condition | N | Median range ratio (Q1-Q3) | Correlation with max price | Correlation with min price |
|---|---|---|---|---|
| More than 120 rooms, October 2026 (this article) | 27 | 8.3x (5.4-12.6x) | 0.83 | 0.11 |
| More than 120 rooms, November 2026 | 27 | 7.6x (5.3-12.6x) | 0.86 | 0.22 |
| 90 rooms or more, October 2026 | 38 | 8.7x (5.4-13.6x) | 0.84 | 0.13 |
| 90 rooms or more, November 2026 | 38 | 7.9x (5.2-14.0x) | 0.86 | 0.22 |
Source: compiled by the HotelBank Editorial Team from MetroEngines Research (listed price, two guests in one room, per room, tax included. Correlations are Pearson coefficients on log-transformed prices. November 2026 uses selling prices as of the survey date, aggregated September 20, 2026)
| Aggregation scope | N | Intra-month min | Intra-month avg | Intra-month max |
|---|---|---|---|---|
| More than 120 rooms (this article) | 27 | +6.5% | +11.7% | +6.1% |
| Of which, same aggregation source in both years | 20 | +9.9% | +13.8% | +14.8% |
| 90 rooms or more | 38 | ±0.0% | +10.1% | +7.6% |
Source: compiled by the HotelBank Editorial Team from MetroEngines Research (same properties compared in both years)
Under all four conditions the range ratio correlates strongly with the intra-month maximum price (0.83-0.86) and weakly with the intra-month minimum (0.11-0.22). The conclusion that “width is determined by how far the ceiling is extended” depends on neither the scope nor the target month. Medians land within 7.6x-8.7x, and under either scope November is lower than October.
The year-on-year reading that “the average rose faster than the ends,” by contrast, does shift with conditions. The average outpacing the floor holds across all three aggregation scopes, but against the ceiling, among the 20 properties with a consistent booking-site source, the average (+13.8%) falls short of the ceiling (+14.8%). The center of gravity inside the range did move, but it cannot be asserted that it moved faster than the ceiling.
Summary
Four things emerge from measuring these 27 properties in central Kagoshima City. First, even within the same city and the same month, intra-month plan price range ratios diverge widely, from 1.7x to 44.5x (median 8.3x), and averages alone hide the differences between properties. Second, what determines the width of the range is the maximum price (correlation 0.83), not the minimum (0.11). Third, year on year (median of per-property change rates), the floor rose +6.5% and the ceiling +6.1% against an average of +11.7%: the center of gravity inside the range moved more than its shape did. That is consistent with the increase in observed plan count (+30.7% on the same basis). However, limiting the comparison to the 20 properties with a consistent booking-site source in both years, the average’s rise (+13.8%) does not exceed the ceiling’s (+14.8%), so this reading holds firmly only in contrast to the floor. Fourth, the correlation between range ratio and review score is 0.11; no relationship between width and evaluation could be confirmed.
Average ADR remains a valid measure of where a market sits, but it is also the result of folding a property’s entire price range into a single number. Track your own range ratio monthly and check which products create its upper and lower ends — that alone is enough to start reading the structure behind the average.
Frequently Asked Questions
Q. What is a standard range ratio?
Across the 27 properties with more than 120 rooms in central Kagoshima City, the October 2026 median was 8.3x, with a first quartile of 5.4x and a third quartile of 12.6x. That said, this varies by area, property type and survey month. In practice, comparing against your own trailing 12-month median is more useful than comparing against other properties.
Q. Is a wide range the same as a high price?
No. Across these 27 properties the correlation between the intra-month minimum price and the range ratio is 0.11, so the height of the floor and the width of the range behave as separate metrics. One property has an intra-month minimum of ¥26,600 with a ratio of 8.7x; another has a minimum of ¥4,300 with a ratio of 5.3x.
Q. Does the range always widen when prices rise?
Not necessarily. If the floor rises faster than the ceiling, the range ratio shrinks. Among these 27 properties, the range ratio narrowed year on year at 11, widened at 13 and was unchanged at 3.
Q. What does “observed plan count” refer to?
It is the cumulative count of plans observed on booking sites across all days of the month (days x plans). It is used as a proxy for the depth of the product lineup, and its correlation with the range ratio was 0.58. It does not represent sales results or booking volumes.
Q. Do the results change if you change the property criteria?
Widening to 38 properties with 90 rooms or more, the October 2026 median range ratio is 8.7x, with a correlation of 0.84 against the maximum price and 0.13 against the minimum — the conclusion that “width is determined by the ceiling” does not change. The year-on-year reading, however, does depend on scope: among the 20 properties with a consistent booking-site source in both years, the average’s rise (+13.8%) does not exceed the ceiling’s (+14.8%).
Q. From which price band does the Kyushu Recovery Support Program cap bite?
With a 60% subsidy rate and a ¥20,000 per-person-per-night cap, the effective discount rate falls below 60% above a room rate of roughly ¥67,000 for two guests in one room, or roughly ¥33,000 for single occupancy. Among the 27 properties in October 2026, 8 have an intra-month maximum above that level and none has an intra-month minimum above it.
Related Reading
References and Sources
■ Data sources
MetroEngines Research measurements of intra-month plan price ranges (listed prices on booking sites, two guests in one room, per room, tax included; all days and all plans of the target month. Cumulative observed plans: 240,964 for October 2026 and 172,949 for October 2025). Listed ADR and estimated settled ADR for Kagoshima City are area-level monthly aggregations (listed ADR covers 95-113 properties depending on the month; estimated settled ADR covers 72-73 properties in both October 2025 and October 2026). Estimated OCC for Kagoshima Prefecture is on an OTA listed-inventory basis (N=289-301 properties). Overall review scores researched by the HotelBank Editorial Team (27 properties, 230-19,597 cumulative posts per property).
■ Calculation assumptions
The target set is 27 properties in central Kagoshima City (the Tenmonkan and Kagoshima-Chuo Station area, roughly a 4 km radius) with more than 120 rooms (125-355 rooms) for which price data exists for both October 2025 and October 2026. Range ratio = intra-month maximum price ÷ intra-month minimum price. Correlations are Pearson coefficients, with prices and plan counts log-transformed. Quartiles are calculated from the 27 properties’ range ratios. Year-on-year figures use the median of per-property change rates as the primary measure; Table 2 also shows the change between medians. The effective discount rate for the Kyushu Recovery Support Program is the lower of 60% and “¥20,000 x number of guests ÷ room rate.”
■ Limitations and caveats
Prices from October 2026 onward are selling prices as of the survey date (aggregated September 20, 2026) and may change with last-minute price adjustments or the addition and withdrawal of plans. For October 2025, 7 of the 27 properties had a different booking site as their price aggregation source than in October 2026, so those properties’ year-on-year figures include that difference in source (Table 7 shows a re-aggregation across 20 properties). Excluded are 5 properties with more than 120 rooms lacking price data in both years and the 11 properties with 90-120 rooms (Tables 6 and 7 show the results including those 11). Observed plan count is a cumulative days x plans figure, not sales results or booking volumes. Correlation does not imply causation.
■ Market data
- MetroEngines Research — measured intra-month plan price ranges (27 properties in central Kagoshima City, October 2025 and September-December 2026), listed ADR for Kagoshima City (95-113 properties) and estimated settled ADR (72-73 properties), and estimated OCC for Kagoshima Prefecture on an OTA listed-inventory basis (N=289-301 properties)
- HotelBank Editorial Team research — overall review scores for the 27 properties (cumulative posting basis)
■ Policy and government materials
- Japan Tourism Agency, “Kyushu Recovery Support Program” (disaster-related information)
- Travel support “Kyushu Recovery Support Program” confirmed for October. ¥20,000 off per night, up to ¥35,000 subsidy for tours (Travel Watch, August 28, 2026)
■ Transport and infrastructure restoration
- [Breaking] Kyushu Shinkansen fully reopens as Kumamoto-Shin-Minamata resumes service (Kumamoto Nichinichi Shimbun, September 18, 2026)
- Kyushu Shinkansen to fully reopen on September 18; Kumamoto-Shin-Minamata suspended after the earthquake (Nikkei, August 27, 2026)
- [JR Kyushu] Kyushu Shinkansen Kumamoto-Shin-Minamata section to resume operation on September 18 (August 27, 2026)