

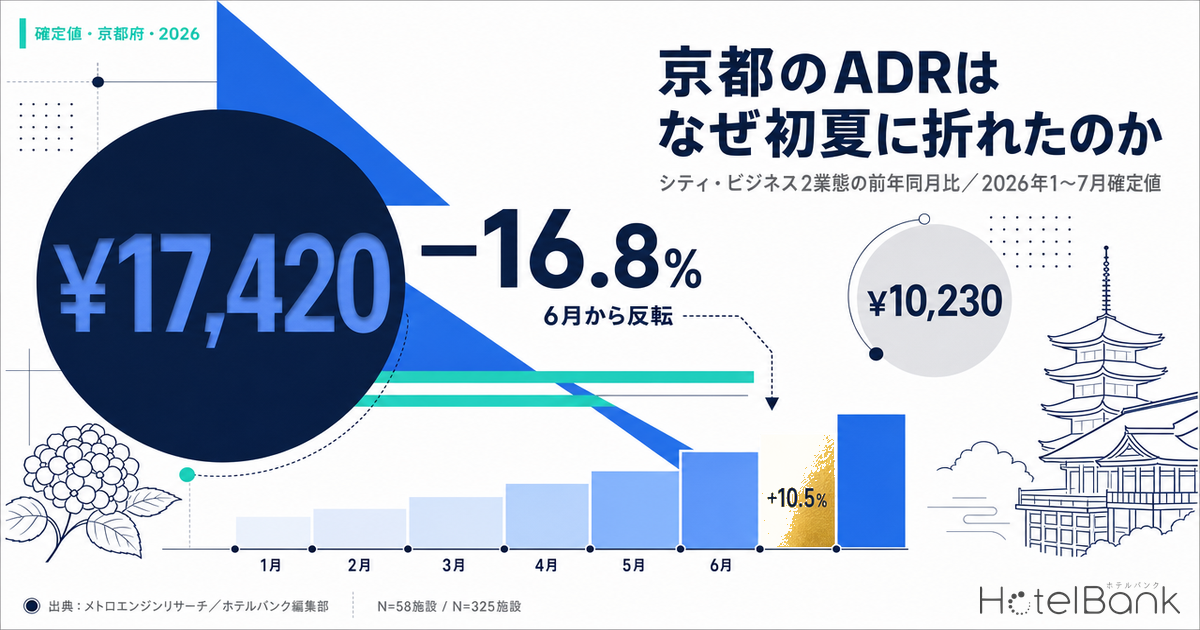
Kyoto Prefecture city hotels recorded an estimated settled ADR of ¥17,420 (N=58 properties) on finalized July 2026 figures — against ¥20,926 in the same month a year earlier, −16.8%. Business hotels came in the same month at ¥10,230 (N=325 properties), down from ¥11,752 a year earlier, or −13.0%. But this is not a story of “weak all year long.” Going back through the same finalized series, March was city +2.4% / business +6.7%, and May was city +3.7% / business +10.5% — both categories positive. Kyoto held its pricing through spring, then reversed in June — that single point defines the first half of 2026 here. This article lines up YoY comparisons between finalized months from January to July by hotel category, and cross-checks them against occupancy levels, current booking pace and disclosed operating results to read what the break means.
Scope: city hotels in Kyoto Prefecture (July 2026, N=58 properties) and business hotels (same month, N=325 properties). The price metric in this article is estimated settled ADR (the transaction price level estimated from OTA and other sales data, tax-excluded equivalent); occupancy is an estimate based on OTA-listed inventory. Definitions for both appear at the end of the article. Data as of August 30, 2026.
- — Estimated settled ADR for July 2026 was city ¥17,420 (−16.8%) and business ¥10,230 (−13.0%). Both are YoY comparisons between finalized figures.
- — But the year is not weak throughout. March and May were positive for both categories (May: city +3.7%, business +10.5%), and the direction reversed in June.
- — The 2025 comparison base was a year that pushed all the way up. Kyoto City recorded a room occupancy rate of 80.6% (full-year 2025, +2.8 points YoY) and an average room rate of ¥21,286 (+5.8%).
- — Occupancy has not fallen. Estimated OCC for June and July was city 87.4% / 86.1% and business 85.8% / 83.4% — a decline in which only rate gave way.
- — Nationwide conditions do not explain it. For three listed hotel REITs in July 2026, ADR ran −1.0% to +0.1% YoY, essentially flat.
January–July 2026 in Finalized Figures — The Break Starts in June
First, the ground rules. Estimated settled ADR becomes a finalized figure once a month closes; months that have not closed remain estimates based on current sales conditions. YoY comparison is valid only between finalized figures, so the scope here is limited to the seven months from January to July 2026. August 2026 onward is a current-point estimate and is excluded from YoY comparison.
Laid out by category, those seven months show a clear shape. January and February opened slightly soft — city −8.9% and −0.3%, business −3.7% and −3.0%. March turned positive at city +2.4% and business +6.7%. April split by category, city −8.1% and business +1.3%. May was city +3.7% and business +10.5% — both positive, and the largest gains of the year. Then June came in at city −14.6% and business −9.8%, and July at city −16.8% and business −13.0%: a two-step move to the downside.
Source: MetroEngines Research; compiled by the HotelBank Editorial Team
What matters is not only the absolute size of the declines but the gap between May and June. Business hotels went from +10.5% in May to −9.8% in June; city hotels swung from +3.7% to −14.6%. A market’s underlying strength does not normally turn over by 20 points in a single month, so unpicking this requires looking at both how high the same months of 2025 were and how prices were set once 2026 began. The next section covers both. For the month in which the reversal first appeared, Kyoto Hotel ADR Falls YoY in June 2026: City −14.6%, Business −9.8% breaks down the monthly detail as it stood then.
| Stay month | City 2025 | City 2026 | YoY | Business 2025 | Business 2026 | YoY |
|---|---|---|---|---|---|---|
| January | ¥20,233 | ¥18,432 | −8.9% | ¥10,148 | ¥9,773 | −3.7% |
| February | ¥18,724 | ¥18,660 | −0.3% | ¥9,941 | ¥9,641 | −3.0% |
| March | ¥26,141 | ¥26,774 | +2.4% | ¥15,904 | ¥16,969 | +6.7% |
| April | ¥32,625 | ¥29,986 | −8.1% | ¥20,038 | ¥20,308 | +1.3% |
| May | ¥24,956 | ¥25,867 | +3.7% | ¥13,820 | ¥15,278 | +10.5% |
| June | ¥20,768 | ¥17,738 | −14.6% | ¥10,659 | ¥9,616 | −9.8% |
| July | ¥20,926 | ¥17,420 | −16.8% | ¥11,752 | ¥10,230 | −13.0% |
Estimated settled ADR, tax-excluded equivalent. All figures are finalized (past months). City N=55–58 properties/month; business N=312–329 properties/month. Source: MetroEngines Research; compiled by the HotelBank Editorial Team
The 2025 Comparison Base Was a Year That Pushed All the Way Up
To judge the 2026 decline, it helps to establish what kind of year 2025 was. Taking 2025 YoY figures (against 2024) from the same finalized estimated settled ADR series, Kyoto city hotels were +15.8% in April, +12.6% in June and +10.7% in January; business hotels were +24.3% in April, +15.2% in May and +9.7% in June — a year that built up substantially from spring into early summer.
| Stay month | City hotels, 2025 YoY | Business hotels, 2025 YoY |
|---|---|---|
| January | +10.7% | +4.3% |
| February | +1.1% | −0.2% |
| March | −5.7% | +1.5% |
| April | +15.8% | +24.3% |
| May | +7.3% | +15.2% |
| June | +12.6% | +9.7% |
| July | +2.7% | +7.7% |
YoY between finalized estimated settled ADR figures. Source: MetroEngines Research; compiled by the HotelBank Editorial Team
This picture of a 2025 that pushed all the way up is consistent with official market statistics. According to the Kyoto City Tourism Association’s Data Annual Report (2025), Kyoto City in 2025 posted a hotel room occupancy rate of 80.6% (full-year 2025, +2.8 points YoY), an average room rate of ¥21,286 (+5.8%) and a room revenue index of ¥17,156 (+9.6%). Total guest nights reached 10,549,946 (+4.9%), with foreign guests accounting for 66.4% (+5.6 points). Occupancy and rate rose together, and 2026 is measuring its YoY against that base.
There was also a time-limited demand factor in Kansai in 2025. EXPO 2025 Osaka, Kansai, Japan ran for 184 days from April 13 to October 13, 2025, with officially announced total attendance of roughly 29.02 million. The event period covers April through October 2025 in full. Kyoto was not the host city, but the period when wide-area lodging demand moved does overlap with the months showing the clearest YoY declines in 2026. That alone, however, does not explain the month-by-month shape. Since May 2026 — measured against May 2025, which fell inside the Expo period — was positive at city +3.7% and business +10.5%, the double-digit declines in June and July cannot be written off as a rebound from last year’s one-off factor alone. Following the same finalized series on the Osaka side, where the Expo was actually held, the rebound takes a different shape that deepens month by month; Osaka Settled ADR June 2026: City −26.3%, Business −32.8% Post-Expo breaks that down. Looking at the levels themselves across years shows why.
Source: MetroEngines Research; compiled by the HotelBank Editorial Team
Overlaying the years for city hotels, the 2026 line matches or exceeds the 2025 line in March and May, yet in June and July alone it sinks below not just 2025 but the 2024 line (June ¥18,446 / July ¥20,374). July is −14.5% even against the same month two years earlier: early summer alone has given back two years of accumulated gains. Put another way, Kyoto city hotels are holding the demand peaks of March, April and May, but rate no longer holds in the trough between the peaks (June–July).
Source: MetroEngines Research; compiled by the HotelBank Editorial Team
Business hotels are more extreme. May 2026 at ¥15,278 sits well above May 2024 (¥11,993); the spring capture is if anything stronger. In the seasonal trough, June was ¥9,616 and July ¥10,230. June came in slightly below June 2024 (¥9,713), so the gap between peak months and trough months has widened compared with two years ago. The structure is that selling high in March, April and May comes with a larger rate give-back in June and July, and the annual amplitude itself is expanding.
Demand Has Not Disappeared — Occupancy Levels and Current Booking Pace
When rate drops by double digits, the first thing to check is whether guests have stopped coming, or are coming but paying less. Looking at estimated OCC for Kyoto Prefecture (OTA-listed inventory basis) across the completed months of 2026, city hotels were 90.2% in March, 90.2% in April, 92.4% in May, 87.4% in June and 86.1% in July; business hotels were 90.5%, 88.0%, 92.9%, 85.8% and 83.4%. Even in June and July, when ADR fell by double digits, both categories stayed in the mid-to-high 80s. Splitting the same estimated OCC by day of week shows Thursday drawing level with Friday; Kyoto Day-of-Week OCC: Thursday 90.4% Edges Friday, May–Jul 2026 looks at how the week fills in detail.
| Stay month (2026) | City, estimated OCC | Business, estimated OCC | Properties covered (daily average) |
|---|---|---|---|
| March | 90.2% | 90.5% | 54 / 265 |
| April | 90.2% | 88.0% | 55 / 284 |
| May | 92.4% | 92.9% | 54 / 284 |
| June | 87.4% | 85.8% | 55 / 285 |
| July | 86.1% | 83.4% | 56 / 290 |
Estimated OCC (OTA-listed inventory basis), Kyoto Prefecture, average of daily values within each month. Source: MetroEngines Research; compiled by the HotelBank Editorial Team
It is also worth looking at how upcoming stay dates are selling. Using booking curves observed from 45 days before the stay date through the latest observation, representative September and October dates line up as follows. The gap between a weekday (Tuesday, September 8) and weekends or holiday weekends (Saturday, September 19; Monday, September 21 — Respect for the Aged Day; Saturday, October 10) is clear, and October 10 in particular is already above 90% for both city and business hotels at 45 days out. Autumn demand itself is not weak at this point.
| Stay date | City, 45 days out | City, 30 days out | City, latest observation | Business, 45 days out | Business, 30 days out | Business, latest observation |
|---|---|---|---|---|---|---|
| September 8 (Tue) | 77.1% | 80.4% | 82.6% | 64.2% | 67.9% | 67.4% |
| September 12 (Sat) | 80.8% | 83.3% | 87.6% | 74.8% | 78.3% | 83.2% |
| September 19 (Sat) | 84.1% | 87.9% | 89.8% | 78.0% | 82.4% | 86.7% |
| September 21 (Mon, holiday) | 85.8% | 90.6% | 93.7% | 77.7% | 84.0% | 88.5% |
| October 6 (Tue) | 84.4% | — | 85.1% | 76.5% | — | 78.5% |
| October 10 (Sat) | 92.5% | — | 92.8% | 91.9% | — | 92.4% |
Estimated OCC (OTA-listed inventory basis), based on observations from 45 days before the stay date through the latest observation. October 6 and October 10 had not yet reached the 30-days-out observation point as of this article’s data date, shown as “—”. Source: MetroEngines Research; compiled by the HotelBank Editorial Team
In short, the June–July rate decline is not the “nobody is staying” type but the inventory is moving while rate fails to follow type. Occupancy is being filled and rate is being lost — close to the most painful way to lose in RevPAR terms.
Cross-Checking Disclosed Operating Results — Flat Nationwide, Different in Kyoto
To separate whether the June–July drop reflects nationwide conditions or something specific to Kyoto, we refer to the July 2026 monthly operating results disclosed by listed hotel REITs. All figures below are quoted exactly as disclosed by each company.
| Investment corporation (July 2026 results) | Scope | Occupancy | ADR | RevPAR | ADR YoY |
|---|---|---|---|---|---|
| Invincible Investment Corporation (8963) | 101 domestic hotels | 86.3% | ¥15,100 | ¥13,039 | −1.0% |
| Japan Hotel REIT Investment Corporation (8985) | 29 hotels with variable-rent structures | 83.1% | ¥21,806 | ¥18,119 | +0.1% |
| Ichigo Hotel REIT Investment Corporation (3463) | Entire portfolio | 84.4% | ¥9,684 | ¥8,175 | −0.8% |
Monthly operating results as disclosed by each investment corporation. Portfolio composition and scope differ by company. Source: disclosure materials from each investment corporation (links at the end of the article)
All three report occupancy in the 83–86% range, with ADR roughly flat YoY at −1.0% to +0.1%. In nationally diversified portfolios, July 2026 ADR landed close to the prior year. Against that, estimated settled ADR in Kyoto Prefecture was −16.8% for city hotels and −13.0% for business hotels. A decline of a size that nationwide conditions cannot explain is showing up specifically in the Kyoto market — that is the natural reading. Note that estimated settled ADR is an estimate derived from OTA and other sales data, while the REIT figures are finalized operating results; both the sample populations and the definitions differ. They should be treated as material for comparing direction and order of magnitude, not subtracted from one another directly.
For Revenue Managers Running City and Business Hotels in Kyoto — Implications and Action Plan
(a) Operational insights
1. Separate “lost the year” from “lost the trough months.”Finalized market figures held positive in the peak months — March +2.4% / +6.7% and May +3.7% / +10.5% (city / business). If your own annual results are down YoY, break them out by month first and check whether the losing months are peak months or the June–July trough. If they cluster in the trough, that is happening market-wide, and your response can be narrowed to trough-month design.
2. Build the rate calendar assuming the peak-to-trough gap has widened.The market level for business hotels was ¥15,278 in May against ¥9,616 in June. The same room in the same property sells at rates this different simply because the month changed. If your rate calendar uses the same increments and the same revision frequency in peak and trough months, there is room for finer revision on the trough side.
3. Given that occupancy has not fallen, question how much a rate cut will achieve.Estimated OCC in June and July held at a high level — city 87.4% / 86.1% and business 85.8% / 83.4%. Where inventory is already moving, a further rate cut may shave ADR without lifting occupancy much. It is worth redefining the trough-month problem as “selling cheap” rather than “not selling.”
4. Treat autumn as a separate game.Saturday, October 10 already stands at city 92.5% and business 91.9% at 45 days out. Carrying June–July weakness into conservative autumn pricing risks giving away dates where demand is already there. Each month deserves its own basis for judgment.
| Time horizon | Action | Trigger (figures from this article) | Purpose |
|---|---|---|---|
| Today–this week | Put your own June and July 2026 actual ADR on one page alongside the finalized market figures | The market was ¥17,738 / ¥17,420 for city and ¥9,616 / ¥10,230 for business. If your property is well below this, property-specific factors weigh more heavily than market factors | Separate the decline into market factors and property factors |
| Today–this week | Re-examine your settings for the autumn holiday dates (September 19–21 and October 10) | For dates where market estimated OCC has already reached 85.8%–92.5% (city) at 45 days out, if your property alone still holds heavy remaining inventory | Avoid releasing dates with real demand at low rates |
| Within two weeks | Reset a rate floor specific to the trough months (June–July) | If trough-month estimated OCC is running around 85% and yet your property sits at the rate floor on many dates | Protect rate on dates where occupancy is already secured |
| Within two weeks | Switch to separate revision frequencies for weekdays versus weekends and holiday weekends | On a weekday (September 8), market estimated OCC for business hotels builds slowly, 64.2% → 67.4%, while on a holiday weekend (September 21) it moves fast, 77.7% → 88.5% | Match operational effort to how differently individual dates sell |
| Looking to next month | Draft the 2027 annual rate calendar with separate logic for peak months and trough months | In the market, city hotels beat the prior year in March and May, while June and July fell below even the level of two years ago | Lock in trough-month design as next year’s homework in advance |
| Looking to next month | Make it routine to recalculate YoY for August onward once each month is finalized | Market figures for August 2026 onward are current-point estimates and cannot support a YoY judgment until the month closes | Avoid premature decisions driven by estimates |
* The above are considerations drawn from market data and do not guarantee results. Judge according to your own property’s demand mix and distribution channel mix.
Conclusion — Three Yardsticks for the First Half of 2026 in Kyoto
Yardstick 1: Which months are losing.2026 in Kyoto is not a uniformly weak year but one with a monthly shape: March and May positive, June and July down double digits. Any discussion of a YoY shortfall at your own property should start from a monthly breakdown.
Yardstick 2: Occupancy or rate.Estimated OCC in June and July held high — city 87.4% / 86.1% and business 85.8% / 83.4% — while only estimated settled ADR fell by double digits. This is the type of decline where inventory moves but rate does not follow, and further rate cuts are unlikely to fix it.
Yardstick 3: Nationwide, or this city.For three listed hotel REITs, disclosed July 2026 results put ADR at −1.0% to +0.1% YoY. Nationally diversified portfolios are flat. Kyoto’s double-digit decline cannot be explained by nationwide conditions alone and should be treated as specific to this market.
Months from August 2026 onward are not yet finalized. Estimates based on current sales conditions move daily, so how August and September actually landed will have to be re-measured between finalized figures once the months close. To avoid scrambling then, the thing to look at now is next year’s homework: how to design the trough months.
About the Data
- Definition of estimated OCC: OTA-listed inventory occupancy rate = 100 − 100 × rooms still listed on OTAs ÷ total rooms. It is an estimate based on how listed inventory is being sold down, and is defined differently from actual room occupancy (it reads higher). This article covers Kyoto Prefecture, monthly averages of daily values for March–July 2026, and individual stay dates in September and October.
- Booking curves: based on observations from 45 days before the stay date through the latest observation.
- Definition of estimated settled ADR: the transaction price level (tax-excluded equivalent) estimated from OTA and other sales data (lowest-plan level × category coefficient, ensembled across multiple channels). Past months are finalized figures; current and future months are estimates based on current sales conditions. Median error against disclosed operating results is 6.6%. All YoY comparisons in this article are between finalized figures, and current-point estimates for August 2026 onward are excluded from YoY comparison.
- Breakdown of N: for Kyoto Prefecture city hotels, estimated settled ADR covers 53–58 properties per month (July 2026, N=58 properties); for business hotels, 297–331 properties per month (July 2026, N=325 properties). For estimated OCC, coverage averages 54–56 city properties and 265–290 business properties per day.
- Operating results for the investment corporations are quoted directly from each company’s disclosures; covered properties and aggregation scope differ by company. Sample populations and definitions differ from estimated settled ADR and estimated OCC, so the levels are not suited to direct comparison.
- Data as of August 30, 2026. Sales conditions and inventory change daily, so the figures in this article are a snapshot as of the retrieval date.
References and Sources
■ Data sources
Estimated settled ADR and estimated OCC compiled from publicly available OTA information (Kyoto Prefecture, city hotels and business hotels); monthly operating results disclosed by three listed hotel REITs; and the Kyoto City Tourism Association’s Data Annual Report (2025). Data as of August 30, 2026.
■ Calculation assumptions
YoY figures are calculated only between finalized values (closed past months); months from August 2026 onward, which are current-point estimates, are excluded from comparison. Categories are fixed to two segments, city hotels and business hotels, and the month is the base unit of aggregation (no daily or day-of-week price decomposition). Only estimated settled ADR (tax-excluded equivalent) is used as the price metric; listed-price levels are not used.
■ Limitations and caveats
Estimated settled ADR is a level estimated from OTA and other sales data, with a median error of 6.6% against disclosed operating results. Estimated OCC is an OTA-listed inventory metric, defined differently from actual room occupancy and reading higher. Disclosed figures from listed hotel REITs cover different sample populations and scopes than our estimates, so they are used to compare direction and magnitude rather than levels directly. Coverage counts vary by month, so please also refer to the breakdown of N at the end of this section.
- Kyoto City Tourism Association, “Kyoto City Tourism Association Data Annual Report (2025)”: https://www.kyokanko.or.jp/report/hotel2025
- EXPO 2025 Osaka, Kansai, Japan official site, “[Updated] Visitor Numbers and Admission Ticket Sales”: https://www.expo2025.or.jp/news/news-20251014-01/
- Invincible Investment Corporation, July 2026 Monthly Operating Results: https://www.invincible-inv.co.jp/news/upd/140120260825525695.pdf
- Japan Hotel REIT Investment Corporation, Monthly Operating Results Data: https://www.jhrth.co.jp/file/review_exceldl-347fcee763387952f68e1b7a06e0839aaef0cd6e.xlsx
- Ichigo Hotel REIT Investment Corporation, July 2026 Monthly Operating Results: https://www.ichigo-hotel.co.jp/ir/news/news_file/file/IchigoHotel_20260825_Monthly_Operating_Results_JPN.pdf
Related Reading
- Kyoto Hotel ADR Falls YoY in June 2026: City −14.6%, Business −9.8% — a monthly breakdown
- Kyoto Day-of-Week OCC: Thursday 90.4% Edges Friday, May–Jul 2026
- Kyoto Reviews vs Settled ADR: Bathroom 4.002 Weakest, July ¥17,420
- Osaka Settled ADR June 2026: City −26.3%, Business −32.8% Post-Expo
- Kyoto Obon 2026 Booking Curves: Ryokan Add the Most Close In, +11.4pt