

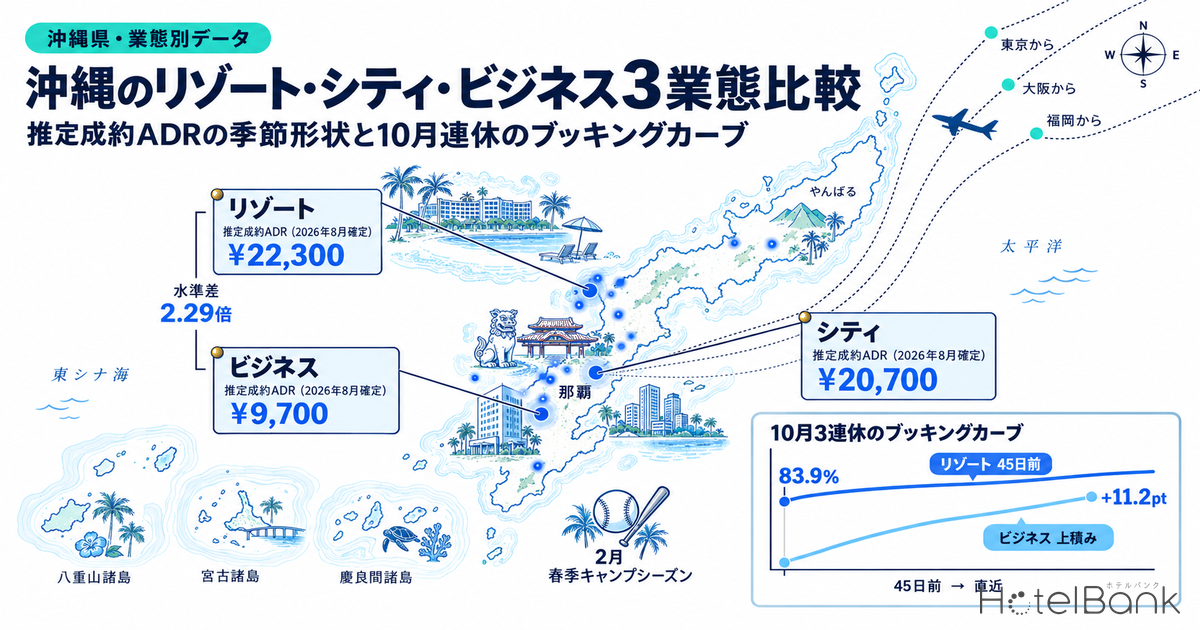
Split Okinawa’s lodging market into three segments — Resort, City and Business — and all three look like different businesses: price level, seasonal shape and the way bookings accumulate. On a finalized basis for August 2026, estimated settled ADR was ¥22,300 for Resort (N=282 properties, +3.1% YoY), ¥20,700 for City (N=15 properties, −0.2% YoY) and ¥9,700 for Business (N=196 properties, +3.3% YoY). Turn to the booking pace for Japan’s October long weekend (Sat Oct 10 – Mon Oct 12, a public holiday) and the picture diverges again. For the first night of that weekend, Saturday October 10, 2026, Resort already sat at an estimated 83.9% OCC 45 days before the stay date (stay date Oct 10, 2026, N=198 properties, estimated on an OTA-listed-inventory basis) and has added only +4.6pt since. Business started from 76.8% at the same 45-day mark (N=138 properties) and has built +11.2pt to reach 88.0%. Same prefecture, same stay date — and yet the lever a revenue manager should be pulling is different for each segment. This article isolates that difference quantitatively along two axes: estimated settled ADR and the booking curve.
Scope: Resort, City and Business hotels in Okinawa Prefecture. Property counts for estimated settled ADR on a finalized August 2026 basis are Resort N=282, City N=15, Business N=196. The booking-curve cohorts are Resort N=198 properties / 16,763 rooms and Business N=138 properties / 12,909 rooms (based on listings on major booking sites). The price metric throughout is estimated settled ADR (the settled price level inferred from OTA and other sales data, tax-exclusive equivalent); occupancy is an estimate on an OTA-listed-inventory basis. Both definitions appear at the end of the article. Data as of September 19, 2026.
• ADR (average daily rate) = an estimated settled rate (tax-exclusive equivalent) calculated by applying segment-specific adjustment coefficients to the lowest published plan level each property lists on OTAs (two guests per room, per-room rate, tax-inclusive). Cross-checked against property-level results disclosed by listed hotel REITs (91 properties, trailing three months), the median error is approximately 7%. These are estimates and differ from each property’s actual transacted prices and accounting figures.
• ADR at the area level (prefecture or municipality) is the median of the estimated settled rates of the properties in scope — the level of a typical property in that area.
• Where listed prices are referenced, the figure is the per-room rate for two guests per room (tax-inclusive).
• OCC (occupancy) = the share of sold rooms against total rooms in the area (an estimate based on inventory sold through OTAs).
• Source: MetroEngines Research (continuous tracking of OTA published prices for approximately 168,000 properties in Japan, of which roughly 27,000 have confirmed operating status)
- — Estimated settled ADR spans a 2.29x gap — on a finalized August 2026 basis, Resort ¥22,291, City ¥20,654, Business ¥9,734. Three markets a full price tier apart coexist inside one prefecture.
- — The annual peak month differs by segment — Resort peaks in August, but City and Business both peak in February (¥23,782 / ¥10,648). An annual plan built on “Okinawa’s high season = summer” drops one peak entirely for urban inventory.
- — Resort’s build-up is constant regardless of the date — over the identical 45-days-out to 30-days-out window, all five stay dates land at +3.5 to +3.7pt. Business, by contrast, swings from +6.0 to +10.3pt depending on the date.
- — The segment gap opens on weak-demand days, not peak days — at the 30-days-out cross-section the Resort-minus-Business gap is +2.9pt on Sat Oct 10, but +11.7pt on Mon Oct 12, the final day of the long weekend.
- — The same pattern holds in other prefectures — the 30-days-out segment gap for Oct 12 is +11.3pt in Yamanashi and +13.7pt in Kagawa. The gap opening is not unique to Okinawa; what is distinctive about Okinawa is the height of the levels.
Three segments through estimated settled ADR — a 2.3x level gap and peak months that do not line up
Start with price levels. Past months are finalized values while the current and future months are estimates based on the sales position as of now, so year-on-year comparisons are made only between finalized months. The most recent finalized month is August 2026.
| Segment | June 2026 (finalized) | July 2026 (finalized) | August 2026 (finalized) | August YoY | N= (August) |
|---|---|---|---|---|---|
| Resort hotels | ¥16,200 | ¥20,864 | ¥22,291 | +3.1% | 282 |
| City hotels | ¥18,178 | ¥20,706 | ¥20,654 | −0.2% | 15 |
| Business hotels | ¥8,764 | ¥9,496 | ¥9,734 | +3.3% | 196 |
Source: MetroEngines Research; compiled by the HotelBank Editorial Team
As of August 2026 there is a 2.29x spread between Resort and Business estimated settled ADR, and still 2.12x between City and Business. Within the single market of Okinawa Prefecture, three markets a whole price tier apart sit side by side. Note that in July, Resort at ¥20,900 and City at ¥20,700 were almost level; in August Resort climbed to ¥22,300 while City stayed roughly flat at ¥20,700, so at the height of summer Resort pulls ahead on its own.
On a year-on-year basis, June showed double-digit growth across all three segments — Resort +17.7%, City +12.0%, Business +13.6% — but July came in at +9.9% / +9.0% / +7.6% and August at +3.1% / −0.2% / +3.3%. The closer the calendar gets to high season, the more the growth rate compresses. The straightforward reading is that the months where last year’s level was already high leave less room to add on top. Put the other way round: the headroom sits in the shoulder months, not at the height of summer. The relationship between the segment mix of new supply and the finalized July figures is covered in detail in our analysis of Okinawa’s 2,842 new rooms divided back out by segment.
More important still is the difference in annual shape. Taking the cheapest and most expensive month among the finalized months of 2026 (January to August): Resort runs from ¥15,100 in January to ¥22,300 in August, +48.0%; City from ¥17,600 in May to ¥23,800 in February, +35.0%; Business from ¥8,600 in April to ¥10,600 in February, +23.3%. Resort peaks in August, but City and Business both peak in February — a clear misalignment between segments.
Source: MetroEngines Research; compiled by the HotelBank Editorial Team
The February peak was absent in 2025 (February 2025 was ¥18,500 for City and ¥8,400 for Business, both below that year’s August), so it is a shape that emerged in 2026. Okinawa hosts Japanese professional baseball spring training camps across the prefecture every February, and according to estimates by the Ryugin Research Institute, the 2026 camps drew roughly 430,000 spectators — about 130,000 of them from outside the prefecture, a record high — with an economic impact of ¥22.221 billion, of which the lodging industry accounted for the largest share at ¥5.14 billion (Ryukyu Shimpo). It reads as a season in which visitors from outside the prefecture flow toward urban inventory in Naha and the central region, observed here as a price shape.
Estimated OCC for elapsed months — Resort is flat, Business swings hard by day of week
Next, the demand side. Results for elapsed months on estimated OCC (OTA-listed-inventory basis) are shown below. Note that while the cohort is fixed per stay date, the set of properties meeting the listing threshold rotates from day to day, so the number of properties in scope moves even within a month. The N= in the table is the representative value (the mode) for each month.
| Month | Resort estimated OCC | N= | Business estimated OCC | N= |
|---|---|---|---|---|
| May 2026 | 85.5% | 177 | 84.4% | 130 |
| June 2026 | 86.5% | 174 | 85.7% | 132 |
| July 2026 | 90.3% | 180 | 90.7% | 132 |
| August 2026 | 87.2% | 182 | 84.7% | 136 |
| September 2026 (1st–19th) | 86.8% | 197 | 88.4% | 138 |
Source: MetroEngines Research; compiled by the HotelBank Editorial Team
On a monthly average the two segments look close, and in July they sit at roughly 90% together. Break the daily figures out by day of week, however, and a completely different face appears. For August 2026, estimated OCC by day of week ran from 85.6% on Monday to 89.2% on Saturday for Resort — a spread of 3.6pt — against 81.8% on Monday to 87.1% on Saturday for Business, a spread of 5.3pt. July is starker still: Resort moved only 2.5pt, from 89.6% on Thursday to 92.1% on Saturday, while Business spanned 8.2pt, from 87.3% on Monday to 95.5% on Saturday.
Source: MetroEngines Research; compiled by the HotelBank Editorial Team
Resort demand is centred on multi-night, destination-style stays, so inventory depletion is less uneven across the week; Business demand rotates with the day of week. The practical implication is simple. For Resort, the game is how to translate the height of demand for a given month into price; for Business, the game is which day of the week you choose to hold inventory back on. Even within the same prefecture, the very granularity at which rates should be revised differs by segment.
The October long-weekend booking curve — comparing three points: 45 days out, 30 days out and latest
From here the view shifts to future dates. Monday October 12, 2026 is Sports Day in Japan, making Oct 10 (Sat) through Oct 12 (Mon, public holiday) a three-day weekend (Cabinet Office, “National Holidays”). For those three days, plus an ordinary weekend (Sat Oct 17) and a weekday (Wed Oct 14) as comparison dates, the table below lines up estimated OCC at three cross-sections: 45 days before the stay date, 30 days before, and the latest reading.
| Stay date | Resort 45 days out | 30 days out | Latest | Gain | Business 45 days out | 30 days out | Latest | Gain |
|---|---|---|---|---|---|---|---|---|
| Oct 10 (Sat) | 83.9% | 87.5% | 88.5% | +4.6pt | 76.8% | 84.6% | 88.0% | +11.2pt |
| Oct 11 (Sun) | 80.1% | 83.6% | 84.4% | +4.3pt | 70.6% | 76.6% | 80.2% | +9.6pt |
| Oct 12 (Mon, holiday) | 76.5% | 80.2% | 81.4% | +4.9pt | 61.8% | 68.5% | 71.3% | +9.5pt |
| Oct 14 (Wed) | 76.5% | 80.1% | 81.2% | +4.7pt | 58.9% | 69.2% | 72.1% | +13.2pt |
| Oct 17 (Sat) | 81.6% | 85.3% | 85.4% | +3.8pt | 75.8% | 82.2% | 82.7% | +6.9pt |
Source: MetroEngines Research; compiled by the HotelBank Editorial Team. Scope = Resort 198–199 properties / 16,763–16,781 rooms, Business 137–138 properties / 12,893–12,909 rooms (based on listings on major booking sites). The timing of the latest cross-section varies by stay date, falling between 22 and 29 days out.
Three things stand out.
First, Resort and Business start their curves from completely different places. At 45 days out, Resort has already reached 76.5–83.9% on all three days of the long weekend, while Business sits at 61.8–76.8%. The widest gap comes on Oct 12 (Mon, holiday), where the two are 14.7pt apart at 45 days out. Resort fills early; Business fills late.
Second, the ranking reverses on the size of the gain. The increase in estimated OCC from 45 days out to the latest reading is +4.3 to +4.9pt for Resort across the long weekend and +3.8pt on the ordinary weekend of Oct 17 — all of them under 5pt, and all stable. Business, by contrast, gains +9.5 to +11.2pt across the long weekend and, on the Wednesday of Oct 14, +13.2pt. Business bookings move substantially inside the final 45-day window. Where to place 45 days out, 30 days out and 14 days out as decision checkpoints is a question we have worked through segment by segment in our Okinawa season countdown calendar; the short version is that Resort is decided early and Business is still live late.
Source: MetroEngines Research; compiled by the HotelBank Editorial Team
Third, the segment gap opens on the final day of the long weekend rather than on its peak day. On the opening day, Oct 10 (Sat), the latest cross-section shows Resort at 88.5% and Business at 88.0% — just 0.5pt apart. On the closing day, Oct 12 (Mon, holiday), it is 81.4% against 71.3%, a gap of 10.1pt, and the Wednesday of Oct 14 shows 81.2% against 72.1%, a gap of 9.1pt. On the days when demand is thickest both segments fill; the thinner demand gets, the better destination-style Resort inventory holds up and the more urban Business inventory falls away. The assumption that “it is a public holiday, so every segment is strong” does not hold from the middle day of the weekend onward. The same structure — a segment gap opening on the closing holiday of an October long weekend — has been observed in Yamanashi Prefecture as well, where Resort held 76.7% on the holiday Monday.
Re-compare the gains over the same window — normalising 45 days out to 30 days out
Because the “latest” column above is captured between 22 and 29 days out depending on the stay date, the length of the observation window behind the “Gain” column differs from one date to the next. Comparing a long weekend against an ordinary weekend while the windows are unequal makes the dates with shorter windows look as though they gained less. The table below therefore re-compares using only the 15-day stretch from 45 days out to 30 days out, which is identical in length for every stay date.
| Stay date | Resort 45 days out | 30 days out | Gain (normalised) | Business 45 days out | 30 days out | Gain (normalised) | Segment gap at 30 days out |
|---|---|---|---|---|---|---|---|
| Oct 10 (Sat) | 83.9% | 87.5% | +3.6pt | 76.8% | 84.6% | +7.8pt | +2.9pt |
| Oct 11 (Sun) | 80.1% | 83.6% | +3.5pt | 70.6% | 76.6% | +6.0pt | +7.0pt |
| Oct 12 (Mon, holiday) | 76.5% | 80.2% | +3.7pt | 61.8% | 68.5% | +6.7pt | +11.7pt |
| Oct 14 (Wed) | 76.5% | 80.1% | +3.6pt | 58.9% | 69.2% | +10.3pt | +10.9pt |
| Oct 17 (Sat) | 81.6% | 85.3% | +3.7pt | 75.8% | 82.2% | +6.4pt | +3.1pt |
Source: MetroEngines Research; compiled by the HotelBank Editorial Team. Scope = Resort 198–199 properties / 16,763–16,781 rooms, Business 137–138 properties / 12,893–12,909 rooms (based on listings on major booking sites). Estimated OCC is an estimate on an OTA-listed-inventory basis.
Normalising changes one part of the reading. Resort’s gain lands within +3.5 to +3.7pt on all five stay dates — near-constant whether the date is a long weekend, an ordinary weekend or a weekday. In other words, the apparent result at the latest cross-section that “the ordinary weekend of Oct 17 gained +3.8pt” is largely an artefact of an observation window that only runs to 29 days out; it is not that ordinary weekends gain less. The right way to read Resort’s accumulation over the final 45 days is as a structural constant that barely depends on the attributes of the stay date. Business, meanwhile, still swings by date after normalisation, at +6.0 to +10.3pt, and the largest value is not on the long weekend at all but on the Wednesday of Oct 14 (+10.3pt). The property that “Business is what moves late” holds; how much moves on which day still has to be read date by date.
Is this segment gap unique to Okinawa? Setting it alongside Yamanashi and Kagawa
To check whether the widening gap on the closing day of a long weekend is peculiar to Okinawa, the table below lines up the 30-days-out cross-section — the same observation window — for other prefectures on that same date, Monday October 12, 2026.
| Prefecture | Resort, 30 days out | Business, 30 days out | Segment gap | N= (properties) |
|---|---|---|---|---|
| Okinawa | 80.2% | 68.5% | +11.7pt | Resort 199 / Business 138 |
| Yamanashi | 75.8% | 64.5% | +11.3pt | Resort 31 / Business 43 |
| Kagawa | 60.3% | 46.6% | +13.7pt | Resort 11 / Business 43 |
Source: MetroEngines Research; compiled by the HotelBank Editorial Team. Because the property counts are small for Yamanashi Resort (N=31) and Kagawa Resort (N=11), the Resort figures for both prefectures should be treated as reference values. Estimated OCC is an estimate on an OTA-listed-inventory basis.
The direction — Resort holding up and Business falling away on the closing day of a long weekend — is common to all three prefectures, and the segment gap lands in much the same band: +11.7pt in Okinawa, +11.3pt in Yamanashi, +13.7pt in Kagawa. The widening gap on a long weekend’s closing day is therefore not an Okinawa-specific phenomenon but a broadly observable consequence of the demand structures of destination-style versus urban inventory. What is specific to Okinawa is not the size of the gap but the height of the levels: even on the closing day, Resort builds to 80.2% and Business to 68.5%, the highest of the three prefectures. The conclusion for practitioners is that the baseline for evaluating your own curve belongs with “the standard shape for the same segment in the same prefecture,” not with the same segment elsewhere.
For reference, estimated settled ADR for future months is an estimate based on the current sales position: for October 2026 it stands at ¥16,000 for Resort (N=278 properties), ¥19,300 for City (N=16 properties) and ¥10,100 for Business (N=193 properties). A direct comparison against finalized values has to wait for month-end, but the fact that Resort drops sharply from its finalized August level of ¥22,300 while Business runs above its finalized August level of ¥9,700 is consistent with how the curves above read.
For revenue managers running Resort, City and Business properties in Okinawa — implications and an action plan
(1) Check your own curve against the standard shape for your segment. If you run a Resort property, your baseline is the fact that at 45 days out the market already starts the long weekend from a high 76.5–83.9%. If your property is clearly below the market at that stage, then with the market adding only +4.3 to +4.9pt over the final 45 days, it is realistic to assume the room to recover later is limited. If you run a Business property, the opposite applies: 61.8–76.8% at 45 days out is the standard “nothing has moved yet” position, and that level alone is thin justification for cutting rates. The market is adding +9.5 to +13.2pt in the closing stretch.
(2) Move the peaks on your rate calendar to match your segment. On 2026 finalized values, Resort peaks in August (¥22,300) while City and Business peak in February (¥23,800 / ¥10,600). If you hold urban inventory, an annual plan that treats only summer as high season may be designed to miss the February peak entirely. When you revisit your annual rate design, there is a case for treating February as a revision point on a par with summer.
(3) Treat day of week as a question of how you hold inventory, not of price. Estimated OCC by day of week for July 2026 spanned 2.5pt for Resort and 8.2pt for Business. Business operations see clear peaks and troughs within the week, so how you weight group, multi-night and OTA allocations across the days changes what you leave on the table. Resort, with a smaller day-of-week spread, gets more value out of spending that time on inventory control at the monthly rather than weekly level.
(4) Design the opening and closing days of a long weekend as separate products. At the latest cross-section, Oct 10 (Sat) reaches roughly 88% for both segments, while Oct 12 (Mon, holiday) sits at 81.4% for Resort and 71.3% for Business. When the market fills that differently inside a single long weekend, treating all three days with one uniform tactic invites loss on both sides — selling out too early on the opening day and being left with unsold rooms on the closing day. For urban inventory in particular, there is room to build the closing day’s inventory around different demand from the opening day’s: extensions, late checkout, and short-haul local stays.
Translated onto a timeline, the following action plan suggests itself.
| Horizon | Action | Decision trigger (tied to figures in this article) | Objective |
|---|---|---|---|
| Today to this week | Take stock of your remaining rooms for Oct 12 (Mon, holiday) on its own | The market’s latest cross-section is 81.4% for Resort and 71.3% for Business. Is your property below that? | Separate the closing day’s shortfall from the opening day’s picture |
| Today to this week | Review stop-sells and the release of higher room categories for Oct 10 (Sat) | The market has reached 88.5% for Resort and 88.0% for Business; act if your property is at or above that | Avoid selling out the peak day with cheap inventory still open |
| Within two weeks | Business operations: switch to an inventory allocation that assumes a late-window build-up | The market gains +9.5 to +11.2pt from 45 days out to latest across the long weekend, and +13.2pt on the weekday of Oct 14 | Sell through without shaving rate via excessive early discounting |
| Within two weeks | Resort operations: build out the 45-days-out cross-section for November onward in advance | The market gains only +3.8 to +4.9pt from 45 days out to latest | Invest early, on the premise that there is little room to catch up afterwards |
| Looking to next month | Reconcile the peaks on your annual rate calendar against finalized values | Resort peaks in August at ¥22,291; City and Business peak in February at ¥23,782 / ¥10,648 | Design urban inventory so it does not miss February demand |
| Looking to next month | Promote shoulder-season pricing (April to June) to a priority workstream | Year-on-year change ran +17.7% / +12.0% / +13.6% in June against +3.1% / −0.2% / +3.3% in August | Concentrate revision resources on the months where headroom remains |
Source: MetroEngines Research; compiled by the HotelBank Editorial Team
In summary — three yardsticks for measuring Okinawa’s three segments
Yardstick 1: the levels differ by more than 2x, and the peak months do not line up. Finalized estimated settled ADR for August 2026 is ¥22,300 for Resort, ¥20,700 for City and ¥9,700 for Business. But the highest month of the year is August for Resort and February for City and Business, so an annual plan drawn on the single premise that “Okinawa’s high season is summer” drops one peak for urban inventory.
Yardstick 2: the starting point of the curve and the size of the gain trade off against each other. Resort starts high at 45 days out and gains +3.8 to +4.9pt; Business starts low and gains +6.9 to +13.2pt. A low figure at 45 days out means the opposite thing depending on the segment. When you evaluate your own curve, look at the distance from the standard shape for your segment rather than at the absolute value.
Yardstick 3: the segment gap appears on the thin-demand days, not on the peak days. Against a 0.5pt gap on Oct 10 (Sat), Oct 12 (Mon, holiday) shows 10.1pt and Oct 14 (Wed) 9.1pt. The days that separate you from your competitive set are not the days that sell out but the days that do not fill — and that is exactly where the room for revenue management improvement is concentrated.
About the data
■ Data sources
- Estimated settled ADR: the settled price level (tax-exclusive equivalent) inferred from OTA and other sales data (lowest published plan level x segment-specific coefficient, ensembled across multiple channels). Area-level values are the median of the estimated settled rates of the properties in scope — the level of a typical property in that area.
- Estimated OCC (OTA-listed-inventory basis): OTA-listed-inventory occupancy = 100 − 100 x rooms still listed on OTAs ÷ total rooms. The cohort comprises properties that list at least 30% of their total rooms on OTAs. Throughout the text this is written as “estimated OCC (OTA-listed-inventory basis).”
- Breakdown of N= in scope: for estimated settled ADR, Okinawa resort hotels (finalized August 2026 N=282 properties / August 2025 N=266 properties), city hotels (N=15 / N=11) and business hotels (N=196 / N=196). Estimated OCC for elapsed months covers Resort N=174–197 properties and Business N=130–138 properties. The booking curves cover Resort 198–199 properties / 16,763–16,781 rooms and Business 137–138 properties / 12,893–12,909 rooms (based on listings on major booking sites, 100% observation coverage). For the cross-prefecture comparison, Yamanashi covers 31 resort and 43 business properties, Kagawa 11 resort and 43 business properties.
- Data as of: September 19, 2026.
- Source: MetroEngines Research (continuous tracking of OTA published prices for approximately 168,000 properties in Japan, of which roughly 27,000 have confirmed operating status). External sources are listed under “References and sources.”
■ Calculation assumptions
- Separating finalized from estimated values: past months are treated as finalized values, while the current and future months are estimates based on the sales position as of now. Year-on-year changes are calculated only between finalized months. The most recent finalized month is August 2026.
- Booking-curve reference points: based on observations from 45 days before the stay date through to the latest reading, with three reference points — 45 days out, 30 days out and the latest cross-section. The stay dates in scope are those cited in the text, drawn from October 9 to October 18, 2026.
- Normalising the gains: the timing of the latest cross-section varies by stay date, falling between 22 and 29 days out. Wherever gains are compared across stay dates, they are normalised to the 15-day stretch from 45 days out to 30 days out, which is identical in length for every stay date. The cross-prefecture comparison uses the same 30-days-out cross-section.
- How the cohort is built: the cohort is fixed per stay date (the same set of properties is observed from 45 days out through to the latest reading for a given stay date). N= for elapsed months uses the value most frequently observed in that month (the mode).
- Basis for listed prices: where listed prices are referenced, the figure is the per-room rate for two guests per room (tax-inclusive).
■ Limitations and caveats
- Estimated OCC is not actual occupancy: it is an estimate based on the depletion of inventory sold through OTAs, and is defined differently from actual room occupancy. Because rooms not listed on OTAs are counted on the sold side, it reads higher than actual occupancy.
- Estimated settled ADR carries error: cross-checked against published operating results, the median error is 6.6%. These are estimates and differ from each property’s actual transacted prices and accounting figures.
- The property count moves within a month: because the set of properties meeting the listing threshold rotates from day to day, the number in scope varies even within the same month. The actual daily range in July 2026 was 174–187 properties for Resort and 130–136 for Business. The N= in the tables is the mode, not a fixed value common to every day.
- Small-sample segments and prefectures: city hotels (N=15) and, in the cross-prefecture comparison, Yamanashi Resort (N=31) and Kagawa Resort (N=11) have few properties in scope, so the movement of an individual property can shift the average. All are treated as reference values.
- Snapshot nature: sales positions and inventory move daily, so the figures in this article are a snapshot as of September 19, 2026. Figures for future dates will change with subsequent bookings and inventory adjustments.
References and sources
- Cabinet Office of Japan, “National Holidays” (confirming that October 12, 2026 is Sports Day)
- Ryukyu Shimpo, “Okinawa pro baseball camps: 2026 economic impact of ¥22.2 billion, down 0.9% year on year — Ryugin Research Institute”
- Ryugin Research Institute, “The economic impact of professional baseball spring training camps in Okinawa Prefecture”
Frequently asked questions
Q. How much does estimated settled ADR differ between Resort, City and Business hotels in Okinawa?
A. On finalized values for August 2026, Resort is ¥22,291 (N=282 properties), City is ¥20,654 (N=15 properties) and Business is ¥9,734 (N=196 properties). That is a 2.29x spread between Resort and Business and still 2.12x between City and Business, so three markets a full price tier apart coexist within the single market of Okinawa Prefecture. All figures are settled price levels (tax-exclusive equivalent) inferred from OTA and other sales data.
Q. Which month is the peak for lodging rates in Okinawa?
A. It depends on the segment. Across the finalized months of 2026 (January to August), Resort peaks in August (¥22,291) while City and Business both peak in February (¥23,782 / ¥10,648). The February peak was absent in 2025 and emerged in 2026; it coincides with the season in which visitors for the professional baseball spring training camps held across the prefecture flow toward urban inventory. An annual plan drawn on the single premise that “Okinawa’s high season is summer” will miss one peak entirely for urban inventory.
Q. When do bookings build for the October long weekend, and does it differ by segment?
A. Both the starting point and the pattern of accumulation differ. Estimated OCC for Saturday October 10, 2026 had already reached 83.9% for Resort at 45 days before the stay date, against 76.8% for Business. Aligning the observation window to the 15 days from 45 days out to 30 days out, Resort’s gain is near-constant at +3.5 to +3.7pt across all five comparison stay dates, while Business swings by date at +6.0 to +10.3pt. The structure is that Resort fills early and Business moves in the final window.
Q. Is a low estimated OCC at 45 days out a signal to cut rates?
A. Because it means the opposite thing depending on the segment, the absolute value alone cannot settle the question. For business hotels, 61.8–76.8% at 45 days out is the market’s standard shape, and the market goes on to add +9.5 to +13.2pt between then and the latest reading, so that level alone is thin justification for discounting. Resort, by contrast, starts high at 45 days out and then gains only +3.8 to +4.9pt, so if your property is clearly below the market at that point the room to recover later is limited. The right basis for evaluation is not the absolute value but the distance from the standard shape for the same segment in the same prefecture.
Q. Can the three days of a long weekend be treated with the same tactics?
A. There is a case for designing the opening and closing days separately. At the latest cross-section, Saturday October 10, 2026 shows Resort at 88.5% and Business at 88.0% — a segment gap of only 0.5pt — but the closing day, Monday October 12 (public holiday), widens to 81.4% against 71.3%, a gap of 10.1pt. On the days when demand is thickest both segments fill, while the thinner demand gets, the better destination-style Resort inventory holds up and the more urban Business inventory falls away. Treating all three days with one uniform tactic invites loss on both sides: selling out too early on the opening day and being left with unsold rooms on the closing day.
Q. Is this segment gap unique to Okinawa?
A. The fact that the gap opens is not unique to Okinawa. Lining up the Resort-versus-Business gap at the 30-days-out cross-section for Monday October 12, 2026 (public holiday) gives +11.7pt in Okinawa, +11.3pt in Yamanashi and +13.7pt in Kagawa — much the same band. What is specific to Okinawa is not the size of the gap but the height of the levels: even on the closing day of the long weekend, Resort builds to 80.2% and Business to 68.5%, the highest of the three prefectures. Note that Yamanashi Resort (N=31 properties) and Kagawa Resort (N=11 properties) have few properties in scope and are reference values.
Q. Is estimated OCC (OTA-listed-inventory basis) the same as actual room occupancy?
A. It is not. OTA-listed-inventory occupancy is calculated as “100 − 100 x rooms still listed on OTAs ÷ total rooms” and is an estimate based on the depletion of inventory sold through OTAs. Because rooms not listed on OTAs are counted on the sold side, it reads higher than actual room occupancy. The cohort comprises properties that list at least 30% of their total rooms on OTAs; it is fixed per stay date, but because the set of properties meeting the listing threshold rotates from day to day, the number in scope moves even within a month. The N= given in the text is the representative value (the mode) for that month.