

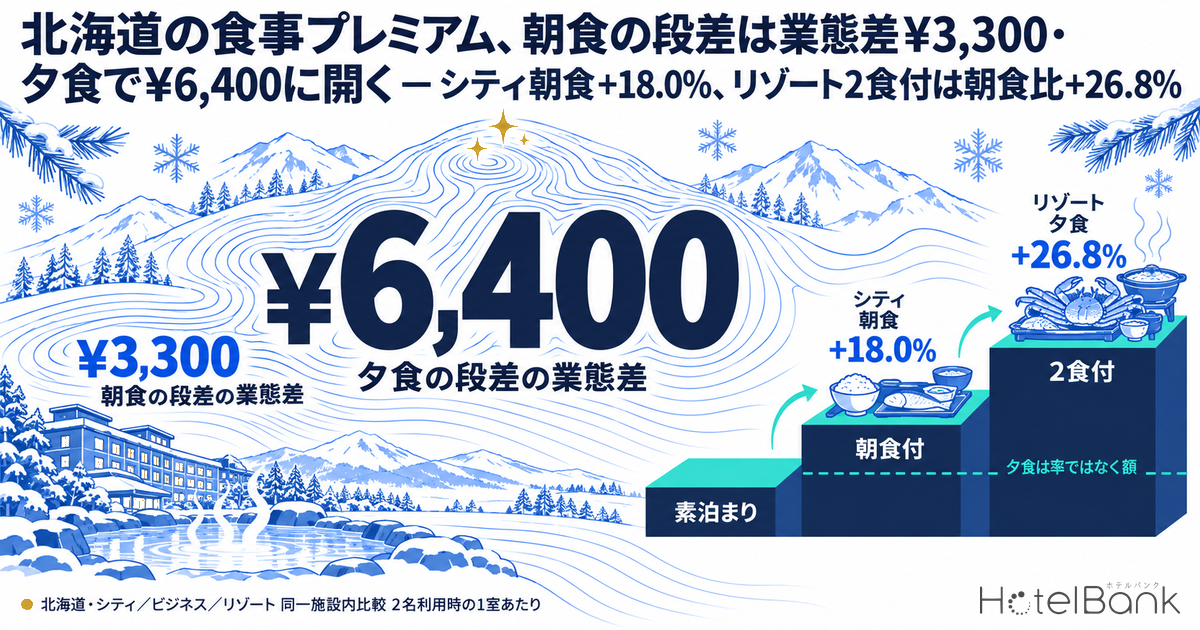
We compared the price gaps between room-only, breakfast-included and half-board (breakfast and dinner) plans sold by the same hotel in Hokkaido (stays in September 2026, excluding ryokan). Against room-only, the breakfast-included premium was +18.0% at city hotels (N=50), +10.0% at business hotels (N=194) and +7.8% at resort hotels (N=50). Expressed as the per-room difference for two guests, that is roughly ¥2,000–¥5,300, a spread of only about ¥3,300 across segments. The dinner step (half-board versus breakfast-included) was +30.0% at city hotels (N=26), +20.9% at business hotels (N=42) and +26.8% at resort hotels (N=44). In yen, city and resort hotels add about ¥11,000 while business hotels add about ¥4,600, so the gap between segments widens to roughly ¥6,400. The dinner step also stayed almost constant in yen from May through September; what moved month to month was the percentage. In other words, dinner is not priced as a percentage of the room rate but sold as a fixed amount added on top. This article uses that structure to work through how to set the price steps from room-only to breakfast-included to half-board.
Scope: city, business and resort hotels in Hokkaido (ryokan excluded). Meal-type comparisons use only pairs in which the same property sells both plan types (N = number of paired properties). Across Hokkaido as a whole, N=351 properties sell both breakfast-included and room-only. The price metric in this article is estimated settled ADR (the level of transacted prices estimated from OTA and other sales data, tax-exclusive equivalent). Definitions are given at the end of the article. Data as of September 23, 2026.
- — The breakfast step is about ¥2,000–¥5,300: in Hokkaido, the breakfast-included premium is +18.0% at city hotels (N=50), +10.0% at business hotels (N=194) and +7.8% at resort hotels (N=50), and the spread across segments is only about ¥3,300 (September 2026, per room for two guests).
- — The gap opens at the dinner step: the difference between half-board and breakfast-included is about ¥11,000 at city hotels (N=26), about ¥10,800 at resort hotels (N=44) and about ¥4,600 at business hotels (N=42), widening the spread across segments to about ¥6,400.
- — Dinner is sold as an amount, not a percentage: from May to September the dinner add-on stayed nearly constant in yen and only the percentage moved. Even in winter, when room rates rise, half-board allocations should be set from the add-on amount and the number of covers the kitchen can serve.
How We Measured Meal Premiums Within the Same Property
When measuring the premium on meal-inclusive plans, simply comparing the average price of properties that sell breakfast-included plans with the average of properties that sell room-only plans mixes in differences in the property mix. If breakfast-included plans are mostly offered by higher-priced properties, the gap reflects the difference in property class more than the value of breakfast. This article therefore isolates properties that sell both room-only and breakfast-included plans at the same hotel, and aggregates the price difference between the two within each property. Half-board versus breakfast-included, and half-board versus room-only, were aggregated the same way.
As a result, the number of properties (N) differs for each comparison. Among Hokkaido city hotels, N=50 properties sell both breakfast-included and room-only, while N=26 sell both half-board and breakfast-included. Fewer properties offer dinner-inclusive plans than breakfast-included ones. Ryokan were excluded because half-board is their standard offering, room-only pairs are hard to assemble, and their business structure differs. The figures below compare prices per room for two guests.
| Segment (September 2026) | Breakfast-included vs room-only | Half-board vs breakfast-included (dinner step) | Half-board vs room-only |
|---|---|---|---|
| City hotels | +18.0% (+¥5,273, N=50) | +30.0% (+¥10,991, N=26) | +53.2% (+¥16,227, N=27) |
| Business hotels | +10.0% (+¥1,986, N=194) | +20.9% (+¥4,631, N=42) | +32.4% (+¥6,562, N=41) |
| Resort hotels | +7.8% (+¥2,825, N=50) | +26.8% (+¥10,751, N=44) | +35.0% (+¥13,185, N=44) |
| All (including other segments) | +9.2% (+¥2,296, N=351) | +26.6% (+¥8,501, N=163) | +35.1% (+¥10,437, N=162) |
Source: Compiled by the HotelBank Editorial Team from MetroEngines Research (within-property comparison by meal type; per-room difference for two guests; ryokan excluded)
The Breakfast Step Varies Little by Segment; the Dinner Step Is Where Gaps Open
Ranked by percentage, the largest breakfast-included premium is at city hotels at +18.0% (N=50), followed by business hotels at +10.0% (N=194) and resort hotels at +7.8% (N=50). For the dinner step the order is city +30.0% (N=26), resort +26.8% (N=44) and business +20.9% (N=42), so resort hotels move up. Resort hotels keep the breakfast premium low and add their premium at dinner.
Source: Compiled by the HotelBank Editorial Team from MetroEngines Research (September 2026; see the table for N = paired properties)
Differences between segments are clearer in yen than in percentages. Per room for two guests, the breakfast step is ¥2,000 at business hotels, ¥2,800 at resort hotels and ¥5,300 at city hotels, so the gap between the highest and lowest is only about ¥3,300. The dinner step is ¥4,600 at business hotels versus ¥10,800 at resort hotels and ¥11,000 at city hotels — above ¥10,000 for the latter two — widening the spread across segments to about ¥6,400. Measured as a multiple of the breakfast step, the dinner step is about 2.1x at city hotels, about 2.3x at business hotels and about 3.8x at resort hotels. For reference, a separate prefecture-by-prefecture pair comparison of business hotels put the national median dinner add-on at +28.3% (¥4,451).
Source: Compiled by the HotelBank Editorial Team from MetroEngines Research (September 2026; breakfast step = breakfast-included minus room-only, dinner step = half-board minus breakfast-included; both within the same property)
These results are best read as differences in use case rather than as a ranking of segments. Business hotels mainly sell room-only and breakfast-included plans to weekday business travelers, many of whom expect to eat dinner outside the hotel. Adding breakfast costs around ¥2,000, and dinner-inclusive plans are also built with an add-on below ¥10,000. Many city hotels have their own restaurants, so breakfast itself carries a price. Resort hotels are often in locations with few restaurants nearby, making dinner in-house a natural part of the stay, so dinner becomes the main source of the premium.
The Dinner Step Is Set by Amount, Not Percentage — May to September Trend
Looking month by month at stays from May to September 2026, the dinner step (half-board minus breakfast-included) barely moves in yen. It stays within ¥9,900–¥11,000 at city hotels, ¥10,400–¥11,100 at resort hotels and ¥4,600–¥5,200 at business hotels. The percentage, by contrast, moved between 26.9% and 32.0% at city hotels and between 23.3% and 31.2% at resort hotels. In the summer peak (July and August), room prices rise while the dinner add-on stays nearly unchanged, so the step looks smaller in percentage terms.
| Stay month (2026) | City: dinner step | Business: dinner step | Resort: dinner step |
|---|---|---|---|
| May | +¥9,915 (+32.0%, N=25) | +¥4,683 (+27.8%, N=50) | +¥11,135 (+31.2%, N=41) |
| June | +¥10,378 (+29.9%, N=26) | +¥5,071 (+25.7%, N=49) | +¥10,686 (+27.1%, N=44) |
| July | +¥10,880 (+27.1%, N=27) | +¥5,157 (+22.9%, N=46) | +¥10,540 (+24.3%, N=44) |
| August | +¥10,686 (+26.9%, N=27) | +¥5,054 (+21.7%, N=43) | +¥10,413 (+23.3%, N=44) |
| September | +¥10,991 (+30.0%, N=26) | +¥4,631 (+20.9%, N=42) | +¥10,751 (+26.8%, N=44) |
Source: Compiled by the HotelBank Editorial Team from MetroEngines Research (per-room difference for two guests; within-property comparison of half-board and breakfast-included; ryokan excluded)
The breakfast step is also nearly constant in yen. Over May to September it ranged from ¥4,800 to ¥5,800 at city hotels (N=48–51) and from ¥1,800 to ¥2,000 at business hotels (N=194–198). Resort hotels were low in May at ¥1,700 (N=47) and at ¥2,700–¥3,200 (N=50–51) from June to September. The prevailing market practice appears to be that meal add-ons are not set by applying a percentage to the room rate, but built up separately as an amount that covers food and service costs.
That said, it is worth understanding what happens in months when the percentage falls. If the dinner add-on is held flat even in peak months when room prices rise, the room portion accounts for a larger share of the half-board price. The gap to room-only and breakfast-included then looks relatively smaller, making half-board an easier choice for guests. At properties with limited kitchen capacity, this directly affects how many half-board plans they can sell.
The Room Rate Behind the Steps — Seasonal Shape of Estimated Settled ADR
If meal steps are set by amount, the seasonal swings in the underlying room rate also need to be checked. Comparing Hokkaido’s estimated settled ADR year over year for finalized months, August 2026 came in at ¥17,800 for city hotels (N=75, -11.3% YoY), ¥11,300 for business hotels (N=438, +2.5%) and ¥19,200 for resort hotels (N=147, -6.9%). In July 2026 the figures were -5.7% for city hotels, +4.1% for business hotels and -4.0% for resort hotels, so the direction of YoY change split by segment. For city hotels, July marked the fourth consecutive month below the prior year, while business hotels stayed above it.
Source: Compiled by the HotelBank Editorial Team from MetroEngines Research (Hokkaido, resort hotels. Solid line = finalized values; dotted line = estimates based on current sales. N=117–147)
Upcoming months are estimates based on current sales and may change as sales progress. For resort hotels, the estimate is ¥18,000 for December 2026 (N=128), ¥20,700 for January 2027 (N=120) and ¥21,200 for February 2027 (N=117), rising toward winter. Comparisons with the prior year’s finalized values must wait until each month is finalized. City hotels are also estimated at ¥21,900 for February 2027 (N=64), showing a winter peak in rates.
| Estimated settled ADR (Hokkaido) | City | Business | Resort |
|---|---|---|---|
| August 2025 (finalized) | ¥20,078 (N=74) | ¥11,048 (N=417) | ¥20,667 (N=141) |
| August 2026 (finalized) | ¥17,801 (N=75) | ¥11,328 (N=438) | ¥19,240 (N=147) |
| October 2026 (current estimate) | ¥14,601 (N=75) | ¥12,060 (N=399) | ¥15,805 (N=145) |
| December 2026 (current estimate) | ¥14,822 (N=72) | ¥11,210 (N=371) | ¥18,048 (N=128) |
| February 2027 (current estimate) | ¥21,916 (N=64) | ¥14,072 (N=312) | ¥21,228 (N=117) |
Source: Compiled by the HotelBank Editorial Team from MetroEngines Research (current-estimate months may change with sales; simple comparison with the prior year’s finalized values should wait until month-end finalization)
If the dinner step is held flat in yen while room rates rise in winter, the step will again look smaller in percentage terms, just as in summer. How many half-board plans winter resort and city hotels sell will be determined by both the add-on amount and the number of covers the kitchen can serve.
For Revenue Managers at City, Business and Resort Hotels in Hokkaido — Implications and Action Plan
1. Benchmark your meal steps against the market in yen, not percentages. In the market, the dinner step stayed nearly constant in yen from May to September (about ¥10,000–¥11,000 at city and resort hotels, about ¥4,600–¥5,200 at business hotels). If your meal-inclusive plans are linked to the room rate by a fixed percentage, your dinner add-on will tend to exceed the market in peak months and fall below it in slow months. Start by listing your own monthly add-on amounts and comparing them with the market range.
2. Keep breakfast within your segment’s going rate and differentiate on dinner. The breakfast step fell within about ¥2,000–¥5,300 regardless of segment. If your breakfast-included premium is far from your segment’s going rate (business +10.0%, resort +7.8%, city +18.0%), check reviews and other feedback to see whether guests feel the breakfast justifies the price. The larger room for incremental revenue lies on the dinner side, where the step exceeds ¥10,000.
3. Limit the number of plans to a structure where the steps are clearly visible. Among city hotels, N=26 properties sell both half-board and breakfast-included, while N=50 sell both breakfast-included and room-only — fewer properties sell half-board. With the three tiers of room-only, breakfast-included and half-board in place, the price ladder comes across clearly without stacking meal variants for every room type. Properties whose plan count has grown to the point of making rate changes burdensome should consider reorganizing into a structure where the steps are easy to see.
4. Prioritize half-board allocation on peak dates. Dinner carries food costs, but it also brings in-house ancillary revenue such as drinks. On peak dates in winter, when room rates rise (resort hotels estimated at ¥21,200 for February 2027, N=117), shifting allocation toward half-board within kitchen capacity makes it easier to build total revenue per room.
| Timing | Action | Trigger (figures from this article) | Objective |
|---|---|---|---|
| This week | Write down your breakfast step and dinner step in yen for October | Whether they fall outside the market steps by segment (breakfast ¥1,986–¥5,273, dinner ¥4,631–¥10,991) | Understand where your hotel sits within the market range |
| This week | Compare your breakfast-included premium with your segment’s going rate | Whether your premium is far from the segment rate (city +18.0%, business +10.0%, resort +7.8%) | Check how competitive your breakfast-included plan is |
| Within 2 weeks | Review settings that link meal-inclusive plans to the room rate by percentage, and consider a fixed-amount approach | The market dinner step stayed nearly constant in yen from May to September while only the percentage moved (city 26.9%–32.0%) | Prevent meal-inclusive plan prices from rising too far in peak months |
| Within 2 weeks | Consolidate overlapping meal variants per room type into a three-tier structure | Fewer properties sell half-board than breakfast-included (city N=26 vs N=50) | Reduce the effort of rate changes and make the steps easier to understand |
| Before releasing winter plans | Set the half-board allocation for December–February peak dates by working back from kitchen capacity | Resort estimated settled ADR rises toward winter: ¥20,666 in January 2027 and ¥21,228 in February (current estimates) | Build total revenue per room, including ancillary revenue |
| Before releasing winter plans | Reset the winter dinner add-on amount in light of the food-cost outlook | The dinner step exceeds ¥10,000 at city and resort hotels (¥10,991 and ¥10,751) | Reflect food-cost changes in price on a fixed-amount basis |
Summary — Three Yardsticks for Measuring Meal Steps
Comparing Hokkaido’s meal premiums within the same property, the way price steps are set can be checked against the following three points.
| Yardstick | Hokkaido market (September 2026) | What to check at your hotel |
|---|---|---|
| Breakfast step (yen) | About ¥2,000–¥5,300; the spread across segments is only about ¥3,300 | Is it within your segment’s going rate? |
| Dinner step (yen) | About ¥11,000 at city and resort hotels, about ¥4,600 at business hotels; the spread widens to about ¥6,400 | Does the step fit your use case (do guests expect to dine in-house)? |
| Set by amount or by percentage | From May to September, market steps held nearly constant in yen while only the percentage moved | Are meal-inclusive plan prices rising too far in peak months? |
Differences between segments reflect not better or worse pricing but different use cases — what guests eat at the hotel. Before building winter plans, it is worth checking these three points against your own numbers.
About the Data
| Meal premium | Limited to properties that sell both of two meal types at the same hotel (room-only and breakfast-included, breakfast-included and half-board, etc.); the price difference within each property (per room for two guests) was aggregated. N = number of paired properties. Only comparisons with N of 5 or more are cited. Ryokan are excluded. Stays from May to September 2026. |
| Estimated settled ADR | The level of transacted prices (tax-exclusive equivalent) estimated from OTA and other sales data (lowest-plan level × segment-specific factor, ensemble across multiple channels). Past months are finalized values; current and future months are estimates based on current sales. Against published operating results, the median error is 6.6%. |
| Estimated OCC / booking curves | Not used in this article. |
| Breakdown of N | Meal premium (September 2026): breakfast-included vs room-only — city N=50, business N=194, resort N=50, all N=351 / half-board vs breakfast-included — city N=26, business N=42, resort N=44, all N=163 / half-board vs room-only — city N=27, business N=41, resort N=44, all N=162. Estimated settled ADR (Hokkaido): city N=64–75, business N=312–438, resort N=117–147 (varies by month). |
| Data as of | Data as of September 23, 2026. Because sales and inventory change daily, the figures in this article are a snapshot at the time of retrieval. |
Source: Compiled by the HotelBank Editorial Team from MetroEngines Research