

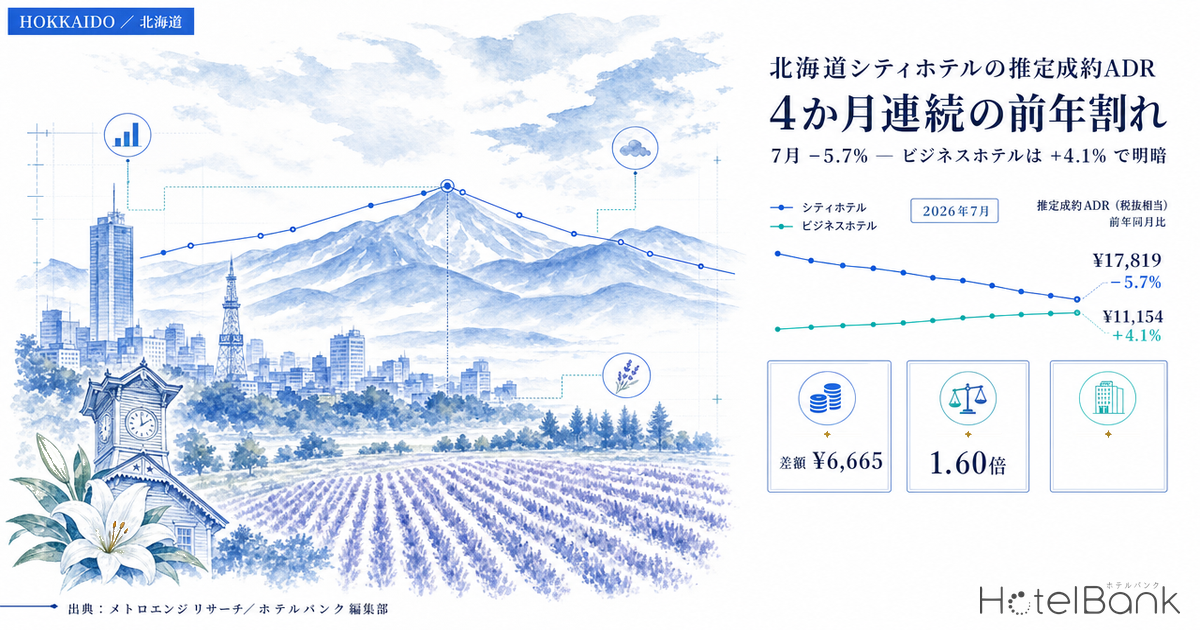
The estimated settled ADR of city hotels in Hokkaido fell below the prior year for four consecutive months, from April through July 2026. July 2026 came in at ¥17,819 (N=75 properties), or -5.7% against ¥18,891 (N=74 properties) in the same month a year earlier. In 2025, every month except April had been positive year on year, averaging +17.2% — a category in a steep upswing that has now flipped sign within a single year. Business hotels in the same prefecture, meanwhile, recorded ¥11,154 (N=432 properties) in July 2026, up +4.1% YoY. Growth has slowed, but the figure remains in positive territory. Within the same area and the same period, price direction diverges by property type. The pattern in which city hotels alone turn negative first is not unique to Hokkaido: Nagano showed a comparable reversal in June 2026. This article uses only year-on-year pairs of finalized figures to lay out when the divergence began and how wide it has become.
Scope: city hotels in Hokkaido N=75 properties / business hotels N=432 properties (as of July 2026). The price metric in this article is estimated settled ADR (the transacted price level inferred from OTA and other sales data, tax-exclusive equivalent); occupancy is an estimate based on OTA-listed inventory. Full definitions appear at the end of the article. Data as of September 5, 2026.
- — The estimated settled ADR of Hokkaido city hotels turned negative YoY in April 2026 and reached -5.7% in July (¥17,819, N=75 properties). The decline has widened for four straight months.
- — Business hotels in the same prefecture were +4.1% in July (¥11,154, N=432 properties). Growth has decelerated from +14.4% at the start of the year, but every month of 2026 has stayed positive.
- — The price gap between the two types narrowed from ¥8,179 to ¥6,665 as of July (a ratio of 1.76x down to 1.60x). The upper tier fell while the lower tier rose, compressing the price band.
- — Estimated OCC ran in the 90% range for both types in July and August 2026. Inventory is being absorbed, so the YoY decline likely reflects pricing-side factors as much as demand volume.
- — YoY figures are calculated only from pairs of finalized values. Current-point estimates for August 2026 onward are used neither for level comparison nor for YoY.
City hotels: YoY flips negative from April 2026
As a premise, every year-on-year comparison in this article is built only from pairs of finalized values (past months). Months from August 2026 onward are estimates based on current sales conditions; because their basis differs from finalized values, they are used neither for level comparison nor for YoY. The most recent comparable month is therefore July 2026.
Viewing the estimated settled ADR of Hokkaido city hotels (N=75 properties) as overlaid years, almost every month shifted upward over the year from 2024 to 2025. YoY change in 2025 averaged +17.2% across twelve months, reaching +25.4% in October and +24.6% in December — prices rose broadly, including months outside the peak. In that phase, the lift came not only from busy months but from a higher floor in shoulder months, which drove the annual increase.
Entering 2026, that momentum weakens month by month. January was strong at ¥14,658, or +29.4%, but February narrowed to +4.4% and March to +8.4%, both single digits. April then turned negative at -0.9%, followed by -1.4% in May, -3.6% in June and -5.7% in July — the negative gap widening with each passing month. July stands out in particular: it is one of the highest-level months of the year for Hokkaido city hotels, yet it recorded the largest YoY decline of 2026. The level itself, ¥17,819, still exceeds the ¥17,149 of July 2024, so the accurate reading is not “a return to 2024 levels” but “a partial unwinding of the premium accumulated during 2025.”
Source: Compiled by the HotelBank Editorial Team from MetroEngines Research
In the year-overlay chart, the 2026 line runs above the 2025 line from January through March, then slips beneath it from April onward. The seasonal shape itself — early spring as the annual trough, midsummer and February as peaks — is largely unchanged across all three years, so what has shifted is height, not form. The revenue-management implication is that the issue is not rebuilding the seasonal calendar, but revisiting the size of the premium applied in each month.
Business hotels: still positive, but growth has narrowed since January
Business hotels in Hokkaido (N=432 properties) have stayed positive year on year in every month of 2026. Growth has clearly narrowed, however: +14.4% in January, +8.1% in February, +8.2% in March, +0.3% in April, +4.9% in May, +2.7% in June and +4.1% in July — down from double digits at the start of the year to the low single digits. The four-month average from April to July is +3.0%, roughly six points above the -2.9% four-month average for city hotels over the same window.
What is notable is how business hotels moved in 2025: they began the year in negative territory (-0.5% in January, -0.1% in February, -1.6% in March) and widened their gains from mid-year onward. In other words, business hotels entered their upswing about a year later than city hotels, and that upswing is still running. The two categories sit in the same market but are out of phase in their price cycles.
Source: Compiled by the HotelBank Editorial Team from MetroEngines Research
That phase gap has narrowed the price difference between the two categories. In July 2025, city hotels at ¥18,891 against business hotels at ¥10,712 gave a gap of ¥8,179 and a ratio of 1.76x. In July 2026, city hotels at ¥17,819 against business hotels at ¥11,154 give a gap of ¥6,665 (about ¥1,500 narrower than a year earlier) and a ratio down to 1.60x. With the upper tier falling and the lower tier rising, Hokkaido’s accommodation price band is more compressed than it was last year.
| Stay month | City: estimated settled ADR | YoY | Business: estimated settled ADR | YoY | Gap |
|---|---|---|---|---|---|
| January 2026 | ¥14,658 | +29.4% | ¥8,074 | +14.4% | ¥6,584 |
| February 2026 | ¥18,171 | +4.4% | ¥8,769 | +8.1% | ¥9,402 |
| March 2026 | ¥11,858 | +8.4% | ¥7,593 | +8.2% | ¥4,265 |
| April 2026 | ¥9,728 | -0.9% | ¥7,142 | +0.3% | ¥2,586 |
| May 2026 | ¥13,551 | -1.4% | ¥8,857 | +4.9% | ¥4,694 |
| June 2026 | ¥14,796 | -3.6% | ¥9,545 | +2.7% | ¥5,251 |
| July 2026 | ¥17,819 | -5.7% | ¥11,154 | +4.1% | ¥6,665 |
City hotels N=75 properties; business hotels N=429–441 properties (varies by month). All figures finalized.
Source: Compiled by the HotelBank Editorial Team from MetroEngines Research
Source: Compiled by the HotelBank Editorial Team from MetroEngines Research
Demand is not softening — estimated OCC holds in the 90% range
A YoY price decline is easy to read as “demand fell,” but seen from the inventory-absorption side, Hokkaido’s summer 2026 is not slack. Monthly averages of estimated OCC (based on OTA-listed inventory) for city hotels were 80.9% in April, 86.0% in May, 90.8% in June, 93.6% in July and 93.4% in August. Business hotels traced nearly the same shape into summer: 81.7% in April, 86.2% in May, 91.0% in June, 94.2% in July and 92.6% in August. Both July and August sit in the 90% range, indicating that listed inventory has been substantially absorbed.
| Stay month (2026) | Estimated OCC: city | Estimated OCC: business |
|---|---|---|
| April | 80.9% | 81.7% |
| May | 86.0% | 86.2% |
| June | 90.8% | 91.0% |
| July | 93.6% | 94.2% |
| August | 93.4% | 92.6% |
Estimated OCC (based on OTA-listed inventory). Daily values for Hokkaido by category, averaged by month.
Source: Compiled by the HotelBank Editorial Team from MetroEngines Research
One caveat: estimated OCC is an estimate based on how inventory listed on OTAs is absorbed, and its definition differs from actual room occupancy (it reads higher). YoY comparison from the same source is also outside the scope of this article. Even so, the fact that city and business hotels show almost no difference in the shape of inventory absorption while only their YoY price change moves in opposite directions suggests that the decline on the city hotel side involves pricing-side factors rather than purely a matter of demand volume. The reading is that the premium accumulated over a short span in 2025 was not sustained market-wide in 2026.
For reference, monthly REIT disclosures are shown below as published operating results. All are national portfolio figures — not Hokkaido alone, and defined differently from the estimated settled ADR used here — so they cannot be compared directly. They are presented as a reference point for where nationwide measured results stand.
| Disclosing entity (July 2026 results) | Scope | Occupancy | ADR | RevPAR |
|---|---|---|---|---|
| Japan Hotel REIT Investment Corporation (ジャパン・ホテル・リート投資法人) | 29 hotels with variable rent and similar schemes | 83.1% | ¥21,806 | ¥18,119 |
| Invincible Investment Corporation (インヴィンシブル投資法人) | 101 domestic hotel properties | 86.3% | ¥15,100 | ¥13,039 |
| Ichigo Hotel REIT Investment Corporation (いちごホテルリート投資法人) | Entire portfolio | 84.4% | ¥9,684 | ¥8,175 |
From each investment corporation’s monthly operating disclosure. Source URLs are listed at the end of the article.
For revenue managers running city and business hotels in Hokkaido — implications and an action plan
(a) Operational insights
1. The YoY decline is market-wide — separate it from property-specific underperformance. For city hotels, the market moved -0.9% / -1.4% / -3.6% / -5.7% from April to July 2026. If your own YoY for that window falls inside this range, you are simply moving with the market, and that is not grounds for concluding that a specific sales tactic failed. Only if you are below the market does it make sense to start suspecting property-level causes. When digging into those causes, checking your position on review distribution alongside price — not price alone — makes the issue easier to narrow (review distribution and price position in central Sapporo).
2. The widening of the decline month by month is what matters. -0.9% in April and -5.7% in July mean different things. Rather than the absolute YoY value, line up the trend in YoY by month and check whether your property shows the same slope. A slope steeper than the market points to missed capture in the high-rate zone during peak periods.
3. The price gap between the two types is narrowing. In July the gap fell from ¥8,179 a year earlier to ¥6,665, and the ratio from 1.76x to 1.60x. City hotels now look relatively less expensive against the tier below than they did last year, while business hotels have closed distance with the tier above. From either side, it is worth reviewing the definition of your competitive set — checking whether a property type that was not previously a comparison point has become one.
4. Inventory is being absorbed. Estimated OCC for July and August sits in the 90% range for both categories. Defensive pricing premised on thinning demand is a choice worth making only after confirming that premise in this market environment. Because the seasonal shape — early spring as trough, midsummer and February as peaks — has not changed much in three years, there is no need to rebuild the framework of the pricing calendar; the question is how the premium applied to each month is designed. Note that Hokkaido business hotels, viewed by day of week, are thick from Tuesday to Thursday with a trough on Sunday and Monday, so premiums are best designed separately by day of week (day-of-week estimated OCC in Hokkaido).
| Time horizon | Action | Decision trigger | Purpose |
|---|---|---|---|
| Today to this week | Line up your own finalized ADR for April–July 2026 on a YoY basis and overlay the market’s -0.9% / -1.4% / -3.6% / -5.7% | If any month shows a decline larger than the market’s, make that month the priority for analysis | Separate market factors from property factors |
| Today to this week | Check where your July ADR sits against the market level (city ¥17,819 / business ¥11,154) | If inventory absorption is in line with the market (the 90%-range estimated OCC seen in July–August 2026) yet your rate is well below the market | Establish whether there is headroom on rate |
| Within two weeks | Review the competitive set. Extend one tier up and one tier down and re-check the price band | Given that the gap between property types narrowed from ¥8,179 to ¥6,665, whether the existing competitive set still matches market reality | Respond to price-band compression |
| Within two weeks | Take a monthly inventory of the sales mix of high-rate plans and upper room categories in the peak months (July–August) | If your own YoY decline slopes more steeply than the market’s (roughly 4.8 points of deterioration from April to July) | Recover missed capture at the height of the peak |
| Looking to next month | Keep the seasonal shape of the pricing calendar intact and redesign only the month-by-month premium | On the premise that the shape — early spring trough, midsummer and February peaks — has not changed much in three years | Confine adjustment to level rather than structure |
| Looking to next month | Write down an internal rule that YoY judgments are made between finalized months only | Whether material circulating internally places preliminary figures for unclosed months next to finalized prior-year values | Prevent misreading caused by mixed bases |
Source: Compiled by the HotelBank Editorial Team from MetroEngines Research
Summary — three yardsticks
Yardstick 1: read the slope, not the sign. Hokkaido city hotels turned negative year on year in April 2026, and by July the decline had widened to -5.7%. For forming a view on the following month, the slope — roughly 4.8 points of deterioration over four months — is more useful than the sign of any single month. In a category where the month-to-month swing is itself large, the working premise is not to move pricing on one month’s sign (the swing seen across 18 finalized months in Aichi).
Yardstick 2: measure the distance between property types every month. The July city–business gap narrowed from ¥8,179 in 2025 to ¥6,665 in 2026. That distance is a simple indicator for judging whether a competitive set is still valid, and when it is narrowing, existing competitive assumptions drift from market reality more easily.
Yardstick 3: always place price and inventory absorption side by side. Estimated OCC in July–August 2026 was in the 90% range for both categories, so inventory is being absorbed. Making a habit of putting the YoY price decline and the state of inventory absorption in the same table makes it easier to avoid the shortcut of “demand is weak, so cut price.”
Note that this article deals only with pairs of finalized values; months from August 2026 onward are estimates based on current sales conditions and are therefore excluded from YoY comparison. Assessing August and beyond is best done within the same framework once each month is finalized.
Frequently asked questions
Q. Since when has the estimated settled ADR of Hokkaido city hotels been below the prior year?
A. Since April 2026. YoY change was -0.9% in April, -1.4% in May, -3.6% in June and -5.7% in July — four consecutive negative months, with the decline widening each month. The level in July 2026 was ¥17,819 (N=75 properties), below the ¥18,891 (N=74 properties) of the same month a year earlier. It still exceeds the ¥17,149 of July 2024, however, so this is not a return to 2024 levels but a partial unwinding of the premium accumulated during 2025.
Q. Business hotels in the same prefecture are still positive. What is different?
A. Their price cycles are out of phase. Business hotels began 2025 in negative territory (-0.5% in January, -0.1% in February, -1.6% in March) and widened their gains from mid-year. They entered their upswing about a year later than city hotels, and that upswing is still running. July 2026 was ¥11,154 (N=432 properties), up +4.1% YoY, though growth has narrowed from +14.4% at the start of the year.
Q. What is estimated settled ADR? Is it different from OTA listed prices?
A. Yes, it is different. Estimated settled ADR is the transacted price level (tax-exclusive equivalent) inferred from OTA and other sales data (lowest-plan level x a category-specific coefficient, as an ensemble across multiple channels). It is not the listed price itself. Past months are finalized values; current and future months are estimates based on current sales conditions. The median error against published operating results is 6.6%.
Q. Is estimated OCC the same as actual room occupancy?
A. No. Estimated OCC (occupancy based on OTA-listed inventory) is calculated as “100 − 100 x rooms remaining on OTAs ÷ total rooms” and is an estimate based on how inventory sold on OTAs is absorbed. Its definition differs from actual room occupancy and it generally reads higher. In Hokkaido, July 2026 was 93.6% for city hotels and 94.2% for business hotels; August was 93.4% and 92.6% respectively.
Q. Why are months from August 2026 onward excluded from the YoY comparison?
A. Because it would mix bases. Past months are finalized values, but August 2026 onward are estimates based on current sales conditions, calculated on a different basis. Placing months with different bases side by side produces a structural upward bias, so this article builds YoY only from pairs of finalized values, making July 2026 the most recent comparable month.
Q. How has the price gap between city and business hotels changed?
A. It has narrowed. Comparing July: in 2025, city hotels at ¥18,891 against business hotels at ¥10,712 gave a gap of ¥8,179 and a ratio of 1.76x; in 2026, city hotels at ¥17,819 against business hotels at ¥11,154 give a gap of ¥6,665 and a ratio of 1.60x. With the upper tier falling and the lower tier rising, the price band is more compressed than a year earlier — a reason to review how the competitive set is defined.
About the data
■ Data sources
- Estimated settled ADR = the transacted price level (tax-exclusive equivalent) inferred from OTA and other sales data (lowest-plan level x a category-specific coefficient, as an ensemble across multiple channels). Past months are finalized values; current and future months are estimates based on current sales conditions. Median error of 6.6% against published operating results.
- Estimated OCC (occupancy based on OTA-listed inventory) = 100 − 100 x rooms remaining on OTAs ÷ total rooms. An estimate based on how inventory sold on OTAs is absorbed. The scope of this article is stay months from April to August 2026 in Hokkaido.
- Published REIT results are quoted as disclosed in each investment corporation’s monthly operating status, covering national portfolios.
■ Calculation assumptions
- All YoY figures in this article are calculated only from pairs of finalized values; months carrying current-point estimates (August 2026 onward) are used neither for level comparison nor for YoY.
- Booking curve and estimated OCC observations are based on data from 90 days before the stay date up to the present. Monthly estimated OCC is the monthly average of the observed value for each stay date.
- Target N = Hokkaido city hotels: N=75 properties in each month of 2026, N=74–76 properties in each month of 2025. Hokkaido business hotels: N=429–441 properties in each month of 2026 (N=432 in July), N=421–426 properties in each month of 2025. The number of properties aggregated for estimated OCC varies by day.
■ Limitations and caveats
- Estimated OCC is defined differently from actual room occupancy (it reads higher). YoY comparison from the same source is also outside the scope of this article.
- Published REIT results differ from the estimated settled ADR and estimated OCC used here in aggregation scope, tax treatment and calculation method, so they cannot be compared directly.
- Data as of September 5, 2026. Sales conditions and inventory change daily, so the figures in this article are a snapshot at the time of retrieval.
References and sources
- Japan Hotel REIT Investment Corporation (ジャパン・ホテル・リート投資法人), “Monthly Operating Status” (July 2026 results) Disclosure material
- Invincible Investment Corporation (インヴィンシブル投資法人), “Monthly Operating Status” (July 2026 results) Disclosure material
- Ichigo Hotel REIT Investment Corporation (いちごホテルリート投資法人), “Monthly Operating Status” (July 2026 results) Disclosure material