

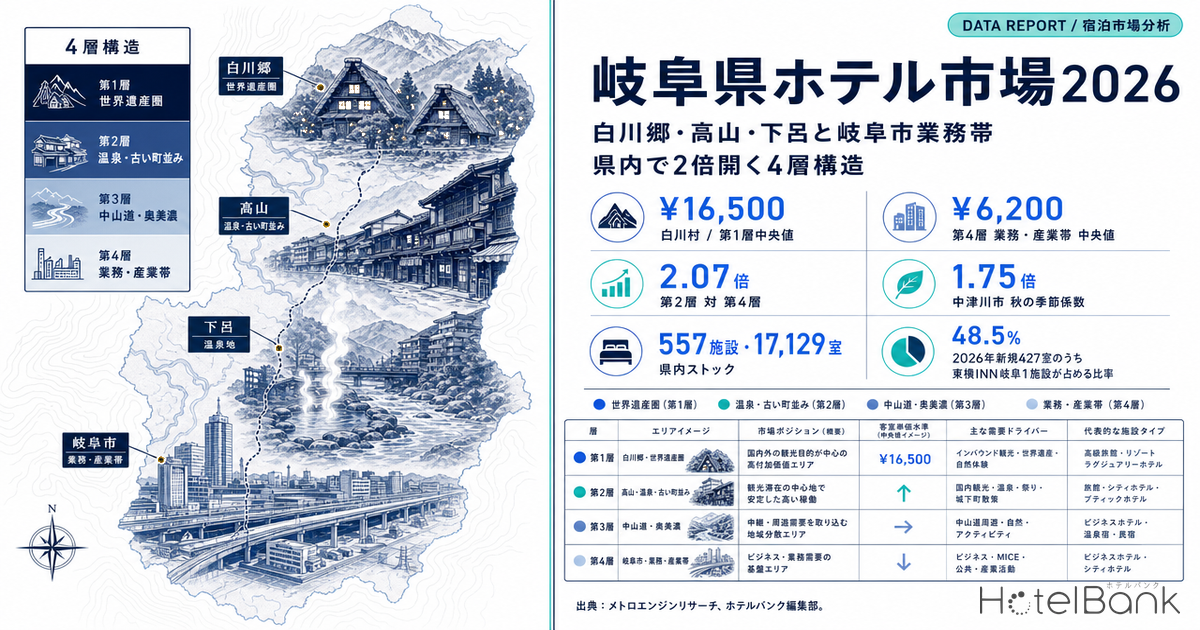
Gifu Prefecture’s accommodation market is too internally varied to be described as a single market. On one side sit the tourism belts — Shirakawa Village, home to the Shirakawa-go World Heritage site; Takayama, the old castle town of Hida; and the hot-spring resort of Gero. On the other side stretch the business corridors of Gifu City (the prefectural capital), Ogaki and Kakamigahara, underpinned by manufacturing and public-sector demand. Placed side by side in MetroEngines Research data, the two sides show a roughly twofold gap in estimated settled ADR — inside one and the same prefecture.
Metric Definitions Used in This Article
- ADR (estimated settled ADR): An estimated transacted room rate (tax-exclusive equivalent) calculated by applying category-specific adjustment coefficients to the lowest published plan level each property lists on OTAs and similar channels (double occupancy, per-room rate, tax-inclusive). Cross-checked against property-level actuals disclosed by a listed hotel REIT (Invincible Investment Corporation) — 184 property-months, April–May 2026 — the median error is approximately 7.5%. These are estimates and differ from each property’s actual transacted prices and accounting figures. Municipality-level ADR is the median across the covered properties (the level of a typical property in that area).
- Listed price: The average price across all plans published on OTAs and similar channels (double occupancy, per-room rate, tax-inclusive, spanning room-only through meal-inclusive plans). Because the basis differs from estimated settled ADR, this article labels the two explicitly and separately.
- Data source: MetroEngines Research. Approximately 168,000 properties nationwide are tracked, of which roughly 27,000 properties and about 1.26 million rooms with confirmed OTA activity form the analysis universe.
- — About 2.07x — Estimated settled ADR separates into four tiers. Tier 2 (hot springs and historic townscapes) sits at ¥12,900 against Tier 4 (business and industrial belt) at ¥6,200. Include Shirakawa Village at ¥16,500 and the gap widens to 2.65x.
- — 7,309 rooms vs 7,098 rooms — Room stock in the tourism belt and the business belt is almost evenly matched. Per property, however, the business belt averages 63 rooms against 26 in the tourism belt — a 2.4x difference in scale.
- — 1.75x and 1.01x — Autumn-foliage (October–November) seasonal coefficients split cleanly by tier: Nakatsugawa 1.75x and Takayama 1.30x, against Ogaki 1.09x and Kakamigahara 1.01x.
- — Shirakawa Village peaks in winter — Its seasonal coefficient is 0.89x, making autumn a trough. Estimated settled ADR in February 2026 reached ¥26,800, the highest of the year, up roughly 47% year on year.
- — 207 of 427 rooms — 48.5% of new rooms added in 2026 came from Toyoko Inn Gifu in Gifu City. The confirmed pipeline through 2028 consists of a single 120-room project in Minokamo.
Gifu’s Accommodation Market Splits into Four Tiers
Start with the outline of the prefecture as a whole. Within the scope tracked by MetroEngines Research, Gifu contains 557 operating properties with registered room counts, totalling 17,129 rooms (the sum across the 22 municipalities that host three or more properties). That stock is not spread evenly. Sorted by municipal estimated settled ADR (June 2026, confirmed basis), the price levels separate cleanly into four tiers.
Source: MetroEngines Research; compiled by the HotelBank Editorial Team
At the top stands Shirakawa Village at ¥16,500. This World Heritage area of gassho-zukuri farmhouses is the one village that forms its own price band. Next comes the hot-spring and historic-townscape tier: Takayama at ¥14,000, Gero at ¥12,900 and Mino at ¥10,900. The third group is the Nakasendo and Oku-Mino leisure belt, running from Gujo at ¥8,900 down to Ena at ¥6,400. At the bottom sits the business and industrial belt, led by Gifu City at ¥8,300.
Taking tier medians makes the structure explicit. Tier 2 (hot springs and historic townscapes) at ¥12,900 compares with Tier 4 (business and industrial belt) at ¥6,200 — a ratio of roughly 2.07x. Include Tier 1’s Shirakawa Village and the spread widens to 2.65x. In travel terms, a twofold rate difference coexists within a two- to three-hour one-way drive. Gaps of this width inside a single prefecture are not unique to Gifu; Japan Intra-Prefecture ADR Gaps Reach 5.2x: 368 Municipalities Ranked places this distribution in a nationwide context.
| Tier | Main municipalities | Median estimated settled ADR | Properties | Rooms | Average size |
|---|---|---|---|---|---|
| Tier 1 World Heritage zone | Shirakawa Village | ¥16,500 | 14 | 100 | 7 rooms |
| Tier 2 Hot springs and historic townscapes | Takayama, Gero, Mino | ¥12,900 | 286 | 7,309 | 26 rooms |
| Tier 3 Nakasendo and Oku-Mino | Gujo, Seki, Nakatsugawa, Hida, Ena | ¥7,500 | 127 | 2,467 | 19 rooms |
| Tier 4 Business and industrial belt | Gifu City, Ogaki, Kakamigahara, Tajimi, Toki, Kani, Mizunami, Minokamo, Hashima | ¥6,200 | 113 | 7,098 | 63 rooms |
Estimated settled ADR is on a June 2026 confirmed basis (displayed rounded to the nearest ¥100). Property and room counts cover operating properties with registered room counts. Areas with few covered properties, such as Yoro (n=5) and Ibigawa (n=4), are excluded from the tier definitions and treated as reference only. Source: MetroEngines Research; compiled by the HotelBank Editorial Team
What deserves attention here is the distribution of room stock. Tier 4, the business and industrial belt, holds 7,098 rooms across 113 properties — nearly level with Tier 2’s 7,309 rooms across 286 properties. In other words, Gifu’s room inventory is split roughly in half between the tourism belt and the business belt. Average size per property, however, differs by a factor of 2.4: 63 rooms in the business belt against 26 in the tourism belt. A small number of large properties absorb business demand while a large number of small properties absorb tourism demand — that is the basic shape of Gifu’s accommodation supply.
And on rate, the tourism belt runs at twice the business belt. Comparable stock volume paired with a twofold rate gap indicates that headroom remains in the business belt’s price band. As set out below, that headroom is visible from the seasonality angle as well.
What Happens in the Autumn Foliage Season (October–November) — Seasonal Curves Split by Tier
Viewed across the prefecture, Gifu’s annual cycle has two peaks: August and October–November. In 2025, estimated settled ADR bottomed at ¥10,000 in June before rising to ¥12,900 in August, ¥12,300 in October and ¥12,500 in November. 2026 is tracing the same shape: confirmed figures through July are broadly flat year on year (June −3.5%, July −4.7%), while from August onward the published levels as of the survey date imply estimates in the ¥13,000–15,000 range.
Figures from August 2026 onward are estimates based on published levels as of the survey date (August 2026). Covered properties N=302–396 per month. Source: MetroEngines Research; compiled by the HotelBank Editorial Team
This prefecture-average curve, however, is a composite across tiers. Broken down by tier, the autumn effect looks entirely different. The analysis below uses 2025 confirmed figures, which carry no shift in basis, and computes a seasonal coefficient by municipality as “the October–November average divided by June.”
Based on 2025 confirmed estimated settled ADR. Kakamigahara, Seki, Toki and Mino are excluded from this chart because their covered property counts fall sharply during the period. Source: MetroEngines Research; compiled by the HotelBank Editorial Team
Within the tourism belt, Nakatsugawa moved the most at 1.75x — a market where autumn-foliage demand along the Nakasendo, including the post town of Magome, feeds straight through to rate. Takayama follows at 1.30x and Gero at 1.29x, then Hida at 1.23x, Ena at 1.18x and Gujo at 1.10x, with the coefficient flattening the further inland the market sits.
The business and industrial belt, by contrast, clusters in the low 1.0x range. Ogaki is at 1.09x, Tajimi at 1.03x and Kakamigahara at 1.01x — autumn demand is barely reaching rate. These are markets run on a base of steady, year-round business demand, which is in itself a durable revenue structure. Read the other way, it means that during the one season when the whole prefecture moves, the room to add rate remains untouched.
That the headroom can actually be captured is shown by Gifu City and Hashima, both within the same business belt. Gifu City’s seasonal coefficient is 1.28x, essentially level with Takayama, and Hashima exceeds it at 1.34x. Gifu City hosts a concentration of autumn events led by the Gifu Nobunaga Festival, while Hashima is a wide-area access hub served by Gifu-Hashima Station on the Tokaido Shinkansen. Even in the business belt, locations able to capture demand that moves in autumn are already posting seasonal coefficients on par with the tourism belt. The Gifu Air Base Air Show 2026 has been announced for 22 November 2026 at the JASDF Gifu Air Base in Kakamigahara, pointing toward a further thickening of autumn demand in the business belt.
Shirakawa-go Peaks in Winter, Not Autumn
Broken out by tier, another pattern emerges that runs against the conventional view. Tier 1’s Shirakawa Village has a seasonal coefficient of 0.89x: its October–November estimated settled ADR sat below June.
Tracking Shirakawa Village’s annual curve from November 2024, the peak falls in winter — ¥21,900 in December 2025, ¥19,900 in January 2026, and ¥26,800 in February 2026, a level that stands well clear of the rest of the year. The structure reflects demand concentrating on the illumination of the gassho-zukuri village. The February 2026 level is up roughly 47% against the same month a year earlier (¥18,300 in February 2025), so winter drawing power has strengthened further from the prior year. On a listed-price basis, January 2026 also marked the annual high at ¥58,500.
Shirakawa Village is an extremely small market: 14 properties, 100 rooms, an average of seven rooms each (note that monthly figures are volatile, as only five to eight properties are covered in any given month). That an estimated settled rate in the ¥26,000 range holds in winter at this scale is itself evidence of the strength of the World Heritage asset. This is an area where snowscape, not foliage, sets the price, and it is better understood as running on a different calendar from Takayama and Gero.
For October–November 2026, the estimates stand at ¥24,300–25,800 for Shirakawa Village, ¥21,000–22,900 for Takayama and ¥20,300–20,900 for Gero. These are estimates based on published levels as of the survey date, and every tier shows coefficients above its 2025 actuals. Because the upward shift is uniform across tiers, it is best read as reflecting forward-listing levels rather than realised demand. Actual settled levels move as the check-in date approaches.
Inside Takayama’s 295 Properties — Fragmented Supply versus a Concentrated Few
The quickest way to understand the character of each tier is to look at supply composition. Takayama reaches 295 properties in MetroEngines Research’s price coverage, making it the prefecture’s largest accommodation market. Of these, 216 operating properties with registered room counts hold 5,233 rooms, an average of 24 rooms per property.
Operating properties with registered room counts only. Source: MetroEngines Research; compiled by the HotelBank Editorial Team
Broken down by size band, Takayama’s 6–20-room properties number 119, or 55.1% of the total, with a further 39 properties at five rooms or fewer. Together those 158 properties account for 73.1% of the count but only 1,424 rooms — just 27.2% of room stock. Conversely, the 11 properties with 101 rooms or more (5.1% of the total) hold 1,914 rooms, or 36.6% of the stock. Small inns dominate by count; large properties carry the volume.
The range of property categories is equally wide. Ordering the categories with observed prices in June 2026 by property count gives: ryokan 67, vacation rentals 31, business hotels 24, machiya townhouses 10, guesthouses 10, cottages 7, hostels 7, minshuku 7, pensions 6, campsites 5, resort hotels 4 and city hotels 3 (categories with fewer than three properties are not shown). Ryokan, machiya, hostels and vacation rentals coexist within the same city, and listed prices span more than threefold, from ¥66,900 for machiya down to ¥19,900 for business hotels. Takayama is not a single market but several markets overlapping in one geography.
| Municipality | Properties | Rooms | Average size | Estimated settled ADR | Composition |
|---|---|---|---|---|---|
| Takayama | 216 | 5,233 | 24 rooms | ¥14,000 | Fragmented; 12 categories coexist |
| Gero | 64 | 2,041 | 32 rooms | ¥12,900 | Mid-sized hot-spring ryokan dominate (39 ryokan) |
| Shirakawa Village | 14 | 100 | 7 rooms | ¥16,500 | A concentrated few; 7 ryokan, 3 minshuku |
| Gujo | 68 | 935 | 14 rooms | ¥8,900 | Small and scattered; 9 vacation rentals, 7 ryokan, 6 minshuku |
| Gifu City | 44 | 3,002 | 68 rooms | ¥8,300 | Large and concentrated; 13 properties of 101+ rooms hold 1,956 rooms |
Estimated settled ADR is on a June 2026 confirmed basis (rounded to the nearest ¥100). Category mixes cover categories with three or more properties showing observed prices in June 2026. Source: MetroEngines Research; compiled by the HotelBank Editorial Team
Shirakawa Village sits at the opposite pole: 14 properties and 100 rooms, with the largest property at 31 rooms and eight properties at five rooms or fewer. Gassho-zukuri minshuku are, in effect, the accommodation supply. Because supply is absolutely scarce, prices rise readily in peak periods. The prefecture-leading ¥16,500 rate is that scarcity showing through directly.
Gero falls between the two: 64 properties and 2,041 rooms, averaging 32 rooms, of which 39 properties are ryokan. This is a market of highly homogeneous hot-spring ryokan supply — 10 properties in the 51–100-room band hold 789 rooms, and two properties of 101 rooms or more hold 389. It lacks Takayama’s diversity of categories, but in scale it is the standard form of a core hot-spring destination.
Then there is Gifu City: 44 properties and 3,002 rooms, averaging 68 rooms, the largest average size in the prefecture. Thirteen properties of 101 rooms or more hold 1,956 rooms, or 65.2% of the total — a large, concentrated market. Against Takayama’s 5,233 rooms, Gifu City holds 3,002: one-fifth the property count, yet 57% of the rooms. It is a supply structure optimised to process business demand efficiently.
Supply Pipeline — Half of 2026’s New Rooms Landed in Gifu City
Turning to the supply side: within the scope where MetroEngines Research has confirmed OTA listings, new openings in Gifu totalled 33 properties and 736 rooms in 2025, and 16 properties and 427 rooms in 2026 through the survey date.
Based on confirmed OTA listings. Because listings typically appear several months before opening, counts for the most recent months onward may rise as further listings appear. Source: MetroEngines Research & Consulting (confirmed OTA listing basis)
Of 2026’s 427 rooms, 207 — 48.5% — come from a single property: Toyoko Inn Gifu, which opened on 31 July 2026 in Kanda-cho, Gifu City. A three-minute walk from Meitetsu Gifu Station, with 207 rooms and a maximum capacity of 374 guests, it is also a milestone property for Toyoko Inn, completing the chain’s presence in every prefectural capital. Its breakfast service leans into local character, featuring keichan, hoba miso and a curry made with lotus root, a specialty of Hashima. In short, the prefecture’s single largest supply addition landed in the Tier 4 business belt.
On the tourism side, Yutoria Resort Hida Takayama (104 rooms, resort hotel) began OTA listing in Takayama in April 2026. And on 14 September 2026, Hotel Associa Takayama Resort, set on the hills of Takayama, will be rebranded and open as Hilton Takayama Resort. Operated by JR Tokai Hotels, the property marks Hilton’s first flagship-brand entry into Gifu Prefecture. It will begin operating with roughly 90 rooms at opening, with a full opening across all 283 rooms planned for spring 2027. Located about eight minutes from JR Takayama Station by free shuttle bus, it is announced to include an onsen wing and an executive lounge.
Looking at the 2025 breakdown, vacation rentals led on property count at 13, followed by business hotels at six. 2026 shows a similar composition with six vacation rentals and three business hotels, so small-property entries dominate by count. In terms of contribution to room volume, however, the push came from business and lodging-focused properties above 100 rooms: Super Hotel Gifu Nakatsugawa Natural Hot Spring (142 rooms, December 2025), Hotel Amanek Hida Takayama (153 rooms, October 2025) and KOKO HOTEL Hida Takayama (139 rooms, September 2025).
| Opening | Property | Rooms | Category | Tier |
|---|---|---|---|---|
| July 2026 | Toyoko Inn Gifu (Gifu City) | 207 | Business hotel | Tier 4 |
| April 2026 | Yutoria Resort Hida Takayama (Takayama) | 104 | Resort hotel | Tier 2 |
| May 2026 | HOTEL R9 The Yard Motosu (Motosu) | 43 | Business hotel | Reference |
| December 2025 | Super Hotel Gifu Nakatsugawa Natural Hot Spring (Nakatsugawa) | 142 | Business hotel | Tier 3 |
| October 2025 | Hotel Amanek Hida Takayama (Takayama) | 153 | Business hotel | Tier 2 |
| September 2025 | KOKO HOTEL Hida Takayama (Takayama) | 139 | Business hotel | Tier 2 |
| June 2025 | TAOYA Gero (Gero) | 99 | Resort hotel | Tier 2 |
Source: MetroEngines Research & Consulting (confirmed OTA listing basis). Hilton Takayama Resort is not included in this table because it is a rebrand of an existing property.
One caveat on reading the data. New openings from 2027 onward currently stand at zero on a confirmed OTA listing basis, but that does not mean supply stops. Because pre-opening OTA listings begin several months ahead, counts for later years are structurally understated. Indeed, the figure of 16 properties in 2026 is likely to rise as second-half listings come through.
Seeing further out requires pairing this with construction-plan data. Accommodation projects in Gifu extracted from the Ministry of Land, Infrastructure, Transport and Tourism’s Building Construction Statistics Survey amount, as of the survey date, to a single project: 120 rooms in Yamate-cho, Minokamo (eight storeys, scheduled for completion in December 2028, developed by AB Hotel). (Compiled from the 81 projects with confirmed opening plans out of a national extraction cap of 200.) This too is on a building-confirmation basis, and since confirmation applications are typically filed one to two years before opening, project and room counts should rise as further applications are added. Treat it as a floor for the currently confirmed pipeline.
Pulling this together: the large supply additions of 2025–2026 landed in both the business belt (Toyoko Inn Gifu, 207 rooms) and the tourism belt (Yutoria Resort, 104 rooms; the 283-room Hilton Takayama Resort rebrand), so supply growth is not skewed to one tier. Meanwhile, the confirmed pipeline through 2028 consists solely of the single Minokamo project in the business belt — extremely limited in absolute volume. For the business belt, where the rate gap sits, supply-side pressure will stay light for the time being.
Gifu on the Map — Rate Runs North, Rooms Run South
Placing the four tiers on a map makes the prefecture’s structure visually clear. Circle size represents room count and colour represents tier.
Circle size = room count, colour = price tier. Coordinates are the median location of each municipality’s accommodation distribution. Source: MetroEngines Research; compiled by the HotelBank Editorial Team
Tiers 1 and 2 concentrate in the Hida region in the north, while Tier 4 spreads across the Nobi Plain in the south. There is a clear gradient: rate runs north, room count runs south. Geographically, travelling from the northern edge where Shirakawa Village, Takayama and Hida sit, down to the southern edge of Gifu City, Ogaki and Hashima, rate falls to roughly a third simply by crossing the prefecture.
That layout follows from the two sides serving different demand. The north draws wide-area and inbound demand pulled in by World Heritage and hot springs; the south serves business and industrial demand adjacent to the Nagoya metropolitan area. According to Gifu Prefecture’s announcement based on the Japan Tourism Agency’s Overnight Travel Statistics Survey (2024), foreign overnight guests in the prefecture reached 2,305,600 — 11th nationally and a record high, far above the 1,660,330 recorded in 2019. By country and region, Taiwan led with 182,800, followed by China at 151,770 and Hong Kong at 114,200, while European markets stand out for their high national rankings, with Spain 5th, Italy 6th and France 7th. The primary receiving capacity for this inbound demand is Tiers 1 and 2 in the north.
Conclusion — What the Four-Tier Structure Says About Gifu’s Headroom
This article has read Gifu’s accommodation market through four tiers. In summary:
First, estimated settled ADR within the prefecture spans 3.7x, from ¥16,500 in Shirakawa Village to ¥4,500 in Hashima, and at the level of tier medians the tourism belt (Tier 2) and the business belt (Tier 4) differ by roughly 2.07x. Yet room stock is nearly matched, at 7,309 rooms in Tier 2 against 7,098 in Tier 4. Structurally, about 40% of the prefecture’s room inventory sits in its lowest rate band.
Second, autumn-foliage seasonal coefficients split cleanly by tier. On 2025 actuals, the tourism belt posted Takayama 1.30x, Gero 1.29x and Nakatsugawa 1.75x, against a near-flat business belt at Ogaki 1.09x, Tajimi 1.03x and Kakamigahara 1.01x. These are markets with the strong foundation of steady year-round business demand, and the room to carry autumn demand into rate remains untouched. As Gifu City at 1.28x and Hashima at 1.34x show within the same business belt, that headroom is not theoretical — given the right conditions, the numbers materialise. Wide-catchment events such as the Gifu Air Base Air Show on 22 November 2026 are a textbook opportunity.
Third, Shirakawa Village peaks in winter, not autumn. Against a seasonal coefficient of 0.89x, its estimated settled ADR in February 2026 reached ¥26,800, the highest of the year. Demand concentrates during the illumination period, and growth is strong at roughly +47% year on year. Treating the Hida area as a single “autumn foliage” story means missing what this market actually is.
Fourth, supply-side activity has entered both the business and tourism belts. Of 2026’s 427 new rooms, 207 belong to Toyoko Inn Gifu in Gifu City, and on 14 September the Hilton Takayama Resort rebrand opens. The confirmed pipeline through 2028 is a single 120-room project in Minokamo, so supply pressure will stay light for the time being. For the business belt, where the rate gap remains, that means an environment that stays hospitable to testing moves that convert demand into rate.
Gifu is a market where a high-rate tourism belt and a room-heavy business belt run in parallel inside one prefecture. The former builds rate on seasonality and the scarcity of its assets; the latter builds volume on stable occupancy. The twofold gap between them is also a measure of how much headroom the prefecture holds as a whole.
⚠ Note on ADR for future dates: Estimated settled ADR figures in this article for August 2026 onward are estimates calculated from selling prices published on OTAs and similar channels as of the survey date (August 2026), and they move as the check-in date approaches. In particular, the October–November 2026 figures show uniformly high seasonal coefficients across every municipality, which may reflect forward-listing levels rather than realised demand. The tier-level structural analysis rests primarily on 2025 confirmed figures, which carry no shift in basis.
Related Reading
- Hyogo’s Hotel Market in 5 Layers 2026: ADR from ¥10,700 to ¥29,600
- Japan Intra-Prefecture ADR Gaps Reach 5.2x: 368 Municipalities Ranked
- Listed vs Settled ADR Gap: Japan’s 46-Prefecture Upside Map 2026
- Japan Autumn 2026 Hotel Price Range: 3.3x CV Gap Across 47 Prefectures
References and Sources
■ Data sources
The universe comprises the approximately 27,000 properties and 1.26 million rooms with confirmed OTA activity, drawn from the roughly 168,000 properties nationwide tracked by MetroEngines Research. For Gifu, coverage spans 22 municipalities hosting three or more properties, totalling 557 properties and 17,129 rooms; municipal estimated settled ADR uses the median across covered properties. New openings are on a confirmed OTA listing basis, and the forward construction plans are extracted from the Ministry of Land, Infrastructure, Transport and Tourism’s Building Construction Statistics Survey.
■ Calculation assumptions
Estimated settled ADR applies category-specific adjustment coefficients to each property’s lowest published plan level (double occupancy, per-room rate, tax-inclusive), producing an estimated rate on a tax-exclusive equivalent basis. Seasonal coefficients are calculated as “the average of October–November 2025 divided by June 2025,” using confirmed figures only to avoid shifts in basis. Tier medians are the median of the estimated settled ADR of the municipalities in each tier, displayed rounded to the nearest ¥100.
■ Limitations and caveats
Figures from August 2026 onward are estimates based on published levels as of the survey date (August 2026) and move as the check-in date approaches. Areas covering only five to eight properties, such as Shirakawa Village and Mino, show volatile monthly figures. Because pre-opening OTA listings begin several months before opening, counts for later years are structurally understated. Cross-checked against property-level actuals disclosed by a listed hotel REIT (184 property-months, April–May 2026), the median error of estimated settled ADR is approximately 7.5%.
■ Market data
- MetroEngines Research — municipal estimated settled ADR and listed prices (June 2025–November 2026; Gifu Prefecture coverage of 557 properties and 17,129 rooms)
- MetroEngines Research & Consulting — new opening data (confirmed OTA listing basis; 33 properties in 2025, 16 in 2026)
■ Government statistics and public data
- Japan Tourism Agency, “Overnight Travel Statistics Survey”
- Ministry of Land, Infrastructure, Transport and Tourism, “Building Construction Statistics Survey” — accommodation construction plans (building-confirmation basis)
- Gifu Prefecture, “Tourism Statistics” (Tourism Planning Division)
- Gifu Prefecture, “Foreign overnight guests in Gifu Prefecture reach a record high of 2.3 million!” (Tourism Promotion Division, announced 3 March 2025). The release has been taken down; the underlying figures originate from the Japan Tourism Agency’s “Overnight Travel Statistics Survey” (2024 annual figures).
■ News and press releases
- Hilton, “JR Central Group and Hilton partner to rebrand and open ‘Hilton Takayama Resort’ in autumn 2026” (June 2025)
- Tetsudo Channel, “‘Hilton Takayama Resort’, Gifu Prefecture’s first Hilton, opens 14 September 2026”
- Travel Watch, “‘Toyoko Inn Gifu’ opening completes presence in all prefectural capitals; 207 rooms, three minutes’ walk from Meitetsu Gifu Station”
- Toyoko Inn Co., Ltd., “Reservations for ‘Toyoko Inn Gifu’ open 27 May”
- “Gifu Air Base Air Show 2026 confirmed for 22 November”
- Gifu City, “Gifu Nobunaga Festival”