

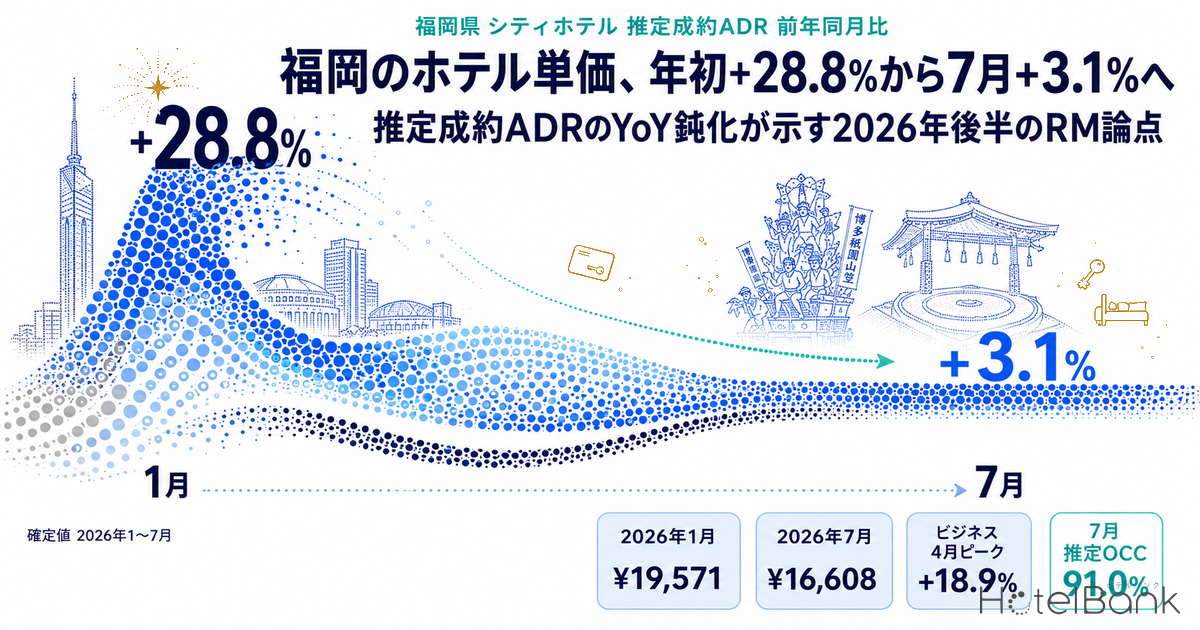
Estimated settled ADR at city hotels in Fukuoka surged +28.8% year on year in January 2026 (¥19,571 / N=38 properties vs ¥15,198 / N=36 properties), then decelerated to +1.2% in June and +3.1% in July. Business hotels peaked at +18.9% in April and came in at +3.6% in July (¥10,382 / N=340 properties vs ¥10,023 / N=329 properties). Rate levels themselves continue to run above the prior year, but the rate of increase has clearly flattened. This article uses only year-on-year comparisons between confirmed months to pin down when the slowdown occurred, why the path differs by segment, and what that means for pricing design in the second half of 2026.
About the data in this article
Scope: city hotels in Fukuoka Prefecture N=40 properties and business hotels N=340 properties (both as of July 2026). The price metric is estimated settled ADR (the transaction price level estimated from OTA and other sales data, tax-exclusive equivalent); occupancy is an estimate based on OTA-listed inventory. Definitions for both appear at the end of the article. Data as of September 6, 2026.
- — Estimated settled ADR at city hotels moved from +28.8% in January 2026 (¥19,571) to +3.1% in July (¥16,608). Most of the year’s growth was created in the first three months.
- — The slowdown is driven not by weakness in 2026 but by the step-up in the 2025 base. The July year-on-year difference was +¥502 for city hotels and +¥359 for business hotels, so levels remain above the prior year.
- — The stretches of double-digit growth were January–March for city hotels and March–May for business hotels — a gap of about two months. Comparing year-on-year rates across segments does not measure the strength of demand.
- — Flattening rates and solid inventory absorption can coexist. Estimated OCC in July 2026 was 91.0% for city hotels and 91.8% for business hotels (based on OTA-listed inventory, 31-day average).
- — The pattern of a high start to the year and a low summer is specific to 2026. In both 2024 and 2025, January was the cheapest month of the year and the annual peak fell in November.
From a surge at the start of the year to a summer plateau — the year-on-year path across seven confirmed months
First, a note on the basis. The year-on-year comparisons used here are taken only between months that are confirmed values (history basis) in both 2025 and 2026. From August 2026 onward the figures are estimates based on current sales conditions, and comparing those directly with confirmed values is structurally biased upward, so they are excluded from the year-on-year analysis. That leaves seven comparable months, January through July 2026.
City hotels jumped +28.8% (+¥4,373) in January and held double-digit growth through the first three months of the year, at +16.4% in March and +12.0% in February. Growth then fell abruptly to +2.2% (+¥393) in April, and has since stayed in the low-to-mid single digits: +6.4% in May, +1.2% (+¥193) in June and +3.1% (+¥502) in July. In effect, most of the year’s growth was generated in the opening three months.
Business hotels followed a different path. The year opened at +14.4% — roughly half the city-hotel pace — narrowed to +5.4% in February, then built a spring peak at +11.1% in March and +18.9% (+¥1,864) in April. From there it decelerated in stages over three months: +10.0% in May, +6.5% in June and +3.6% in July. In other words, the stretch of sustained double-digit growth ran January–March for city hotels and March–May for business hotels, a gap of roughly two months. Re-aggregated into quarters, first-half growth for the two segments looks evenly matched, yet the underlying movements run in opposite directions.
Source: MetroEngines Research; compiled by the HotelBank Editorial Team
In level terms, estimated settled ADR at city hotels rose from ¥13,406 in January 2024 to ¥19,571 in January 2026 — +46.0% over two years. Within 2026, the monthly sequence runs ¥19,571 in January, ¥17,736 in February, ¥17,937 in March, ¥17,899 in April, ¥18,846 in May, ¥16,011 in June and ¥16,608 in July, making the start of the year the annual high. That sequence is specific to 2026, however: in 2024 and 2025, January (¥13,406 / ¥15,198) was the cheapest month of the year, and the annual peak fell in November in both years (¥17,244 / ¥20,829). What the three years share is a late-autumn peak; the elevated start to 2026 is a pattern unique to this year, inherited from the step-up in levels during the second half of 2025. For the November demand that actually creates that late-autumn peak, we examined day by day how far weekday rates can be pushed in Sumo Kyushu Basho 2026: Fukuoka Weekday Rates +9.7% Actual, +3.3% Now.
Month-by-month comparison of confirmed values — the timing of the slowdown differs by segment
The table below sets out the seven confirmed months by level, absolute difference and growth rate. N= is the number of properties used to calculate estimated settled ADR in each month.
| Stay month | City 2025 | City 2026 | City YoY | Business 2025 | Business 2026 | Business YoY |
|---|---|---|---|---|---|---|
| January | ¥15,198 | ¥19,571 | +28.8% | ¥9,033 | ¥10,332 | +14.4% |
| February | ¥15,840 | ¥17,736 | +12.0% | ¥10,510 | ¥11,076 | +5.4% |
| March | ¥15,408 | ¥17,937 | +16.4% | ¥9,890 | ¥10,983 | +11.1% |
| April | ¥17,506 | ¥17,899 | +2.2% | ¥9,874 | ¥11,738 | +18.9% |
| May | ¥17,717 | ¥18,846 | +6.4% | ¥10,456 | ¥11,497 | +10.0% |
| June | ¥15,818 | ¥16,011 | +1.2% | ¥9,414 | ¥10,030 | +6.5% |
| July | ¥16,106 | ¥16,608 | +3.1% | ¥10,023 | ¥10,382 | +3.6% |
N= (number of properties used to calculate estimated settled ADR) — city: 36–37 properties in 2025 / 38–40 in 2026; business: 324–331 properties in 2025 / 338–341 in 2026. All figures are confirmed values (history basis). Source: MetroEngines Research; compiled by the HotelBank Editorial Team
Source: MetroEngines Research; compiled by the HotelBank Editorial Team
The key point in this table is that the slowdown is driven not by weakness in 2026 but by the way the 2025 base stepped up through the second half of that year. City hotels in 2025 started low, at ¥15,198 in January and ¥15,408 in March, jumped to ¥17,506 in April, and climbed to ¥18,258 in October and ¥20,829 in November. When the denominator rises, the same absolute increase produces a smaller percentage. City hotels in July 2026 were only +¥502 above the prior year — less because July 2026 was weak than because July 2025 had already recovered to a higher level.
The gap between segments is explained by the same base effect. Business hotels in April 2025 came in at ¥9,874, below the ¥10,510 recorded that February — a dip in the series. April 2026 at ¥11,738 was measured against that dip, producing the large +18.9% reading. City hotels, by contrast, faced an already-high ¥17,506 in April 2025, compressing 2026 growth to +2.2%. In short, comparing year-on-year figures directly across segments does not measure the strength of demand. In practice, the absolute year-on-year difference (city +¥502 and business +¥359 in July) and your own property’s level in that month are the safer basis for judgment.
The city-to-business price multiple was 1.61x in July 2025 and 1.60x in July 2026 — essentially unchanged. In January 2026 the gap widened to 1.89x, confirming a structure in which only the city side jumps at the start of the year, while the two segments line up at similar ratios in summer. If your property anchors its pricing to the segment above it, the months when this multiple widens and the months when it closes need to be treated separately.
Recent booking pace — October weekday and weekend booking curves
While year-on-year rate growth has flattened, recent inventory absorption has held up well. Here we take a Friday in October (October 2, weekend demand) and a Tuesday (October 6, weekday demand) and track the build-up in estimated OCC (based on OTA-listed inventory) from 45 days out to the latest observation.
Source: MetroEngines Research; compiled by the HotelBank Editorial Team
For Friday, October 2, city hotels built from 79.5% at 45 days out to 82.0% at 30 days out and 82.7% at the latest observation (27 days out), a gain of +3.2 points. Business hotels moved 75.6% → 80.7% → 81.9% over the same window, +6.3 points — inventory absorbed at twice the city-hotel pace. For Tuesday, October 6, city hotels went from 75.1% to 77.8% (through 31 days out, +2.7 points) and business hotels from 69.6% to 74.2% (same window, +4.6 points), so the business side gains faster on weekdays as well.
This shape indicates that business-hotel demand is concentrated in shorter lead times. At 45 days out it starts from a lower position than city hotels, but it closes the gap quickly from there. City hotels, conversely, are already at roughly 80% at 45 days out, which limits the room left to build. Monthly estimated OCC points the same way: in July 2026, Fukuoka Prefecture recorded 91.0% for city hotels (31-day average) and 91.8% for business hotels (same basis) — high levels in both segments.
Fukuoka in 2026 is therefore in a phase where inventory is selling but ADR gains are no longer as effective as they were at the start of the year. The narrowing growth rate reflects the fact that the prior-year base has already reached a high level, not a retreat in demand, and the next move shifts from lifting the whole book to selecting the room that remains by month and by day of week. Note also that the Kyushu recovery-support travel subsidy (a 50% subsidy rate in Fukuoka Prefecture) applies to stays from October 1, so the impact of that discount funding should be read alongside October’s booking progress.
For revenue managers running city and business hotels in Fukuoka — implications and an action plan
(1) Do not read a narrowing year-on-year figure as falling demand. City hotels were +3.1% in July, but the absolute difference was +¥502 and the level remains above the prior year. Estimated OCC in the same month was a high 91.0%. The growth rate fell because the 2025 denominator stepped up, so building your budget and incentive design around growth rates alone risks a more pessimistic read than the situation warrants. Evaluate the absolute year-on-year difference alongside your own property’s level.
(2) The months where rates can be raised differ between winter and summer. For city hotels, market estimated settled ADR reaches ¥19,571 in January, while June sits at ¥16,011 and July at ¥16,608 — roughly ¥3,000 lower. That said, this pattern of a high start and a low summer is specific to 2026; in 2024 and 2025 January was in fact the cheapest month of the year (January 2024 ¥13,406 < June ¥14,658; January 2025 ¥15,198 < June ¥15,818). Rather than a uniform annual approach, a two-tier rate-revision calendar — concentrating increases in the months where rates grow (the start of the year and late autumn) and shifting to occupancy in the trough months — fits the shape of the market more closely.
(3) Hold the cross-segment price multiple by month. The city-to-business ratio was 1.89x in January 2026 and 1.60x in July, a wide monthly swing. If you set your rates by reference to the segment above you, consider holding a monthly multiple rather than a fixed annual one. In summer in particular the two segments line up at similar ratios, so applying the same follow-through as at the start of the year tends to leave you priced high.
(4) Design the business segment around a late build-up. For Friday, October 2, business hotels built from 75.6% at 45 days out to 81.9% at the latest observation, +6.3 points. Even when they sit below city hotels (79.5%) at 45 days out, the pattern shows them closing the gap afterwards. Cutting rates early on the basis of the 45-day cross-section alone risks absorbing later demand cheaply. A design that waits for the 30-day cross-section before deciding is worth considering.
| Time horizon | Move | Decision trigger | Objective |
|---|---|---|---|
| Today – this week | Line up your own confirmed seven-month ADR (January–July) against the confirmed market figures and take stock in absolute year-on-year yen terms | If your July still sits below the market level of ¥16,608 (city) / ¥10,382 (business), break down the drivers | Strip out the illusion created by growth rates and identify the months you actually left money on the table |
| Today – this week | Reconcile your October booking pace against the market curve, separately for weekdays and weekends | At the 30-days-out cross-section, extract the dates that deviate sharply from the market (Friday: city 82.0% / business 80.7%) | Separate the dates with plenty of remaining inventory from those with little, and concentrate tactics where they matter |
| Within two weeks | Test whether the trigger point for a rate cut can be pushed back from 45 days out to 30 days out | Target the dates where the business-hotel segment built up +6.3 points between 45 days out and the latest observation | Reduce the opportunity cost of absorbing last-minute demand at discounted rates |
| Within two weeks | Switch the multiplier used to reference the upper segment from an annual constant to a monthly one | Review on the premise that the city-to-business ratio swings by month — 1.89x in January versus 1.60x in July | Correct summer overpricing and early-year under-capture at the same time |
| Looking to next month | Redesign the rate-revision calendar around two tiers: growth months and trough months | The roughly ¥3,500 monthly spread between city January ¥19,571 and June ¥16,011 appears in 2026 (in 2024 and 2025 January was the cheapest month of the year — the opposite direction) | Concentrate increases in the months where they work, and fill the trough months with occupancy |
| Looking to next month | Rebuild the 2027 budget on an absolute year-on-year difference basis | Do not simply extrapolate the 2026 path in which growth narrowed from +28.8% at the start of the year to +3.1% in July | Set targets that are not distorted by base effects |
Source: MetroEngines Research; compiled by the HotelBank Editorial Team
Summary — three yardsticks
First, look at the absolute year-on-year difference rather than the growth rate. City hotels were +3.1% in July 2026, but +¥502 in yen terms. That is small next to January’s +28.8% (+¥4,373), yet given that the prior-year base has already stepped up, holding the level is itself an achievement. A growth rate depends heavily on its denominator and is hard to use on its own as a management yardstick.
Second, the timing of the slowdown differs by segment. City hotels concentrated their double-digit growth in January–March and dropped to the low single digits from April. Business hotels built a peak in March–May and decelerated later, at +6.5% in June and +3.6% in July. Even within the same prefecture, decision cycles for rate revisions fit reality better when held about two months apart by segment.
Third, flattening rates and solid inventory absorption can coexist. Estimated OCC in July 2026 was 91.0% for city hotels and 91.8% for business hotels, and October booking pace has built steadily from 45 days out to the latest observation. Rates are not flat because rooms are not selling; they are flat on top of an already high level. The next increment comes not from an across-the-board increase but from selecting the room that remains by month, by day of week and by segment.
About the data
• Definition of estimated OCC (OTA-listed inventory basis): occupancy on an OTA-listed inventory basis = 100 − 100 × number of rooms still listed on OTAs ÷ total rooms. It is an estimate based on how listed inventory is absorbed on OTAs and is defined differently from actual room occupancy (it reads higher).
• Booking curve: based on observations from 45 days before the stay date through the latest observation.
• Definition of estimated settled ADR: the transaction price level (tax-exclusive equivalent) estimated from OTA and other sales data (lowest-plan level × segment coefficient, ensembled across multiple channels). Past months are confirmed values; the current and future months are estimates based on current sales conditions. Median error against published operating results is 6.6%. The year-on-year comparisons in this article are calculated only between confirmed months in 2025 and 2026; estimates from August 2026 onward are excluded.
• Breakdown of N=: Fukuoka Prefecture city hotels N=40 properties (July 2026) and N=37 properties (July 2025); business hotels N=340 properties (July 2026) and N=329 properties (July 2025). Estimated OCC covers 36 city and 315 business properties as of July 2026. The booking curve covers 35 city and 313 business properties.
• Data as of: September 6, 2026. Sales conditions and inventory change daily, so the figures in this article are a snapshot at the time of retrieval.
Related reading
- Fukuoka Settled ADR Slows +14.4% to +3.6% — Breakfast Premium Next?
- Sumo Kyushu Basho 2026: Fukuoka Weekday Rates +9.7% Actual, +3.3% Now
- Hakozakigu Hojoya 2026: Fukuoka Demand Peaks Opening Weekend +3.8pt
- Obon T-7: Kyushu’s 31.7pt Gap — Fukuoka 73.0%, Kagoshima 41.3%
- Fukuoka Hotel Supply 2026-2028: ~1,000 Rooms/Year in Hakata & Tenjin